| Param | Original file | Final file |
|---|---|---|
| Filename | modeM0/AS1A11_037T01_9000004818cztM0_level2.fits | modeM0/AS1A11_037T01_9000004818cztM0_level2_quad_clean.evt |
| Size (bytes) | 223,274,880 | 250,882,560 |
| Size | 212.9 MB | 239.3 MB |
| Events in quadrant A | 1,347,870 | 1,558,228 |
| Events in quadrant B | 1,260,688 | 1,519,021 |
| Events in quadrant C | 1,341,916 | 1,514,052 |
| Events in quadrant D | 1,129,744 | 1,326,233 |
| Mode M9 | |||
|---|---|---|---|
| Quadrant | BADHDUFLAG | Total packets | Discarded packets |
| A | 0 | 71 | 0 |
| B | 0 | 71 | 0 |
| C | 0 | 71 | 0 |
| D | 0 | 71 | 0 |
| Mode M0 | |||
|---|---|---|---|
| Quadrant | BADHDUFLAG | Total packets | Discarded packets |
| A | 0 | 61204 | 0 |
| B | 0 | 69834 | 0 |
| C | 0 | 55245 | 0 |
| D | 0 | 83645 | 0 |
| Mode SS | |||
|---|---|---|---|
| Quadrant | BADHDUFLAG | Total packets | Discarded packets |
| A | 0 | 500 | 0 |
| B | 0 | 500 | 0 |
| C | 0 | 500 | 0 |
| D | 0 | 500 | 0 |
| Quadrant | Total seconds | Saturated seconds | Saturation percentage |
|---|---|---|---|
| A | 24415 | 729 | 2.985869% |
| B | 24415 | 1788 | 7.323367% |
| C | 24415 | 310 | 1.269711% |
| D | 24415 | 1402 | 5.742371% |
Noise dominated data is calculated using 1-second bins in cleaned event files. If a bin has >2000 counts, and if more than 50% of those come from <1% of pixels, then it is considered to be noise-dominated and hence unusable.
| Quadrant | # 1 sec bins | Bins with >0 counts | Bins with >2000 counts | High rate bins dominated by noise | Noise dominated (total time) | Noise dominated (detector-on time) | Marked lightcurve |
|---|---|---|---|---|---|---|---|
| A | 31579 | 24411 | 0 | 0 | 0.00% | 0.00% |  |
| B | 31579 | 24379 | 0 | 0 | 0.00% | 0.00% |  |
| C | 31579 | 24402 | 0 | 0 | 0.00% | 0.00% | 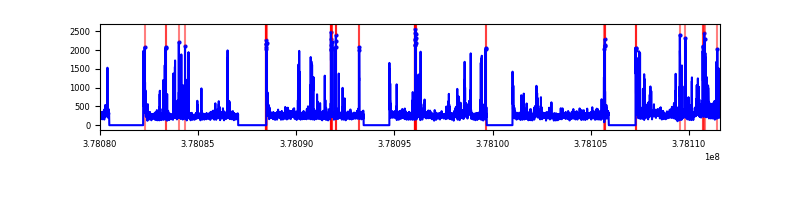 |
| D | 31579 | 24397 | 0 | 0 | 0.00% | 0.00% |  |
Top three noisy pixels from each quadrant. If the there are fewer than three noisy pixels in the level2.evt file, extra rows are filled as -1
| Pixel properties | Quadrant properties | ||||||
|---|---|---|---|---|---|---|---|
| Quadrant | DetID | PixID | Counts | Sigma | Mean | Median | Sigma |
| A | 0 | 29 | 1157 | 9.47 | 351 | 332 | 87.1 |
| A | 7 | 110 | 1097 | 8.78 | 351 | 332 | 87.1 |
| A | 9 | 19 | 1071 | 8.48 | 351 | 332 | 87.1 |
| B | 2 | 9 | 1178 | 12.94 | 334 | 320 | 66.3 |
| B | 3 | 80 | 983 | 10.0 | 334 | 320 | 66.3 |
| B | 2 | 8 | 931 | 9.22 | 334 | 320 | 66.3 |
| C | 1 | 81 | 1111 | 8.62 | 354 | 333 | 90.2 |
| C | 1 | 80 | 1081 | 8.29 | 354 | 333 | 90.2 |
| C | 3 | 203 | 1036 | 7.79 | 354 | 333 | 90.2 |
| D | 10 | 189 | 859 | 6.49 | 323 | 294 | 87.1 |
| D | 10 | 113 | 837 | 6.23 | 323 | 294 | 87.1 |
| D | 4 | 160 | 834 | 6.2 | 323 | 294 | 87.1 |
Histogram calculated using DETX and DETY for each event in the final _common_clean file
| Quadrant A | 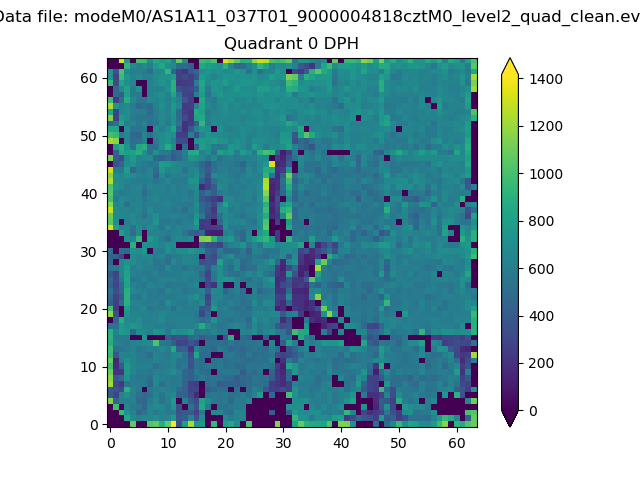 |
 |
Quadrant B |
|---|---|---|---|
| Quadrant D |  |
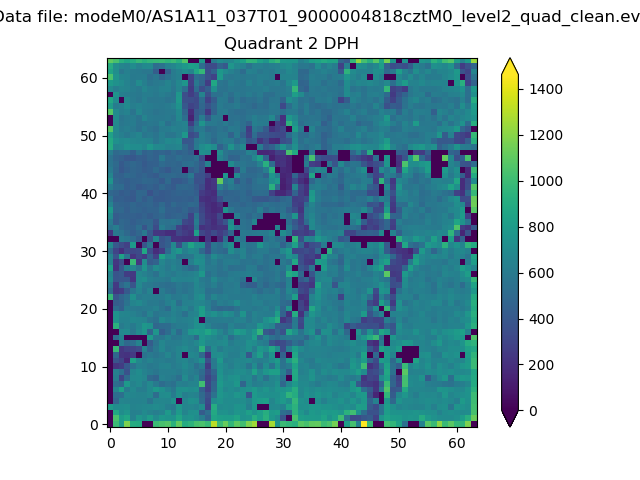 |
Quadrant C |
| Plot type | Count rate plots | Images |
|---|---|---|
| Comparison with Poisson distribution Blue bars denote a histogram of data divided into 1 sec bins. Red curve is a Poisson curve with rate = median count rate of data. |
 |
 |
| Quadrant-wise count rates Data is divided into 100 sec bins |
 |
|
| Module-wise count rates for Quadrant A Data is divided into 100 sec bins |
 |
 |
| Module-wise count rates for Quadrant B Data is divided into 100 sec bins |
 |
 |
| Module-wise count rates for Quadrant C Data is divided into 100 sec bins |
 |
 |
| Module-wise count rates for Quadrant D Data is divided into 100 sec bins |
 |
 |
| Parameter | Plot |
|---|---|
| CZT HV Monitor |  |
| D_VDD |  |
| Temperature 1 |  |
| Veto HV Monitor |  |
| Veto LLD |  |
| Alpha Counter |  |
| _CPM_Rate |  |
| CZT Counter |  |
| +2.5 Volts monitor |  |
| +5 Volts monitor |  |
| _ROLL_ROT | 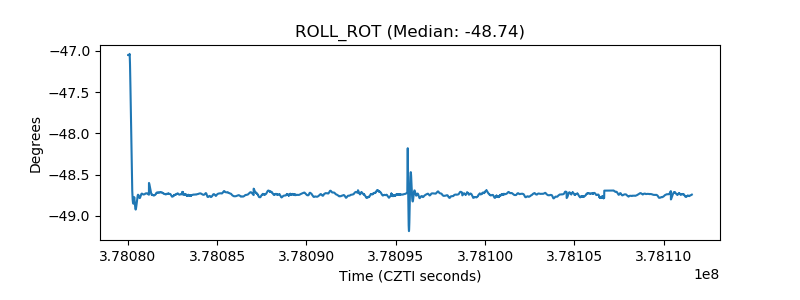 |
| _Roll_DEC |  |
| _Roll_RA |  |
| Veto Counter | 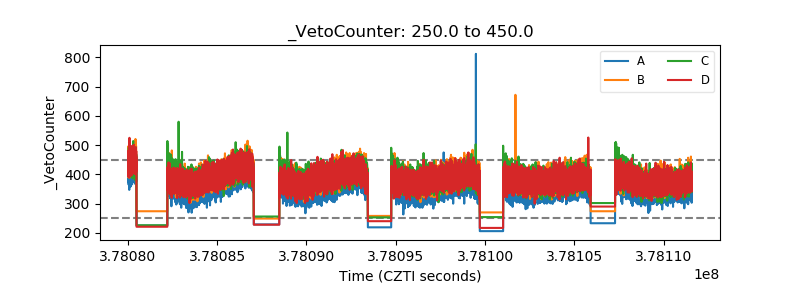 |