| Param | Original file | Final file |
|---|---|---|
| Filename | modeM0/AS1A11_037T01_9000004818_33746cztM0_level2.evt | modeM0/AS1A11_037T01_9000004818_33746cztM0_level2_quad_clean.evt |
| Size (bytes) | 555,762,240 | 90,408,960 |
| Size | 530.0 MB | 86.2 MB |
| Events in quadrant A | 3,520,676 | 592,663 |
| Events in quadrant B | 4,668,100 | 579,642 |
| Events in quadrant C | 3,191,633 | 597,824 |
| Events in quadrant D | 5,056,054 | 559,988 |
| Mode M9 | |||
|---|---|---|---|
| Quadrant | BADHDUFLAG | Total packets | Discarded packets |
| A | 0 | 24 | 0 |
| B | 0 | 24 | 0 |
| C | 0 | 24 | 0 |
| D | 0 | 25 | 0 |
| Mode M0 | |||
|---|---|---|---|
| Quadrant | BADHDUFLAG | Total packets | Discarded packets |
| A | 0 | 14399 | 3 |
| B | 0 | 17811 | 2 |
| C | 0 | 12836 | 2 |
| D | 0 | 18882 | 2 |
| Mode SS | |||
|---|---|---|---|
| Quadrant | BADHDUFLAG | Total packets | Discarded packets |
| A | 0 | 120 | 0 |
| B | 0 | 120 | 0 |
| C | 0 | 120 | 0 |
| D | 0 | 120 | 0 |
| Quadrant | Total seconds | Saturated seconds | Saturation percentage |
|---|---|---|---|
| A | 5826 | 210 | 3.604531% |
| B | 5826 | 614 | 10.538963% |
| C | 5826 | 68 | 1.167182% |
| D | 5826 | 322 | 5.526948% |
Noise dominated data is calculated using 1-second bins in cleaned event files. If a bin has >2000 counts, and if more than 50% of those come from <1% of pixels, then it is considered to be noise-dominated and hence unusable.
| Quadrant | # 1 sec bins | Bins with >0 counts | Bins with >2000 counts | High rate bins dominated by noise | Noise dominated (total time) | Noise dominated (detector-on time) | Marked lightcurve |
|---|---|---|---|---|---|---|---|
| A | 7260 | 5827 | 223 | 223 | 3.07% | 3.83% | 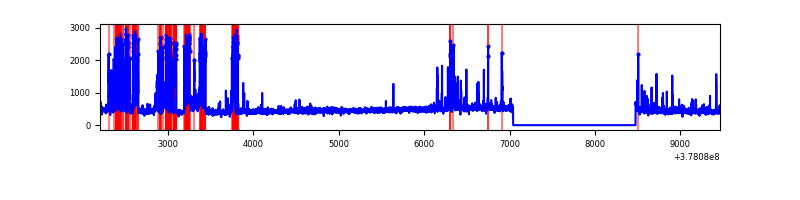 |
| B | 7260 | 5827 | 453 | 453 | 6.24% | 7.77% |  |
| C | 7260 | 5827 | 69 | 69 | 0.95% | 1.18% | 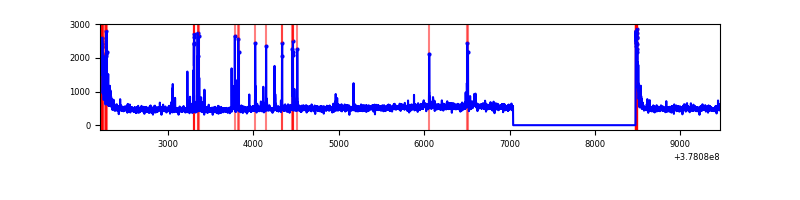 |
| D | 7260 | 5827 | 281 | 281 | 3.87% | 4.82% | 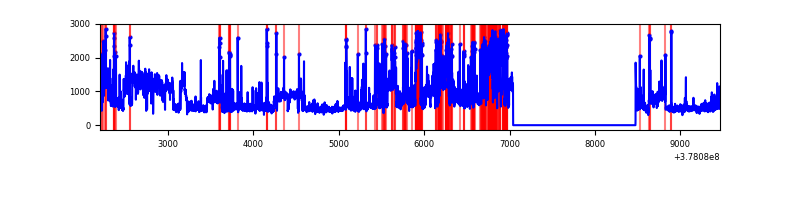 |
Top three noisy pixels from each quadrant. If the there are fewer than three noisy pixels in the level2.evt file, extra rows are filled as -1
| Pixel properties | Quadrant properties | ||||||
|---|---|---|---|---|---|---|---|
| Quadrant | DetID | PixID | Counts | Sigma | Mean | Median | Sigma |
| A | 14 | 4 | 876893 | 6669.97 | 656 | 643 | 131.4 |
| A | 15 | 237 | 88796 | 671.02 | 656 | 643 | 131.4 |
| A | 13 | 254 | 10996 | 78.81 | 656 | 643 | 131.4 |
| B | 5 | 172 | 1340099 | 11080.65 | 637 | 618 | 120.9 |
| B | 0 | 229 | 211913 | 1747.9 | 637 | 618 | 120.9 |
| B | 4 | 251 | 192753 | 1589.4 | 637 | 618 | 120.9 |
| C | 15 | 214 | 253640 | 1682.12 | 654 | 658 | 150.4 |
| C | 0 | 10 | 175996 | 1165.85 | 654 | 658 | 150.4 |
| C | 9 | 187 | 133308 | 882.01 | 654 | 658 | 150.4 |
| D | 8 | 195 | 1509301 | 8657.03 | 634 | 623 | 174.3 |
| D | 12 | 233 | 347719 | 1991.69 | 634 | 623 | 174.3 |
| D | 2 | 250 | 239970 | 1373.41 | 634 | 623 | 174.3 |
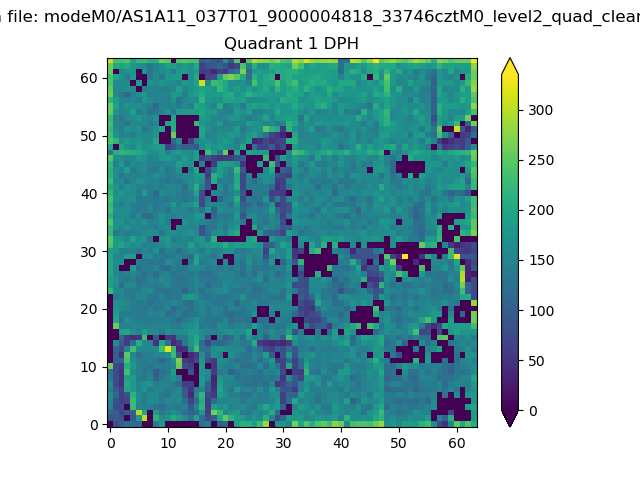
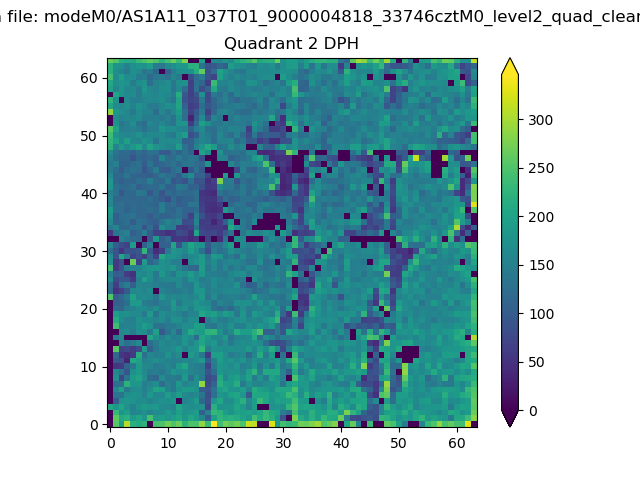
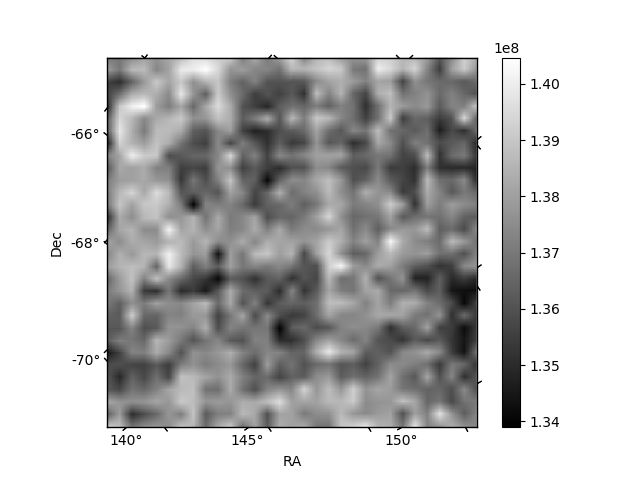
Histogram calculated using DETX and DETY for each event in the final _common_clean file
| Quadrant A |  |
 |
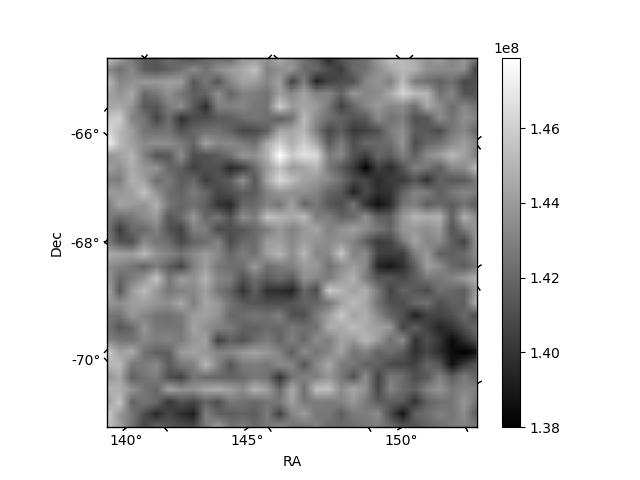
Quadrant B |
|---|---|---|---|
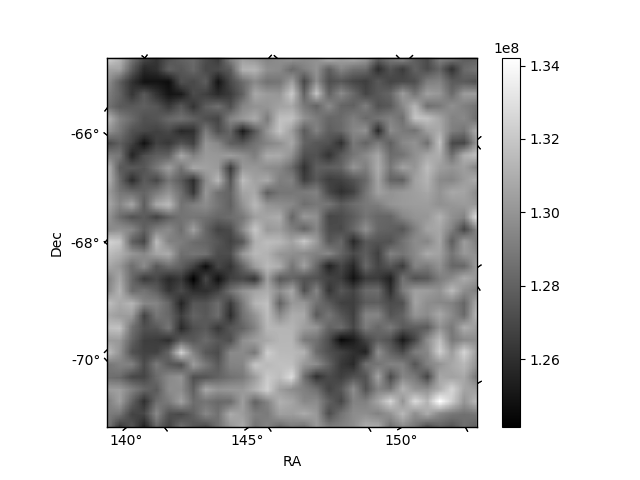
| Quadrant D |  |
 |
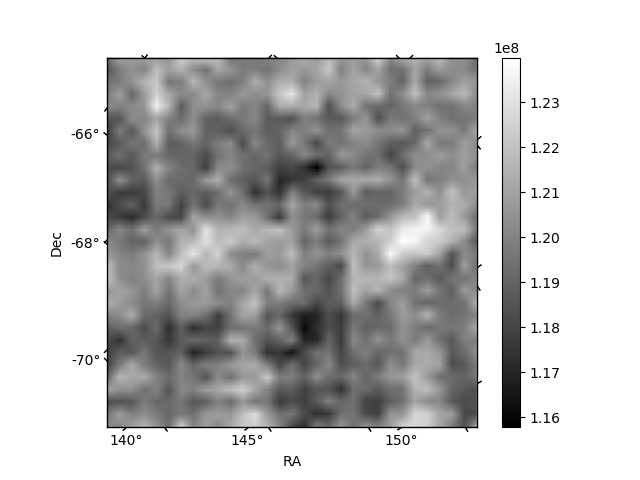
Quadrant C |
| Plot type | Count rate plots | Images |
|---|---|---|
| Comparison with Poisson distribution Blue bars denote a histogram of data divided into 1 sec bins. Red curve is a Poisson curve with rate = median count rate of data. |
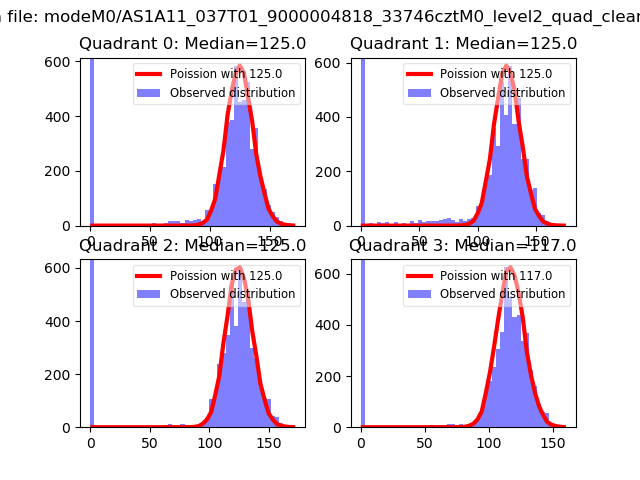 |
 |
| Quadrant-wise count rates Data is divided into 100 sec bins |
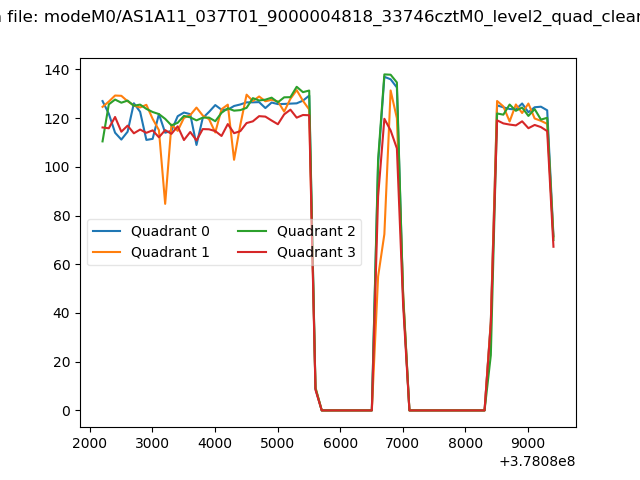 |
|
| Module-wise count rates for Quadrant A Data is divided into 100 sec bins |
 |
 |
| Module-wise count rates for Quadrant B Data is divided into 100 sec bins |
 |
 |
| Module-wise count rates for Quadrant C Data is divided into 100 sec bins |
 |
 |
| Module-wise count rates for Quadrant D Data is divided into 100 sec bins |
 |
 |
| Parameter | Plot |
|---|---|
| CZT HV Monitor |  |
| D_VDD | 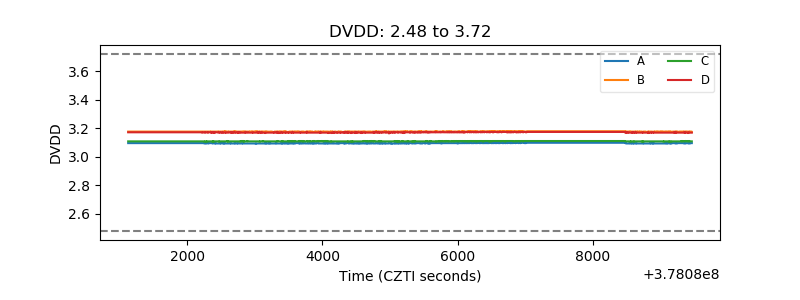 |
| Temperature 1 | 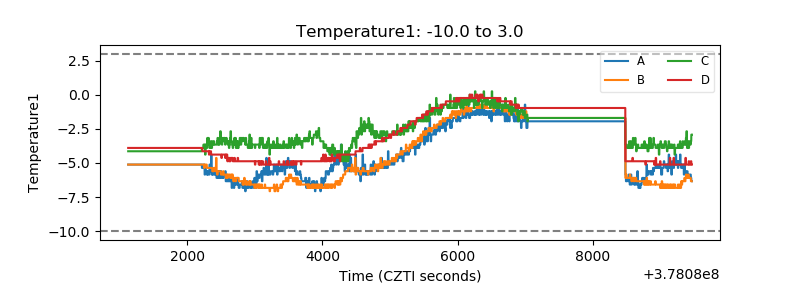 |
| Veto HV Monitor | 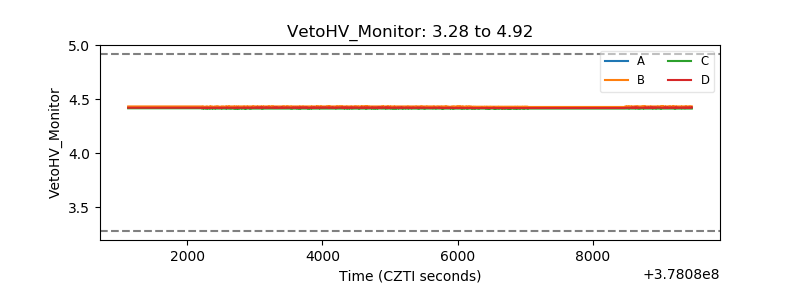 |
| Veto LLD | 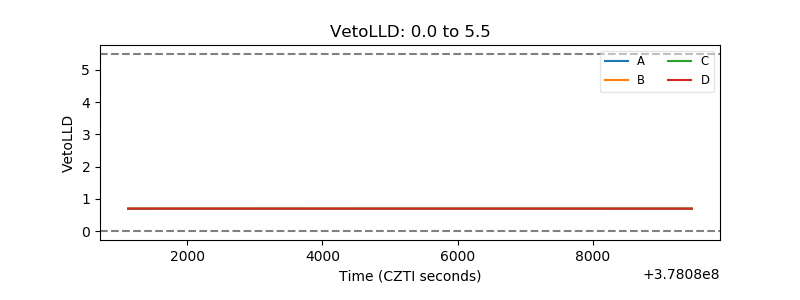 |
| Alpha Counter | 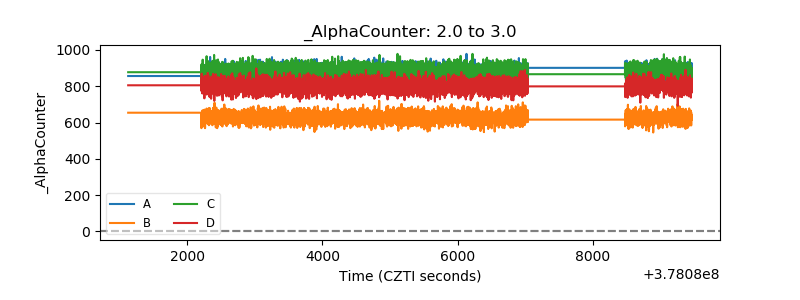 |
| _CPM_Rate | 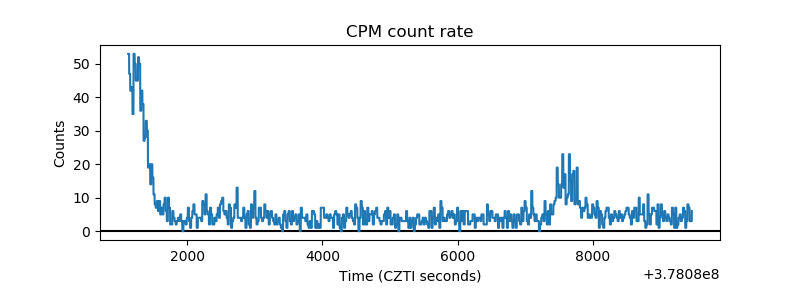 |
| CZT Counter | 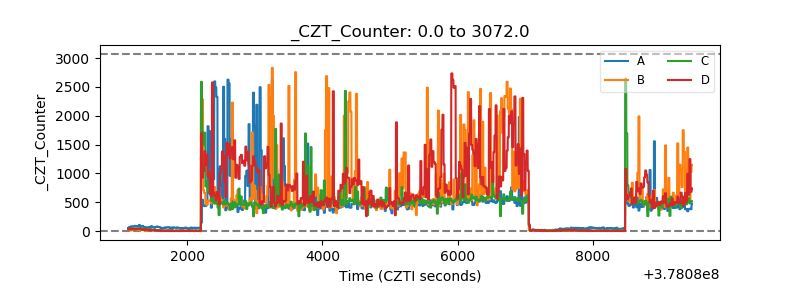 |
| +2.5 Volts monitor |  |
| +5 Volts monitor |  |
| _ROLL_ROT | 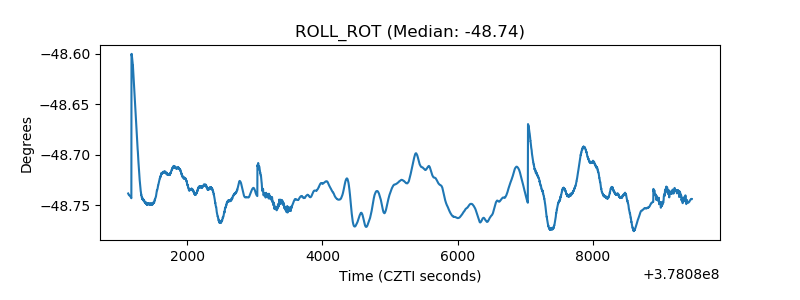 |
| _Roll_DEC | 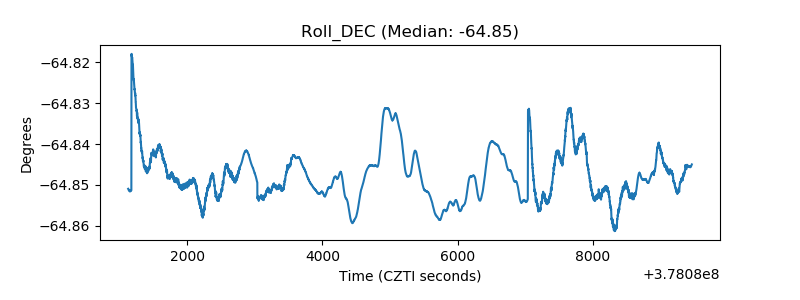 |
| _Roll_RA | 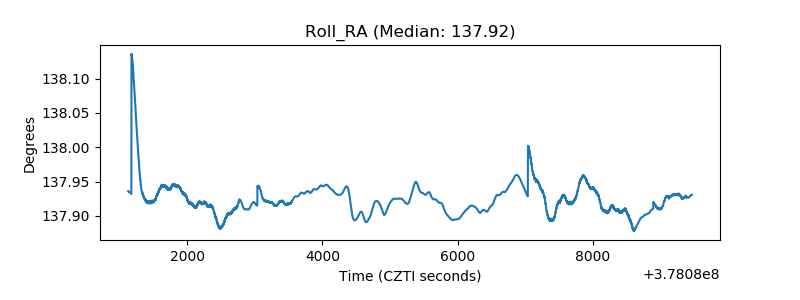 |
| Veto Counter | 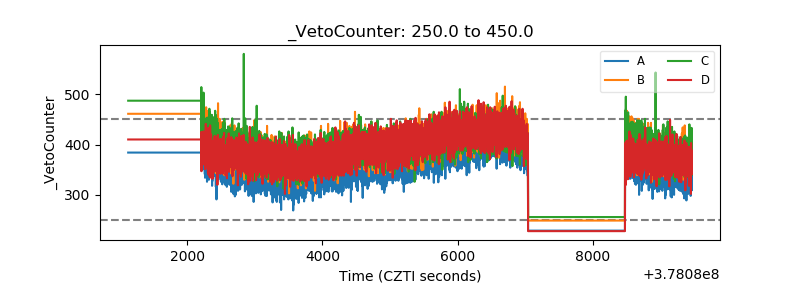 |