| Param | Original file | Final file |
|---|---|---|
| Filename | modeM0/AS1A11_037T01_9000004818_33747cztM0_level2.evt | modeM0/AS1A11_037T01_9000004818_33747cztM0_level2_quad_clean.evt |
| Size (bytes) | 589,057,920 | 96,497,280 |
| Size | 561.8 MB | 92.0 MB |
| Events in quadrant A | 4,207,785 | 628,598 |
| Events in quadrant B | 4,638,105 | 632,998 |
| Events in quadrant C | 3,452,396 | 635,105 |
| Events in quadrant D | 5,125,379 | 595,840 |
| Mode M9 | |||
|---|---|---|---|
| Quadrant | BADHDUFLAG | Total packets | Discarded packets |
| A | 0 | 27 | 0 |
| B | 0 | 27 | 0 |
| C | 0 | 27 | 0 |
| D | 0 | 27 | 0 |
| Mode M0 | |||
|---|---|---|---|
| Quadrant | BADHDUFLAG | Total packets | Discarded packets |
| A | 0 | 16805 | 3 |
| B | 0 | 17835 | 2 |
| C | 0 | 13561 | 2 |
| D | 0 | 19283 | 2 |
| Mode SS | |||
|---|---|---|---|
| Quadrant | BADHDUFLAG | Total packets | Discarded packets |
| A | 0 | 128 | 0 |
| B | 0 | 128 | 0 |
| C | 0 | 128 | 0 |
| D | 0 | 128 | 0 |
| Quadrant | Total seconds | Saturated seconds | Saturation percentage |
|---|---|---|---|
| A | 6150 | 206 | 3.349593% |
| B | 6150 | 369 | 6.000000% |
| C | 6150 | 70 | 1.138211% |
| D | 6150 | 216 | 3.512195% |
Noise dominated data is calculated using 1-second bins in cleaned event files. If a bin has >2000 counts, and if more than 50% of those come from <1% of pixels, then it is considered to be noise-dominated and hence unusable.
| Quadrant | # 1 sec bins | Bins with >0 counts | Bins with >2000 counts | High rate bins dominated by noise | Noise dominated (total time) | Noise dominated (detector-on time) | Marked lightcurve |
|---|---|---|---|---|---|---|---|
| A | 8897 | 6152 | 103 | 103 | 1.16% | 1.67% | 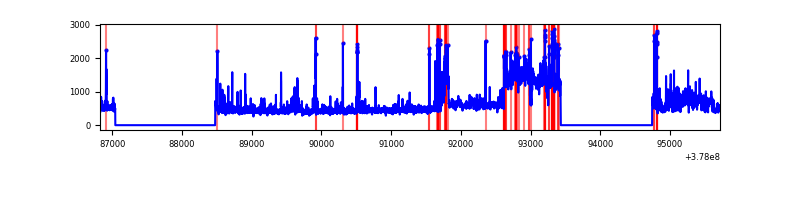 |
| B | 8897 | 6152 | 286 | 286 | 3.21% | 4.65% | 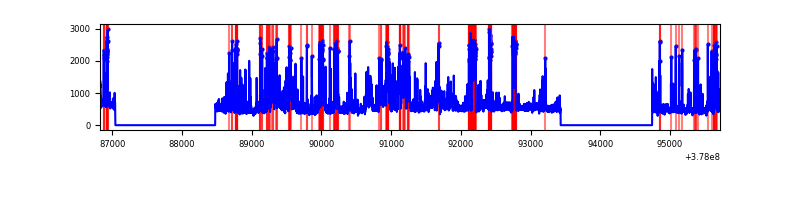 |
| C | 8897 | 6152 | 62 | 62 | 0.70% | 1.01% | 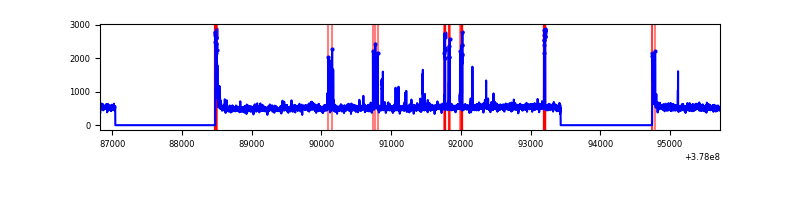 |
| D | 8897 | 6152 | 191 | 191 | 2.15% | 3.10% | 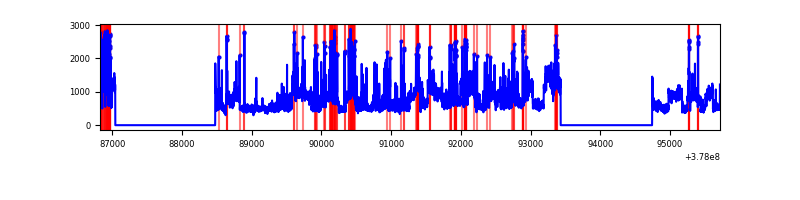 |
Top three noisy pixels from each quadrant. If the there are fewer than three noisy pixels in the level2.evt file, extra rows are filled as -1
| Pixel properties | Quadrant properties | ||||||
|---|---|---|---|---|---|---|---|
| Quadrant | DetID | PixID | Counts | Sigma | Mean | Median | Sigma |
| A | 15 | 169 | 1135939 | 8057.98 | 701 | 687 | 140.9 |
| A | 14 | 4 | 185707 | 1313.27 | 701 | 687 | 140.9 |
| A | 15 | 237 | 126029 | 889.67 | 701 | 687 | 140.9 |
| B | 5 | 172 | 909483 | 6871.14 | 693 | 675 | 132.3 |
| B | 15 | 222 | 541901 | 4092.0 | 693 | 675 | 132.3 |
| B | 0 | 189 | 138763 | 1044.03 | 693 | 675 | 132.3 |
| C | 15 | 214 | 268718 | 1675.94 | 693 | 698 | 159.9 |
| C | 3 | 233 | 147669 | 919.01 | 693 | 698 | 159.9 |
| C | 9 | 187 | 145908 | 908.0 | 693 | 698 | 159.9 |
| D | 8 | 195 | 1499738 | 8118.94 | 679 | 665 | 184.6 |
| D | 1 | 47 | 240280 | 1297.75 | 679 | 665 | 184.6 |
| D | 2 | 250 | 177399 | 957.19 | 679 | 665 | 184.6 |
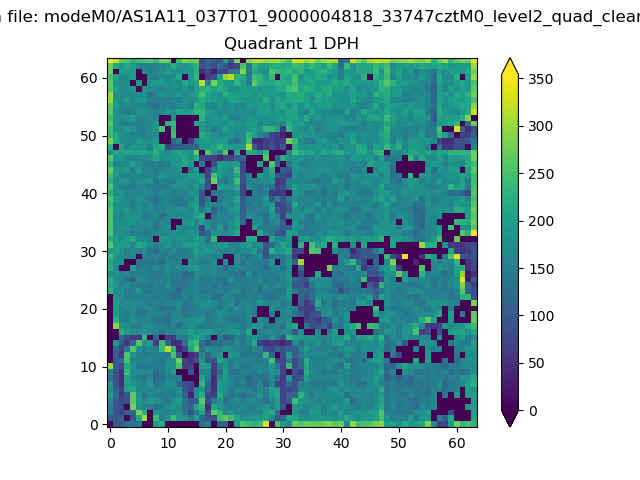
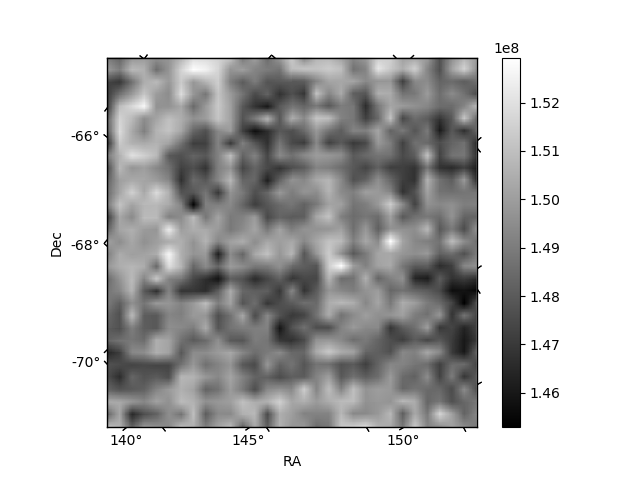
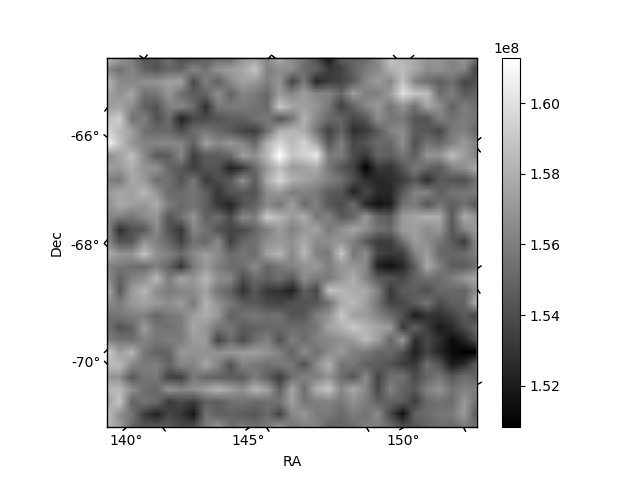
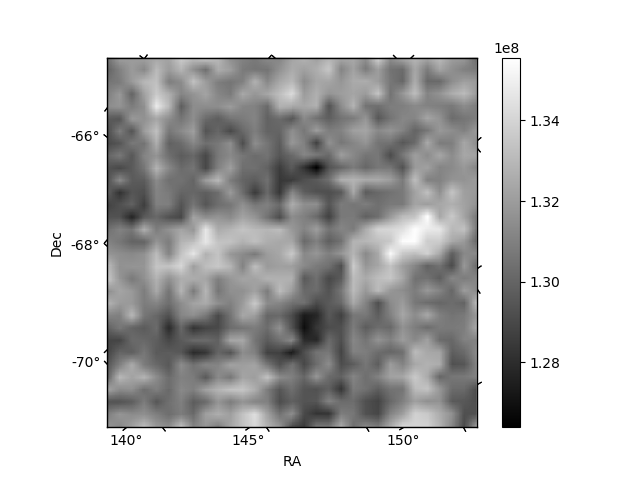
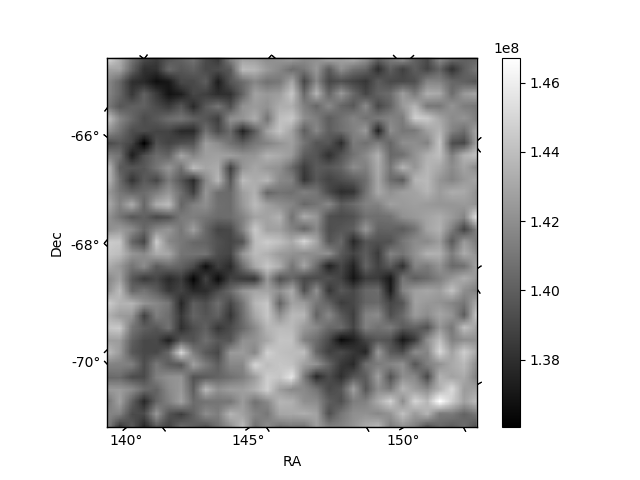
Histogram calculated using DETX and DETY for each event in the final _common_clean file
| Quadrant A |  |
 |
Quadrant B |
|---|---|---|---|
| Quadrant D | 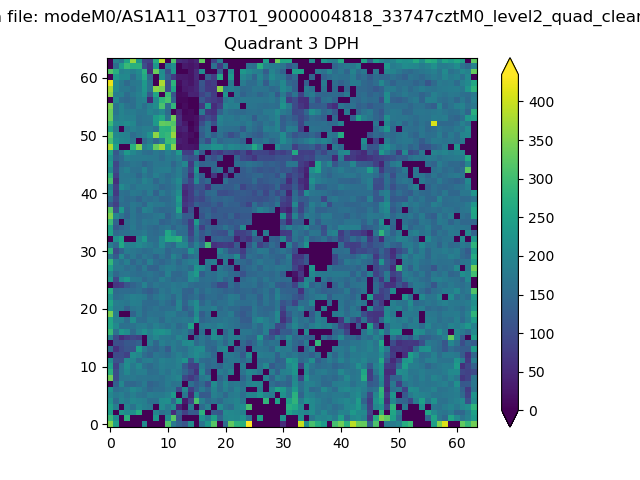 |
 |
Quadrant C |
| Plot type | Count rate plots | Images |
|---|---|---|
| Comparison with Poisson distribution Blue bars denote a histogram of data divided into 1 sec bins. Red curve is a Poisson curve with rate = median count rate of data. |
 |
 |
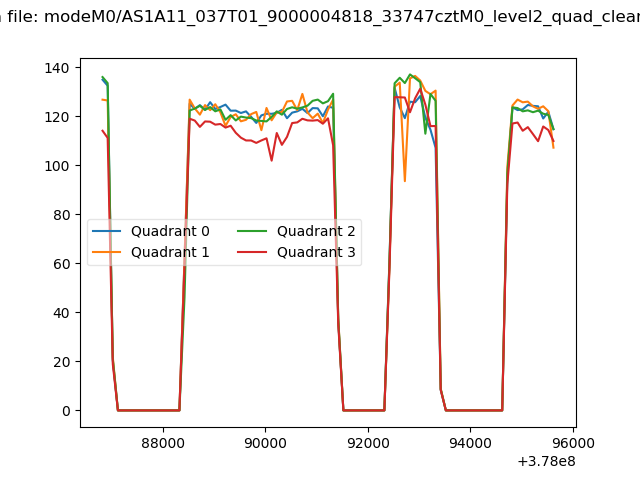
| Quadrant-wise count rates Data is divided into 100 sec bins |
 |
|
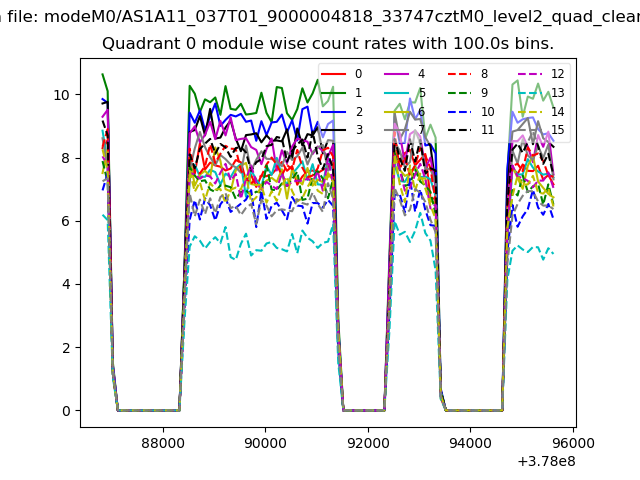
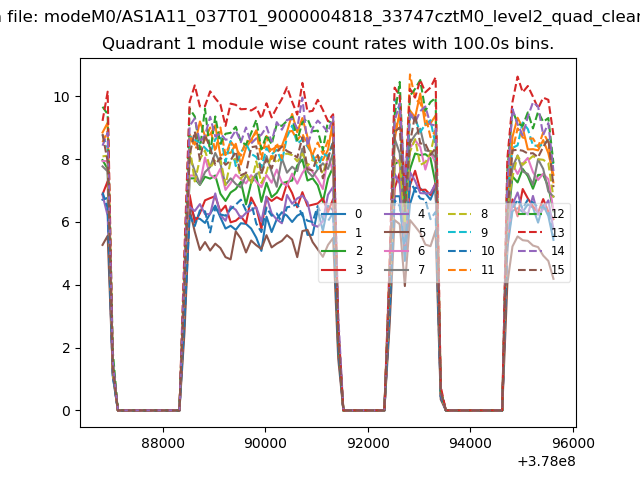
| Module-wise count rates for Quadrant A Data is divided into 100 sec bins |
 |
 |
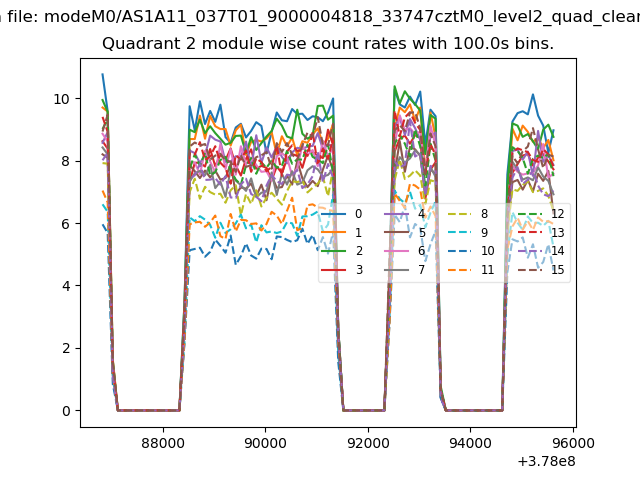
| Module-wise count rates for Quadrant B Data is divided into 100 sec bins |
 |
 |
| Module-wise count rates for Quadrant C Data is divided into 100 sec bins |
 |
 |
| Module-wise count rates for Quadrant D Data is divided into 100 sec bins |
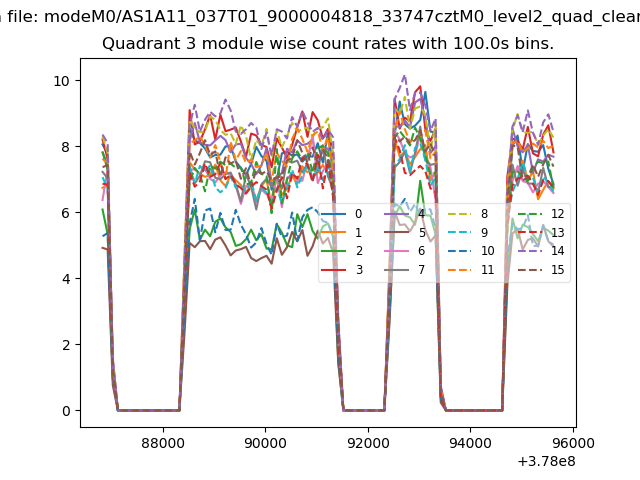 |
 |
| Parameter | Plot |
|---|---|
| CZT HV Monitor | 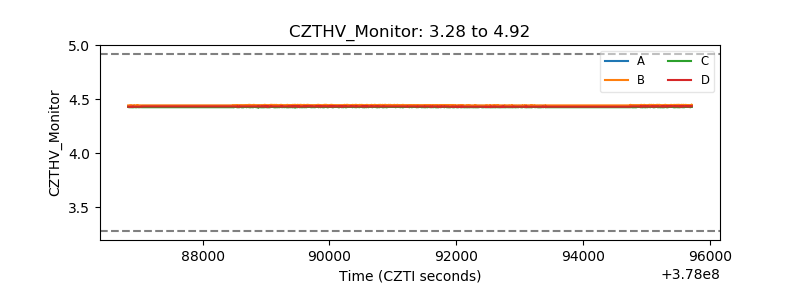 |
| D_VDD | 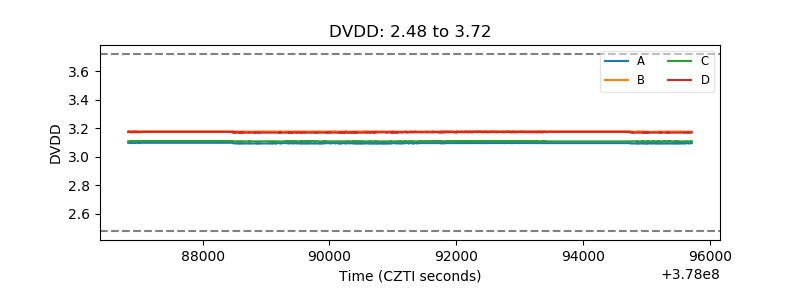 |
| Temperature 1 | 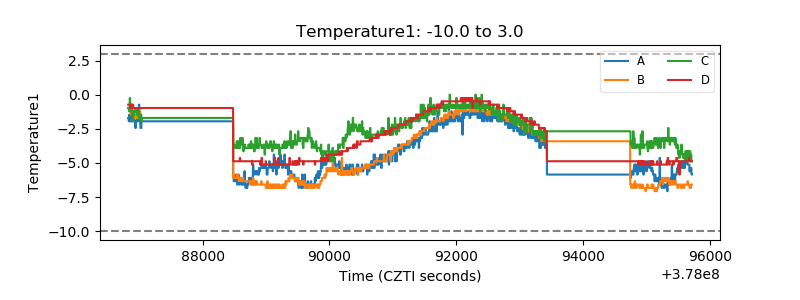 |
| Veto HV Monitor | 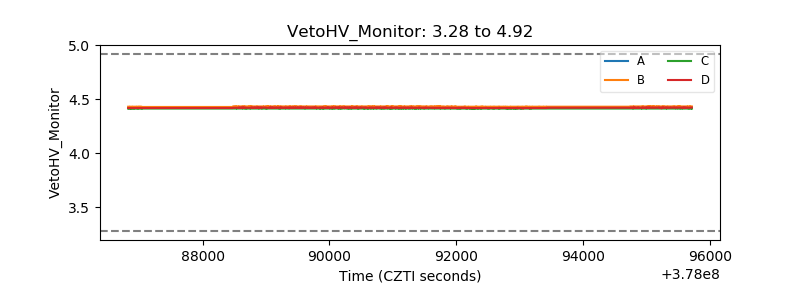 |
| Veto LLD | 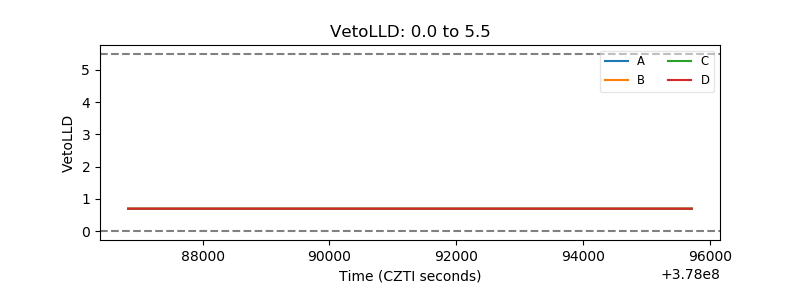 |
| Alpha Counter | 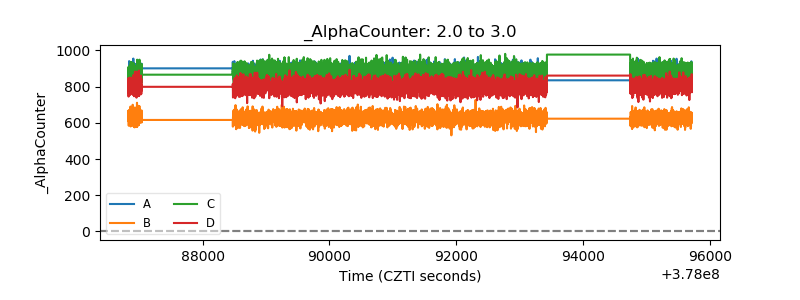 |
| _CPM_Rate | 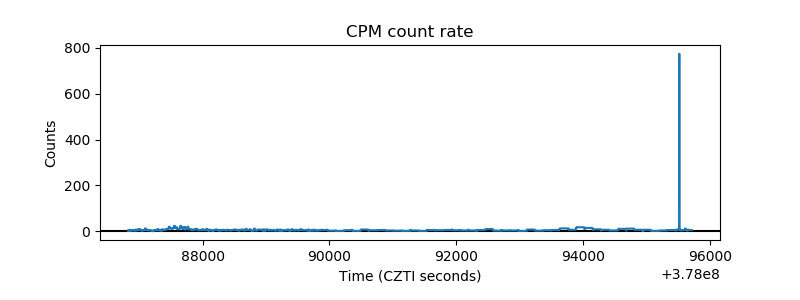 |
| CZT Counter | 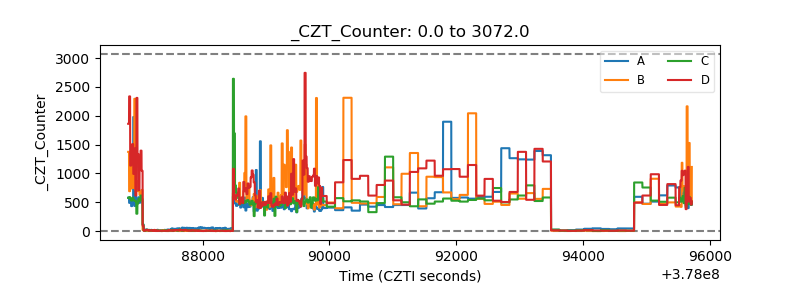 |
| +2.5 Volts monitor |  |
| +5 Volts monitor |  |
| _ROLL_ROT | 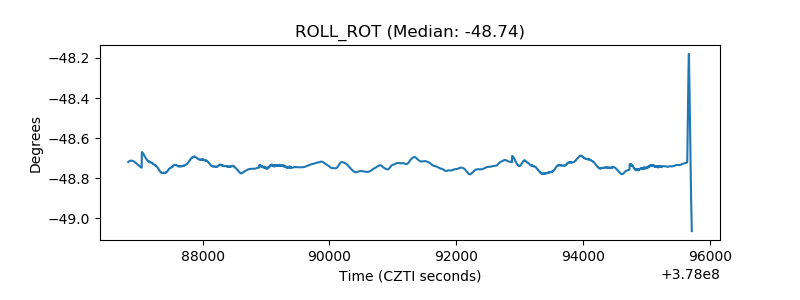 |
| _Roll_DEC | 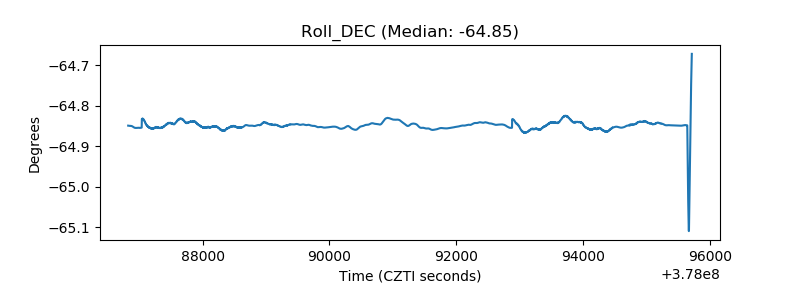 |
| _Roll_RA | 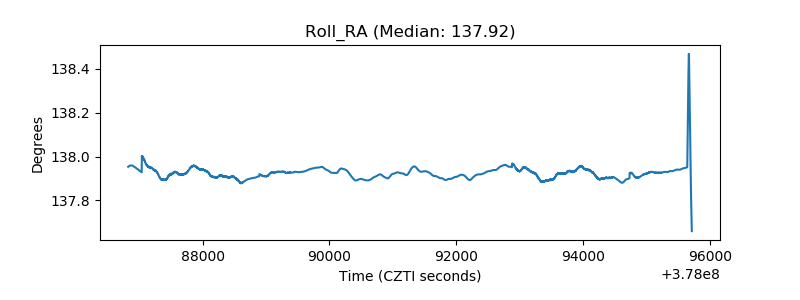 |
| Veto Counter | 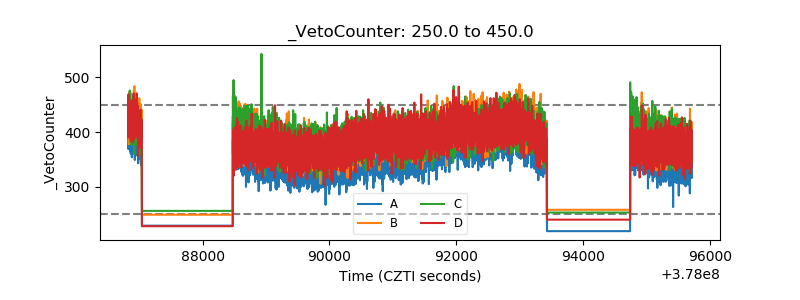 |