| Param | Original file | Final file |
|---|---|---|
| Filename | modeM0/AS1A11_037T01_9000004818_33750cztM0_level2.evt | modeM0/AS1A11_037T01_9000004818_33750cztM0_level2_quad_clean.evt |
| Size (bytes) | 1,355,503,680 | 207,976,320 |
| Size | 1.3 GB | 198.3 MB |
| Events in quadrant A | 8,468,781 | 1,348,785 |
| Events in quadrant B | 9,881,601 | 1,353,938 |
| Events in quadrant C | 8,259,565 | 1,355,841 |
| Events in quadrant D | 13,489,368 | 1,263,164 |
| Mode M9 | |||
|---|---|---|---|
| Quadrant | BADHDUFLAG | Total packets | Discarded packets |
| A | 0 | 30 | 0 |
| B | 0 | 30 | 0 |
| C | 0 | 30 | 0 |
| D | 0 | 31 | 0 |
| Mode M0 | |||
|---|---|---|---|
| Quadrant | BADHDUFLAG | Total packets | Discarded packets |
| A | 0 | 34215 | 3 |
| B | 0 | 38546 | 3 |
| C | 0 | 32532 | 3 |
| D | 0 | 49813 | 3 |
| Mode SS | |||
|---|---|---|---|
| Quadrant | BADHDUFLAG | Total packets | Discarded packets |
| A | 0 | 286 | 0 |
| B | 0 | 286 | 0 |
| C | 0 | 286 | 0 |
| D | 0 | 286 | 0 |
| Quadrant | Total seconds | Saturated seconds | Saturation percentage |
|---|---|---|---|
| A | 14155 | 318 | 2.246556% |
| B | 14155 | 834 | 5.891911% |
| C | 14155 | 195 | 1.377605% |
| D | 14155 | 888 | 6.273402% |
Noise dominated data is calculated using 1-second bins in cleaned event files. If a bin has >2000 counts, and if more than 50% of those come from <1% of pixels, then it is considered to be noise-dominated and hence unusable.
| Quadrant | # 1 sec bins | Bins with >0 counts | Bins with >2000 counts | High rate bins dominated by noise | Noise dominated (total time) | Noise dominated (detector-on time) | Marked lightcurve |
|---|---|---|---|---|---|---|---|
| A | 16841 | 14157 | 288 | 288 | 1.71% | 2.03% | 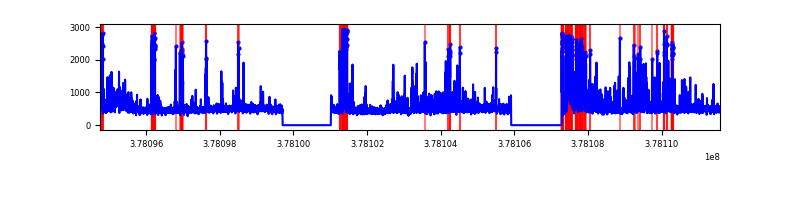 |
| B | 16841 | 14156 | 623 | 623 | 3.70% | 4.40% | 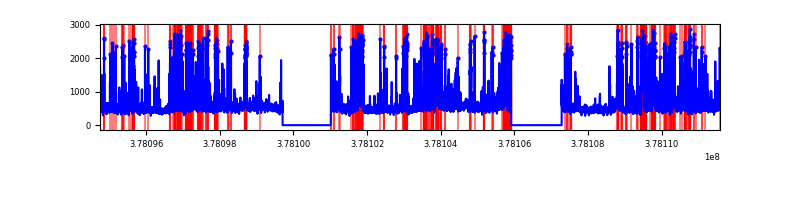 |
| C | 16841 | 14157 | 190 | 190 | 1.13% | 1.34% | 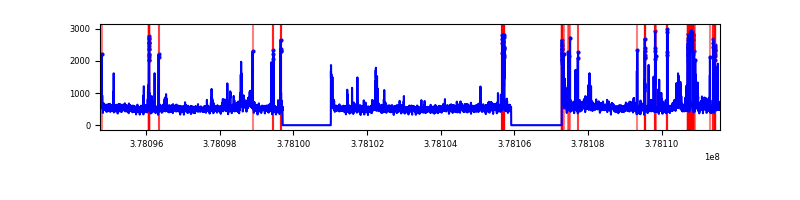 |
| D | 16841 | 14157 | 869 | 869 | 5.16% | 6.14% | 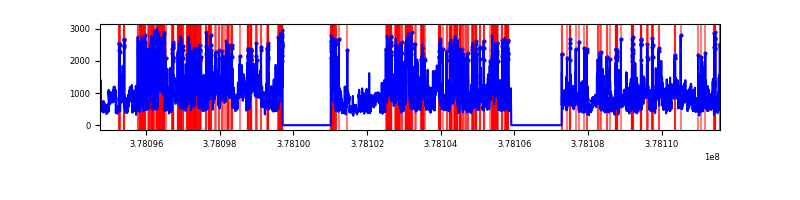 |
Top three noisy pixels from each quadrant. If the there are fewer than three noisy pixels in the level2.evt file, extra rows are filled as -1
| Pixel properties | Quadrant properties | ||||||
|---|---|---|---|---|---|---|---|
| Quadrant | DetID | PixID | Counts | Sigma | Mean | Median | Sigma |
| A | 14 | 4 | 1696630 | 5306.49 | 1620 | 1589 | 319.4 |
| A | 15 | 169 | 297377 | 925.99 | 1620 | 1589 | 319.4 |
| A | 15 | 237 | 151275 | 468.61 | 1620 | 1589 | 319.4 |
| B | 5 | 172 | 2720520 | 9048.78 | 1592 | 1551 | 300.5 |
| B | 0 | 189 | 284765 | 942.54 | 1592 | 1551 | 300.5 |
| B | 5 | 255 | 186973 | 617.09 | 1592 | 1551 | 300.5 |
| C | 9 | 187 | 624786 | 1708.21 | 1585 | 1598 | 364.8 |
| C | 15 | 214 | 612734 | 1675.18 | 1585 | 1598 | 364.8 |
| C | 3 | 233 | 424699 | 1159.76 | 1585 | 1598 | 364.8 |
| D | 8 | 195 | 3638766 | 8951.96 | 1550 | 1513 | 406.3 |
| D | 2 | 250 | 1242341 | 3053.91 | 1550 | 1513 | 406.3 |
| D | 12 | 233 | 938349 | 2305.73 | 1550 | 1513 | 406.3 |
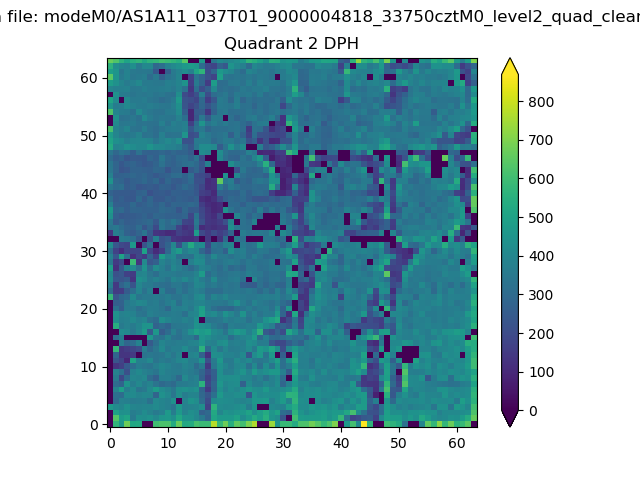
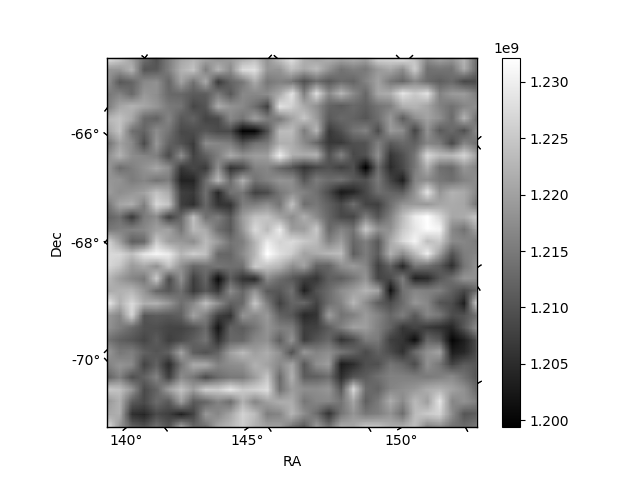
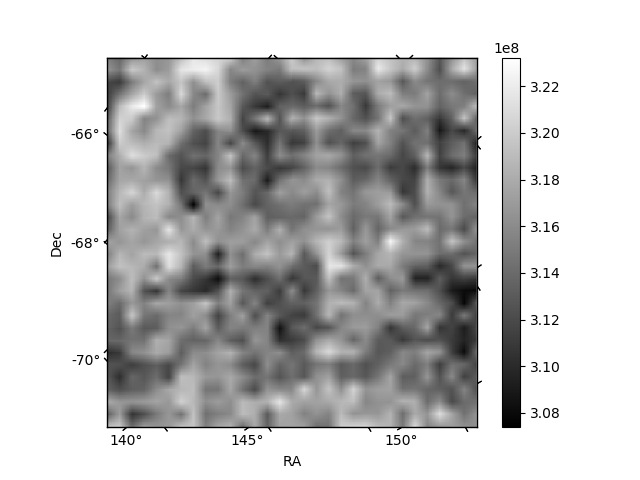
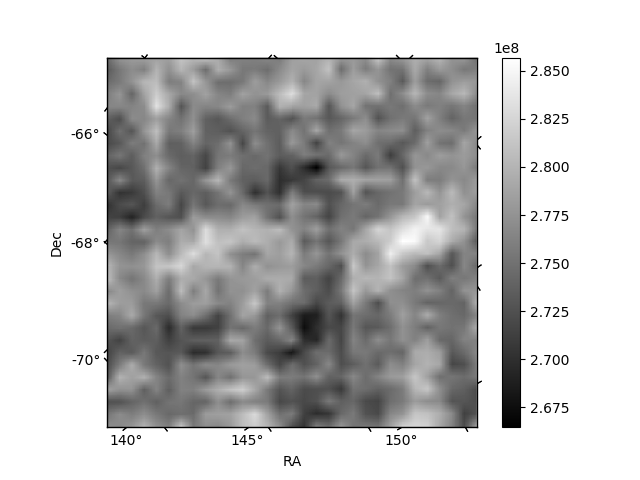
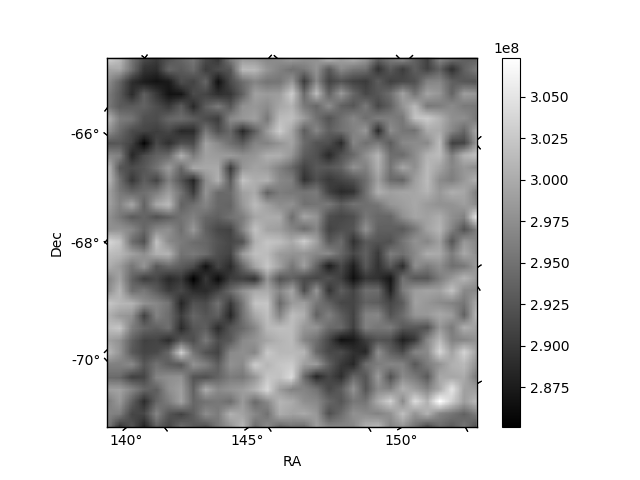
Histogram calculated using DETX and DETY for each event in the final _common_clean file
| Quadrant A | 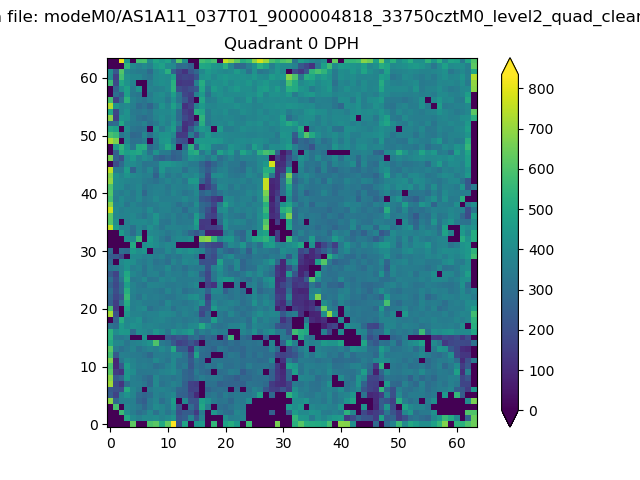 |
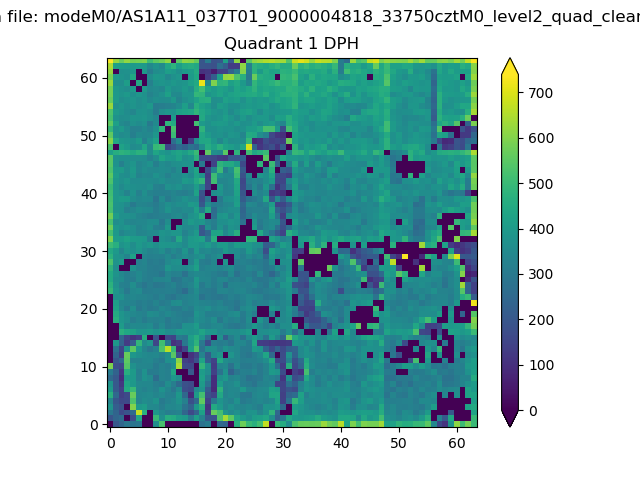 |
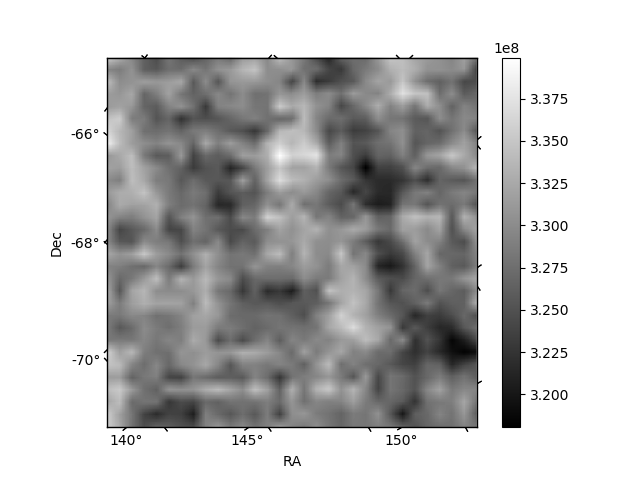
Quadrant B |
|---|---|---|---|
| Quadrant D | 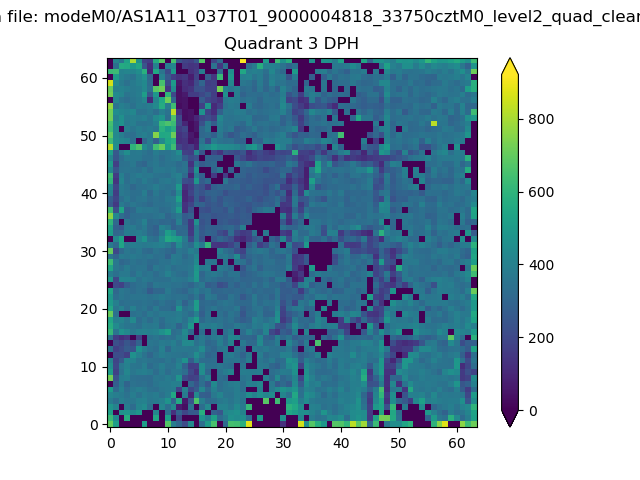 |
 |
Quadrant C |
| Plot type | Count rate plots | Images |
|---|---|---|
| Comparison with Poisson distribution Blue bars denote a histogram of data divided into 1 sec bins. Red curve is a Poisson curve with rate = median count rate of data. |
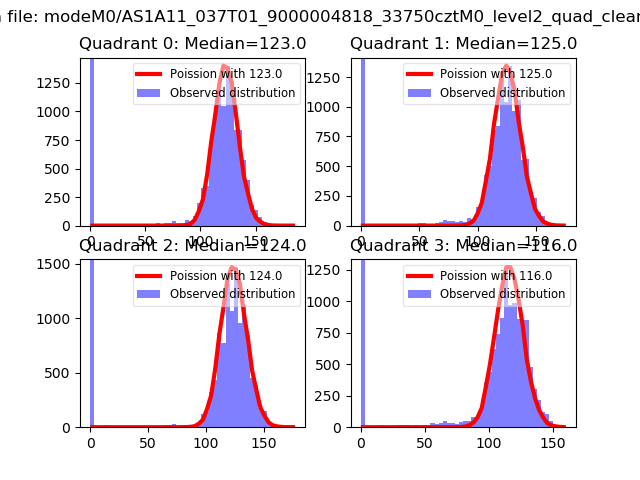 |
 |
| Quadrant-wise count rates Data is divided into 100 sec bins |
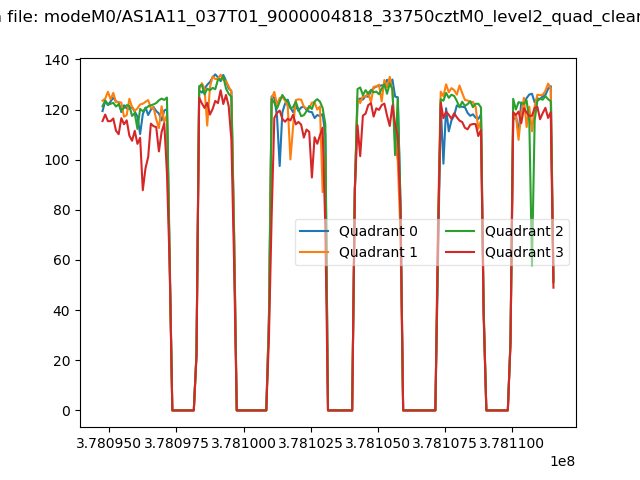 |
|
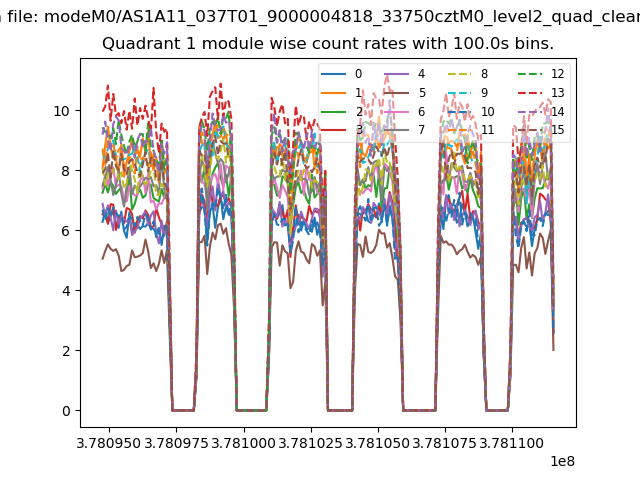
| Module-wise count rates for Quadrant A Data is divided into 100 sec bins |
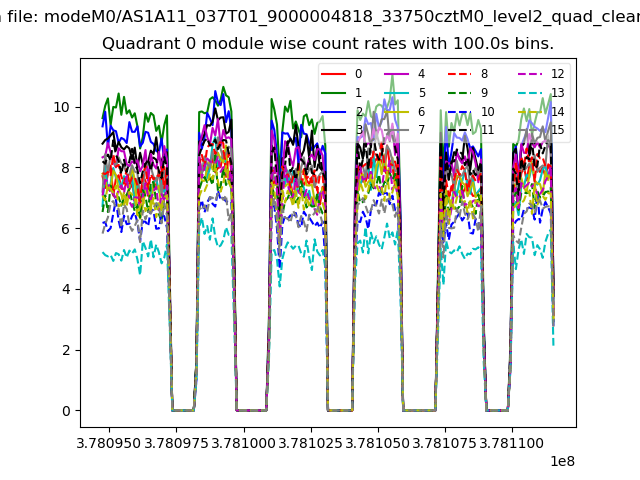 |
 |
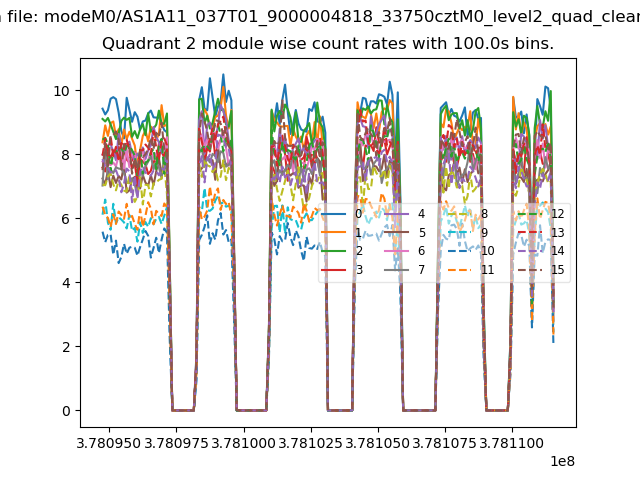
| Module-wise count rates for Quadrant B Data is divided into 100 sec bins |
 |
 |
| Module-wise count rates for Quadrant C Data is divided into 100 sec bins |
 |
 |
| Module-wise count rates for Quadrant D Data is divided into 100 sec bins |
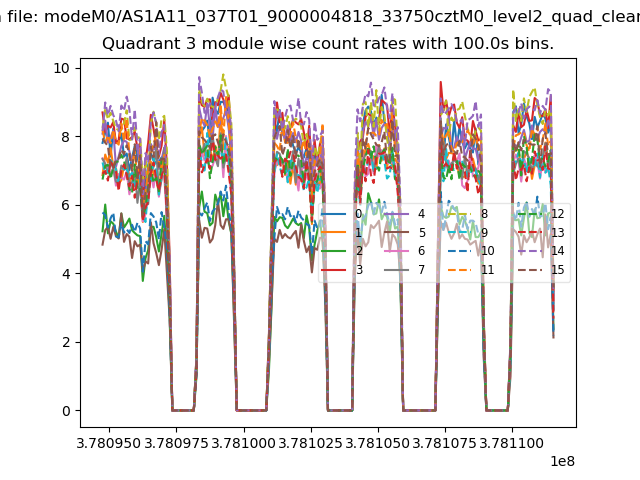 |
 |
| Parameter | Plot |
|---|---|
| CZT HV Monitor | 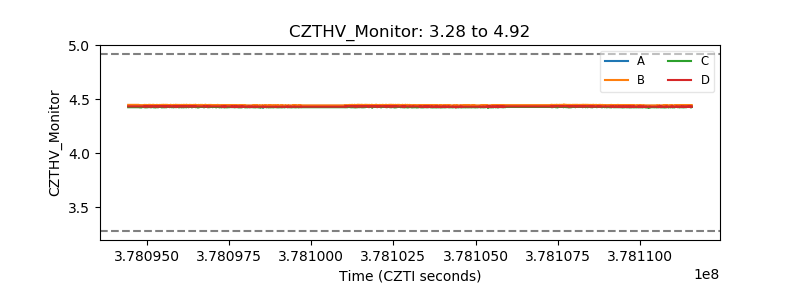 |
| D_VDD | 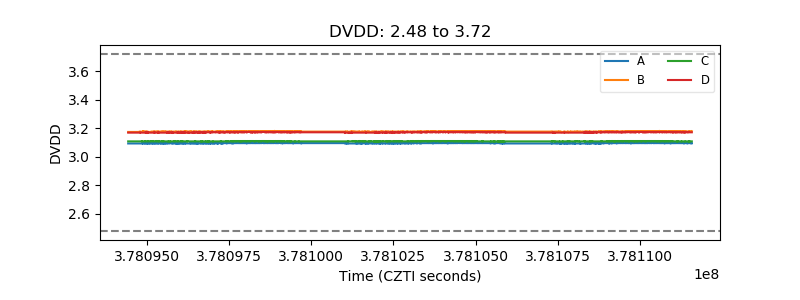 |
| Temperature 1 | 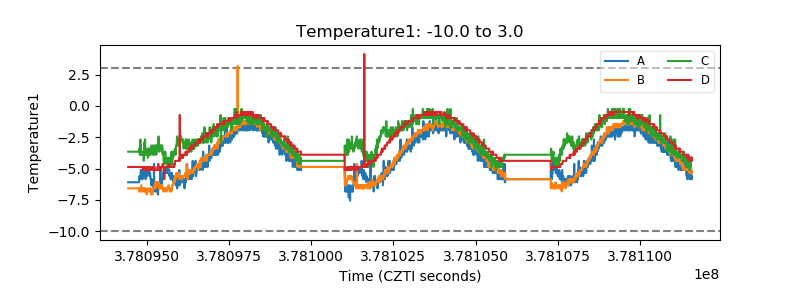 |
| Veto HV Monitor | 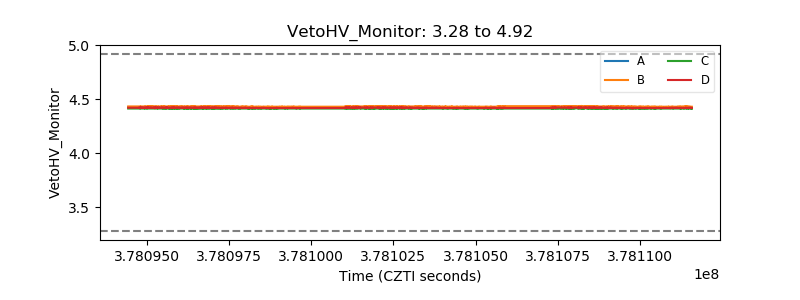 |
| Veto LLD | 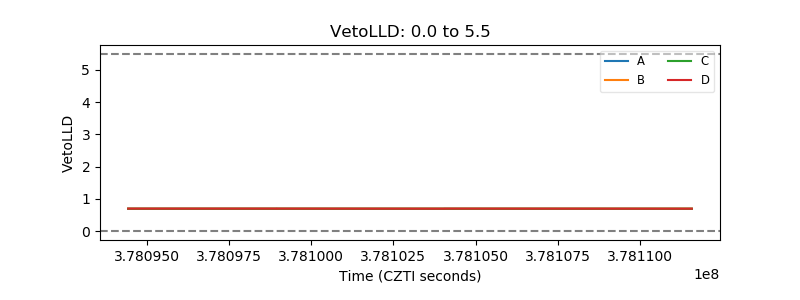 |
| Alpha Counter | 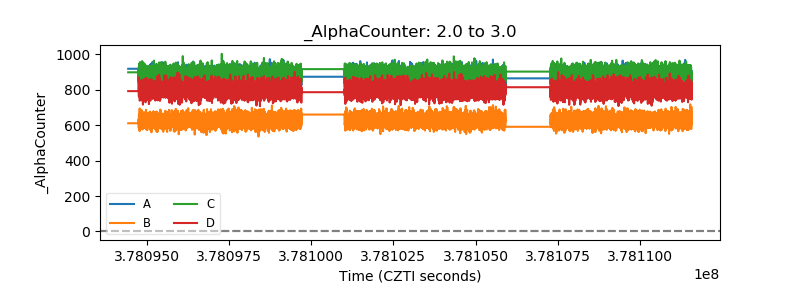 |
| _CPM_Rate | 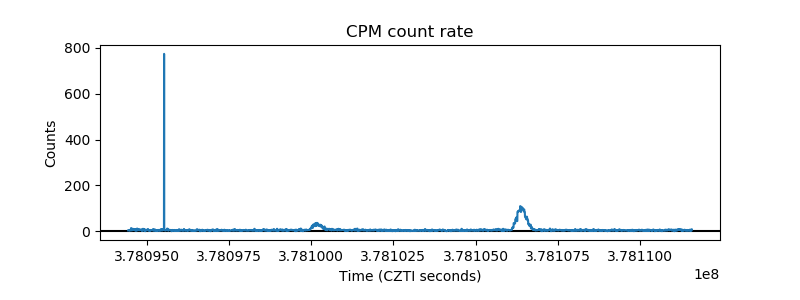 |
| CZT Counter | 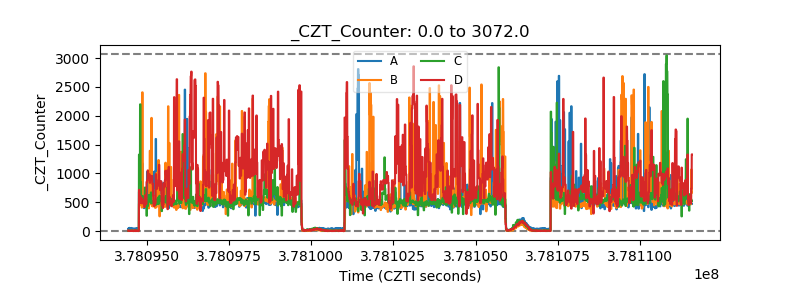 |
| +2.5 Volts monitor |  |
| +5 Volts monitor |  |
| _ROLL_ROT | 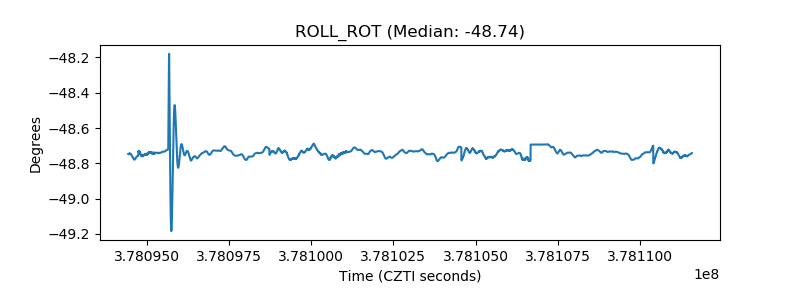 |
| _Roll_DEC | 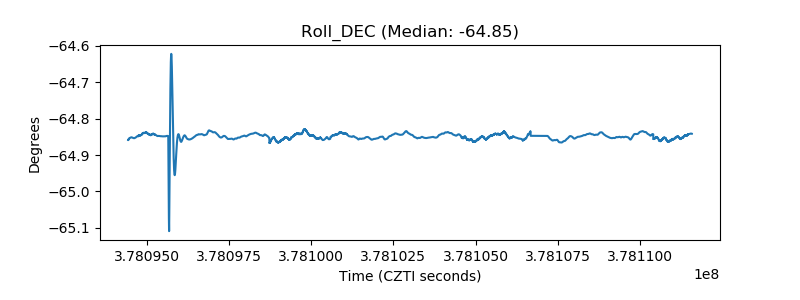 |
| _Roll_RA | 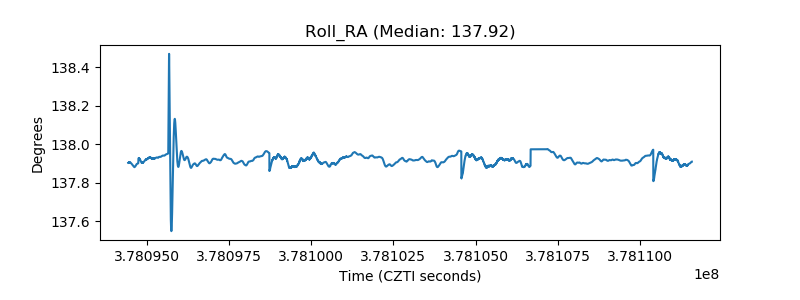 |
| Veto Counter | 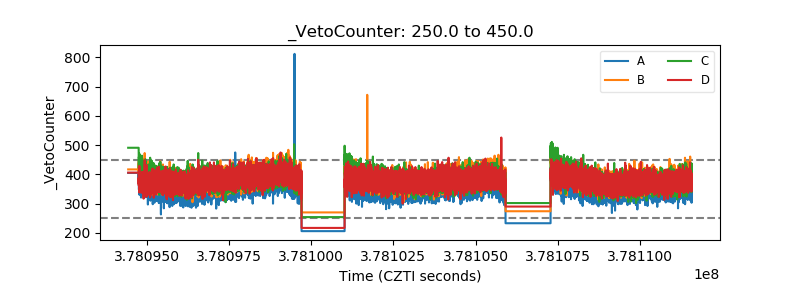 |