| Param | Original file | Final file |
|---|---|---|
| Filename | modeM0/AS1A11_086T01_9000004820_33750cztM0_level2.evt | modeM0/AS1A11_086T01_9000004820_33750cztM0_level2_quad_clean.evt |
| Size (bytes) | 87,376,320 | 15,364,800 |
| Size | 83.3 MB | 14.7 MB |
| Events in quadrant A | 902,421 | 94,107 |
| Events in quadrant B | 509,340 | 102,342 |
| Events in quadrant C | 506,075 | 102,159 |
| Events in quadrant D | 664,085 | 95,741 |
| Mode M9 | |||
|---|---|---|---|
| Quadrant | BADHDUFLAG | Total packets | Discarded packets |
| A | 0 | 9 | 0 |
| B | 0 | 9 | 0 |
| C | 0 | 9 | 0 |
| D | 0 | 9 | 0 |
| Mode SS | |||
|---|---|---|---|
| Quadrant | BADHDUFLAG | Total packets | Discarded packets |
| A | 0 | 18 | 0 |
| B | 0 | 18 | 0 |
| C | 0 | 18 | 0 |
| D | 0 | 18 | 0 |
| Mode M0 | |||
|---|---|---|---|
| Quadrant | BADHDUFLAG | Total packets | Discarded packets |
| A | 0 | 3300 | 2 |
| B | 0 | 2061 | 1 |
| C | 0 | 2003 | 1 |
| D | 0 | 2546 | 1 |
| Quadrant | Total seconds | Saturated seconds | Saturation percentage |
|---|---|---|---|
| A | 902 | 101 | 11.197339% |
| B | 902 | 10 | 1.108647% |
| C | 902 | 11 | 1.219512% |
| D | 902 | 13 | 1.441242% |
Noise dominated data is calculated using 1-second bins in cleaned event files. If a bin has >2000 counts, and if more than 50% of those come from <1% of pixels, then it is considered to be noise-dominated and hence unusable.
| Quadrant | # 1 sec bins | Bins with >0 counts | Bins with >2000 counts | High rate bins dominated by noise | Noise dominated (total time) | Noise dominated (detector-on time) | Marked lightcurve |
|---|---|---|---|---|---|---|---|
| A | 902 | 902 | 100 | 100 | 11.09% | 11.09% | 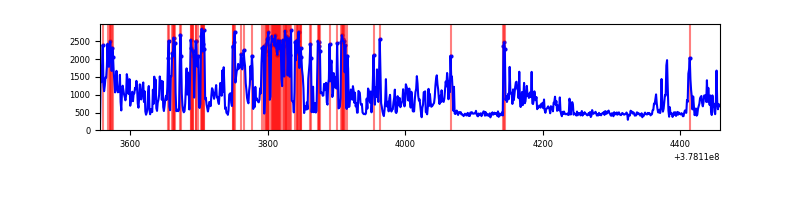 |
| B | 902 | 902 | 6 | 6 | 0.67% | 0.67% | 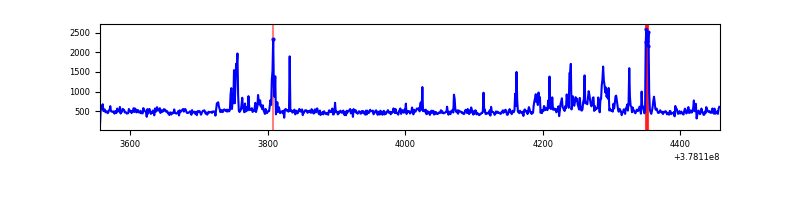 |
| C | 902 | 902 | 11 | 11 | 1.22% | 1.22% | 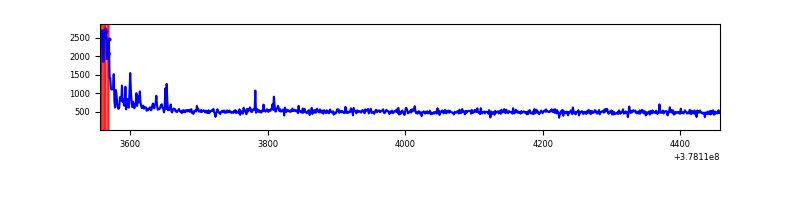 |
| D | 902 | 902 | 12 | 12 | 1.33% | 1.33% | 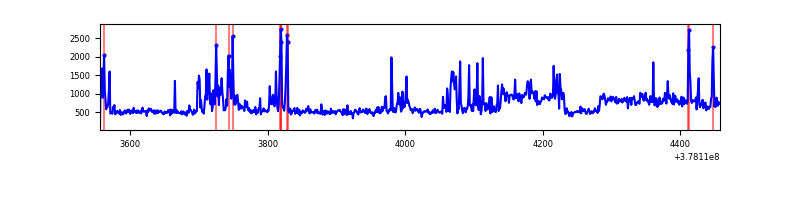 |
Top three noisy pixels from each quadrant. If the there are fewer than three noisy pixels in the level2.evt file, extra rows are filled as -1
| Pixel properties | Quadrant properties | ||||||
|---|---|---|---|---|---|---|---|
| Quadrant | DetID | PixID | Counts | Sigma | Mean | Median | Sigma |
| A | 14 | 4 | 488517 | 21409.84 | 104 | 102 | 22.8 |
| A | 10 | 83 | 3928 | 167.71 | 104 | 102 | 22.8 |
| A | 13 | 6 | 3727 | 158.9 | 104 | 102 | 22.8 |
| B | 5 | 172 | 37531 | 1667.49 | 106 | 103 | 22.4 |
| B | 15 | 222 | 23555 | 1044.83 | 106 | 103 | 22.4 |
| B | 5 | 255 | 14406 | 637.23 | 106 | 103 | 22.4 |
| C | 0 | 10 | 44458 | 1736.02 | 102 | 103 | 25.5 |
| C | 15 | 214 | 43207 | 1687.06 | 102 | 103 | 25.5 |
| C | 3 | 233 | 12774 | 495.93 | 102 | 103 | 25.5 |
| D | 8 | 195 | 112256 | 4200.46 | 103 | 100 | 26.7 |
| D | 1 | 47 | 64932 | 2428.09 | 103 | 100 | 26.7 |
| D | 2 | 249 | 30452 | 1136.74 | 103 | 100 | 26.7 |
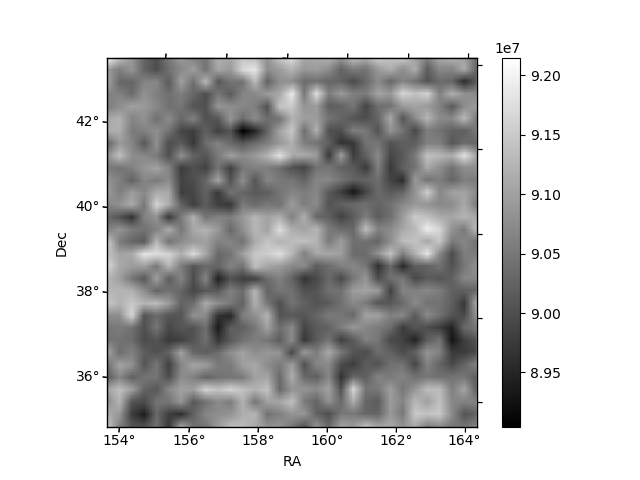
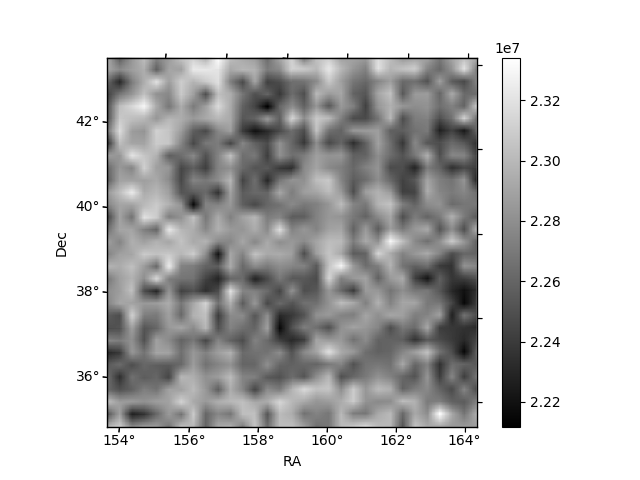
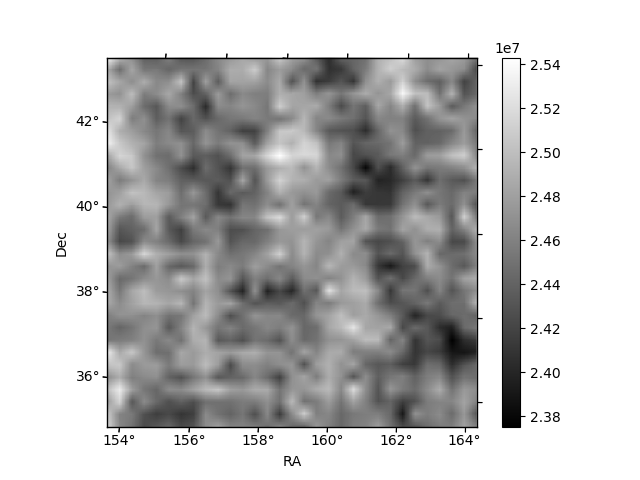
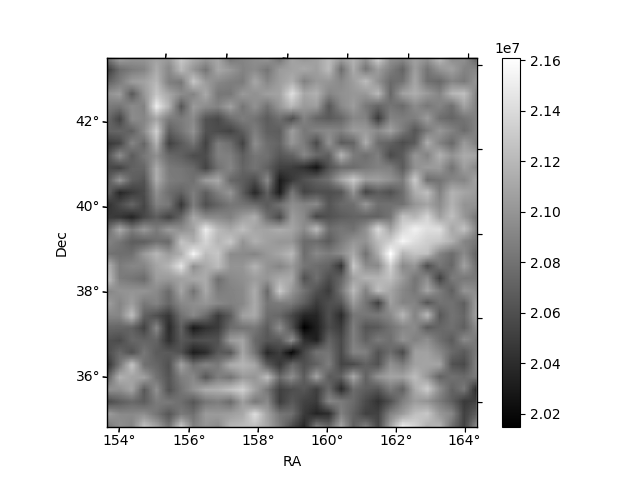
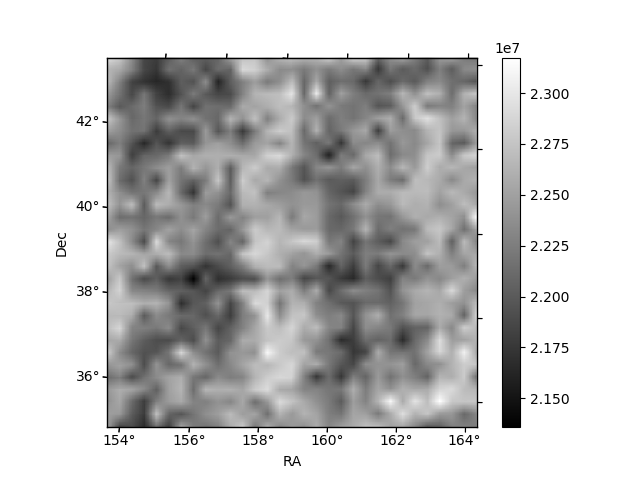
Histogram calculated using DETX and DETY for each event in the final _common_clean file
| Quadrant A | 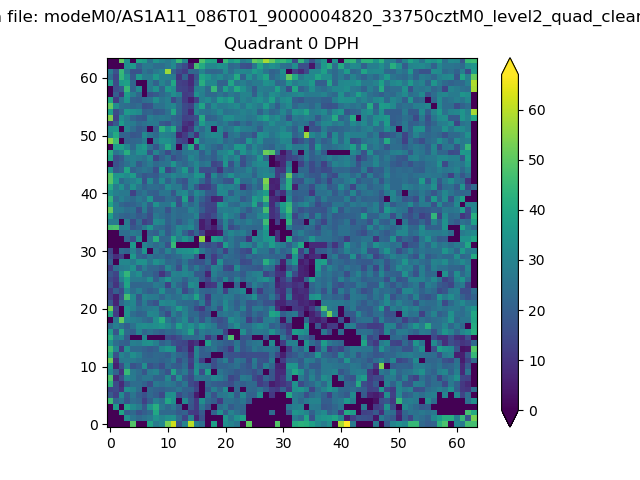 |
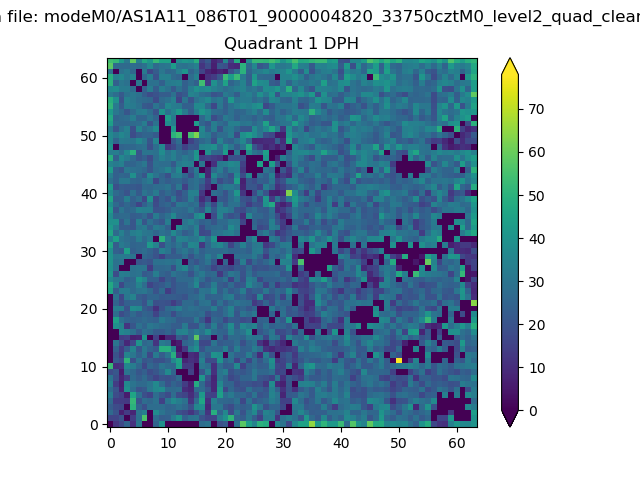 |
Quadrant B |
|---|---|---|---|
| Quadrant D | 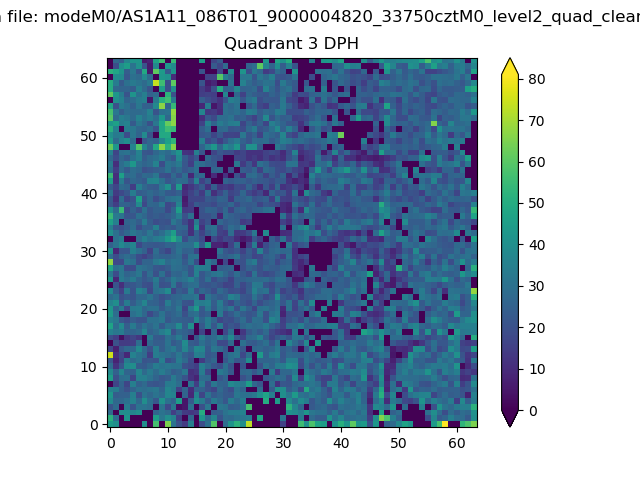 |
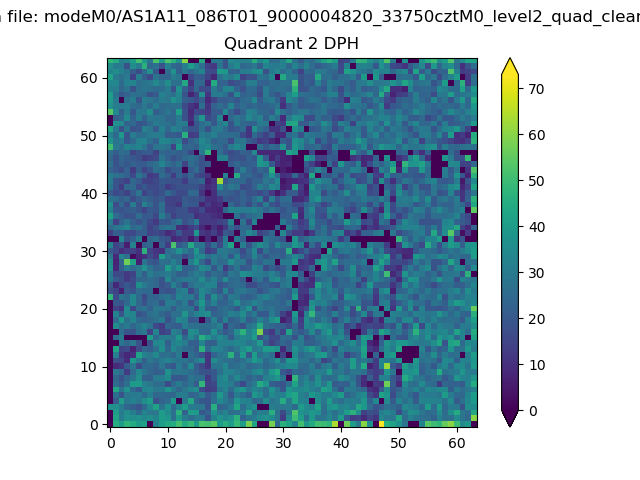 |
Quadrant C |
| Plot type | Count rate plots | Images |
|---|---|---|
| Comparison with Poisson distribution Blue bars denote a histogram of data divided into 1 sec bins. Red curve is a Poisson curve with rate = median count rate of data. |
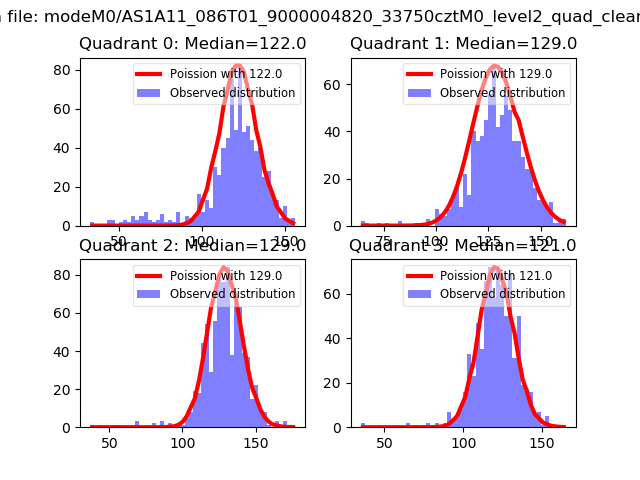 |
 |
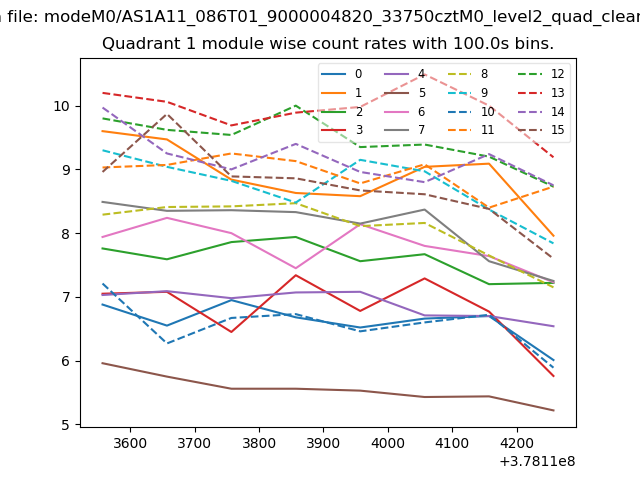
| Quadrant-wise count rates Data is divided into 100 sec bins |
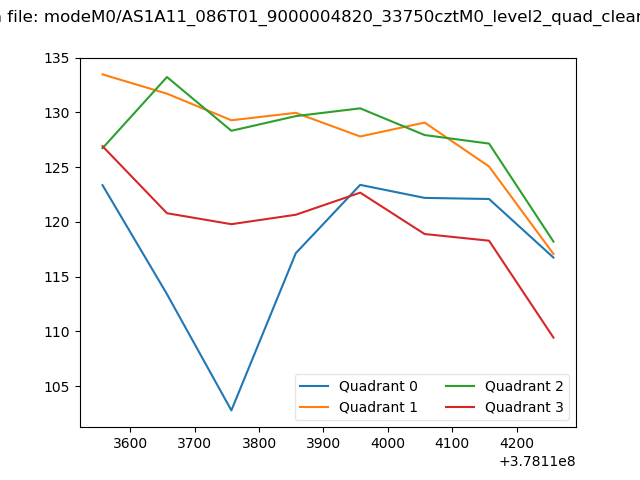 |
|
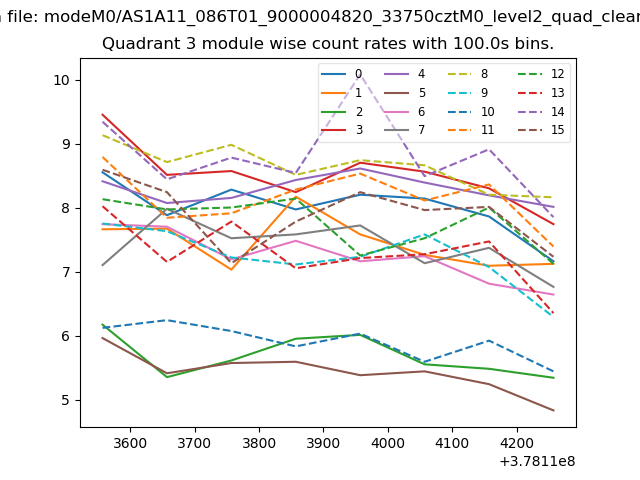
| Module-wise count rates for Quadrant A Data is divided into 100 sec bins |
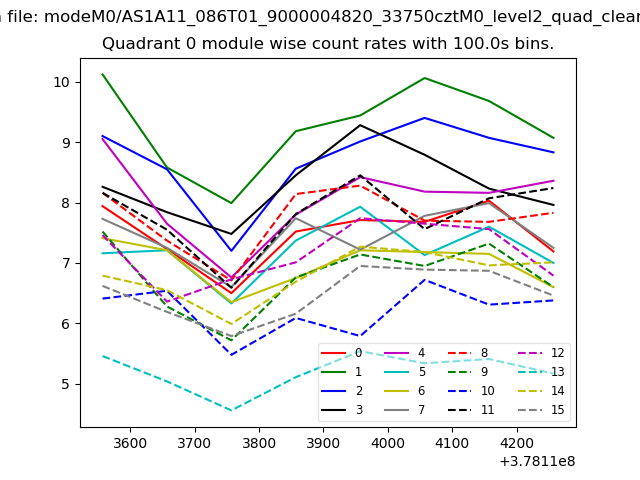 |
 |
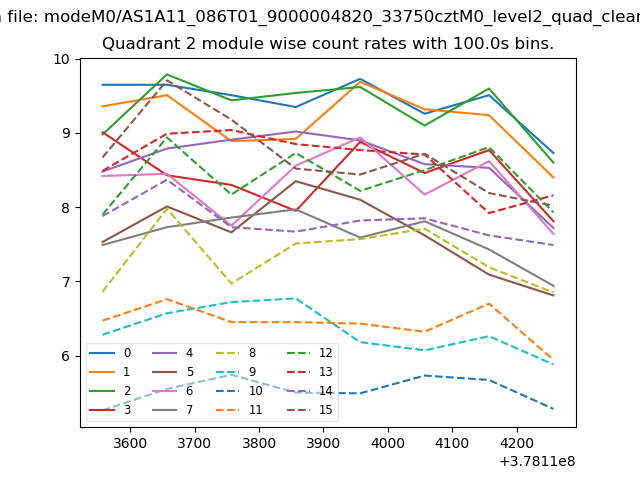
| Module-wise count rates for Quadrant B Data is divided into 100 sec bins |
 |
 |
| Module-wise count rates for Quadrant C Data is divided into 100 sec bins |
 |
 |
| Module-wise count rates for Quadrant D Data is divided into 100 sec bins |
 |
 |
| Parameter | Plot |
|---|---|
| CZT HV Monitor | 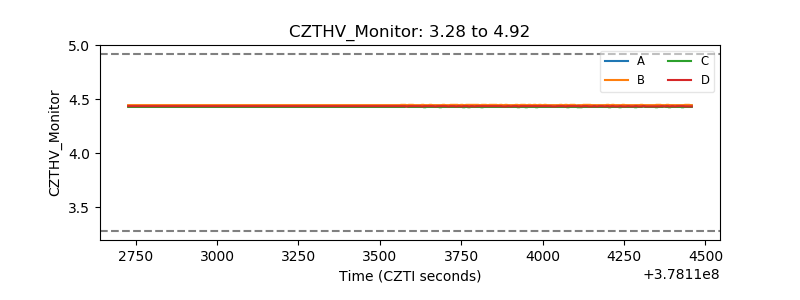 |
| D_VDD | 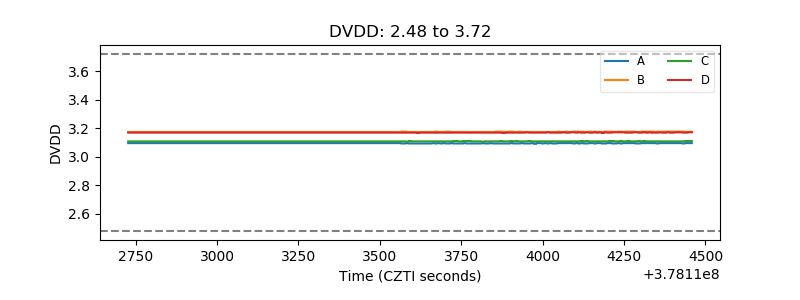 |
| Temperature 1 | 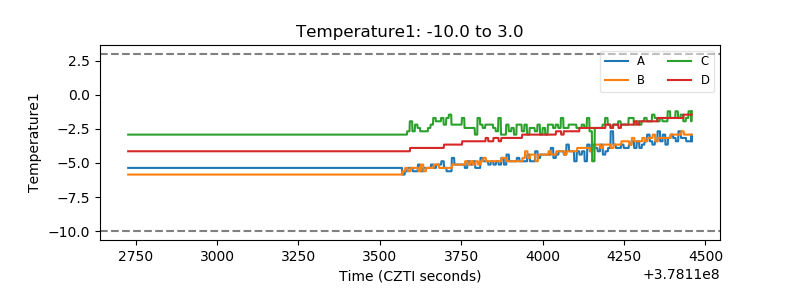 |
| Veto HV Monitor | 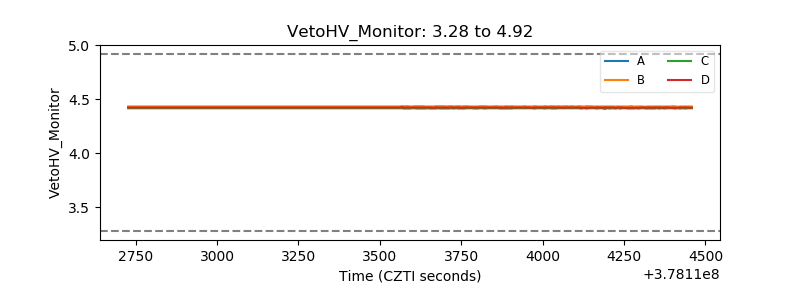 |
| Veto LLD | 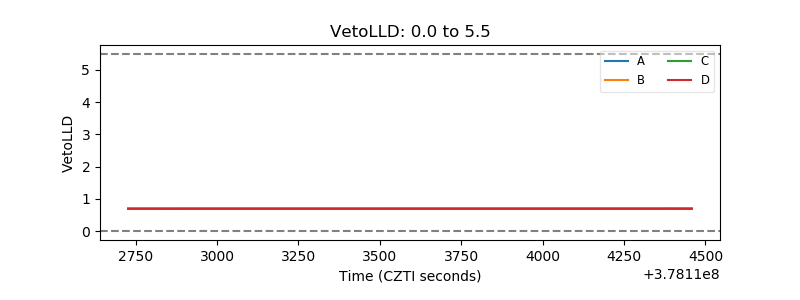 |
| Alpha Counter | 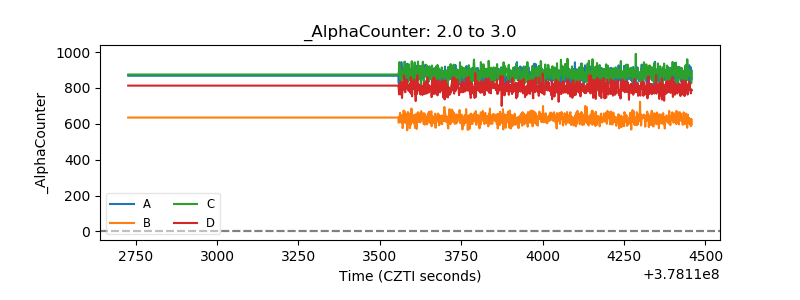 |
| _CPM_Rate | 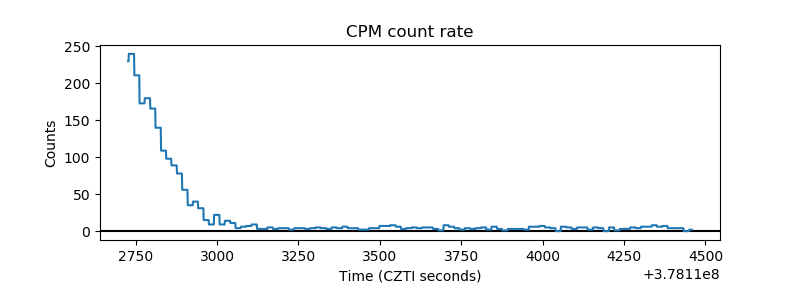 |
| CZT Counter | 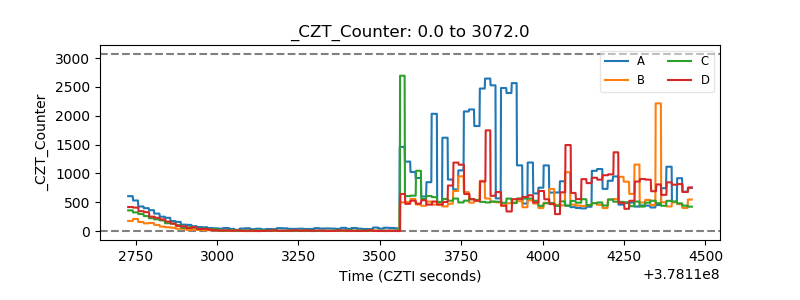 |
| +2.5 Volts monitor | 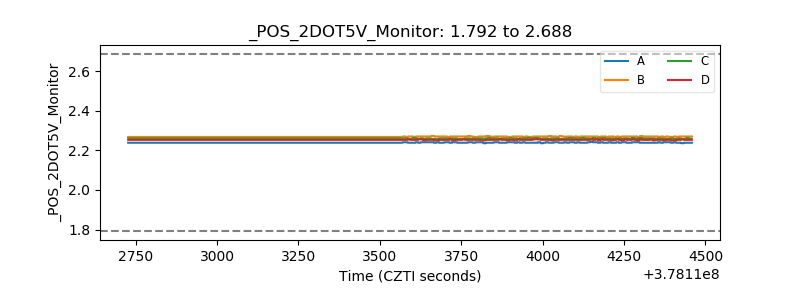 |
| +5 Volts monitor |  |
| _ROLL_ROT | 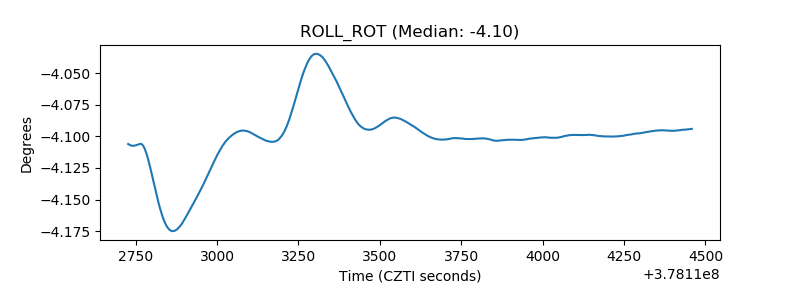 |
| _Roll_DEC | 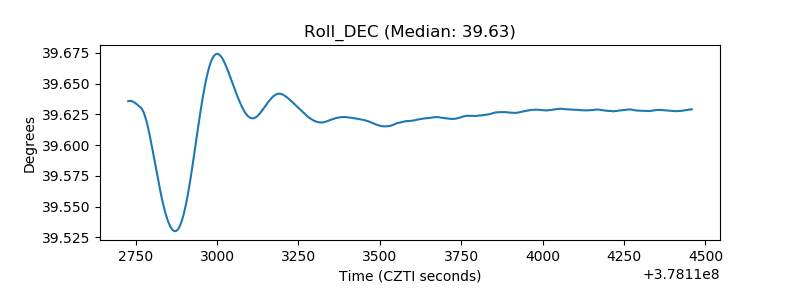 |
| _Roll_RA | 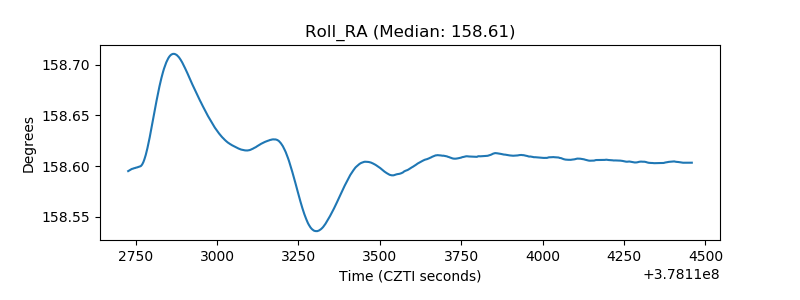 |
| Veto Counter | 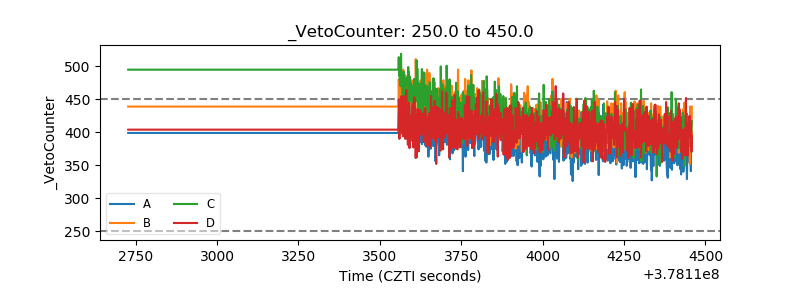 |