| Param | Original file | Final file |
|---|---|---|
| Filename | modeM0/AS1A11_086T01_9000004820_33751cztM0_level2.evt | modeM0/AS1A11_086T01_9000004820_33751cztM0_level2_quad_clean.evt |
| Size (bytes) | 535,680,000 | 61,672,320 |
| Size | 510.9 MB | 58.8 MB |
| Events in quadrant A | 3,815,203 | 373,203 |
| Events in quadrant B | 4,015,850 | 379,654 |
| Events in quadrant C | 3,462,816 | 380,844 |
| Events in quadrant D | 4,561,520 | 353,043 |
| Mode M9 | |||
|---|---|---|---|
| Quadrant | BADHDUFLAG | Total packets | Discarded packets |
| A | 0 | 18 | 0 |
| B | 0 | 18 | 0 |
| C | 0 | 18 | 0 |
| D | 0 | 19 | 0 |
| Mode SS | |||
|---|---|---|---|
| Quadrant | BADHDUFLAG | Total packets | Discarded packets |
| A | 0 | 108 | 0 |
| B | 0 | 108 | 0 |
| C | 0 | 108 | 0 |
| D | 0 | 108 | 0 |
| Mode M0 | |||
|---|---|---|---|
| Quadrant | BADHDUFLAG | Total packets | Discarded packets |
| A | 0 | 14749 | 2 |
| B | 0 | 15333 | 1 |
| C | 0 | 13317 | 1 |
| D | 0 | 17090 | 1 |
| Quadrant | Total seconds | Saturated seconds | Saturation percentage |
|---|---|---|---|
| A | 5442 | 242 | 4.446895% |
| B | 5442 | 359 | 6.596839% |
| C | 5442 | 247 | 4.538773% |
| D | 5442 | 227 | 4.171261% |
Noise dominated data is calculated using 1-second bins in cleaned event files. If a bin has >2000 counts, and if more than 50% of those come from <1% of pixels, then it is considered to be noise-dominated and hence unusable.
| Quadrant | # 1 sec bins | Bins with >0 counts | Bins with >2000 counts | High rate bins dominated by noise | Noise dominated (total time) | Noise dominated (detector-on time) | Marked lightcurve |
|---|---|---|---|---|---|---|---|
| A | 7054 | 5443 | 209 | 209 | 2.96% | 3.84% | 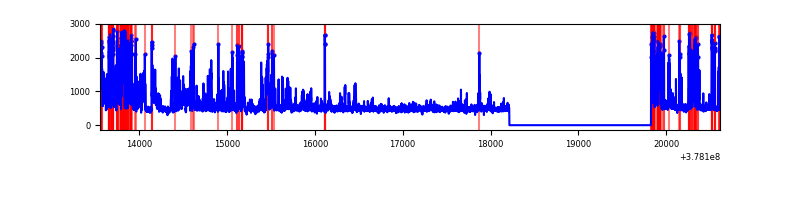 |
| B | 7054 | 5443 | 299 | 299 | 4.24% | 5.49% | 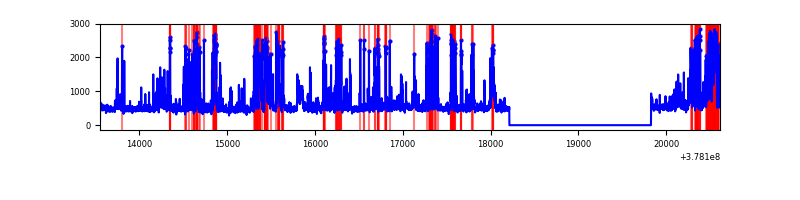 |
| C | 7054 | 5443 | 229 | 229 | 3.25% | 4.21% | 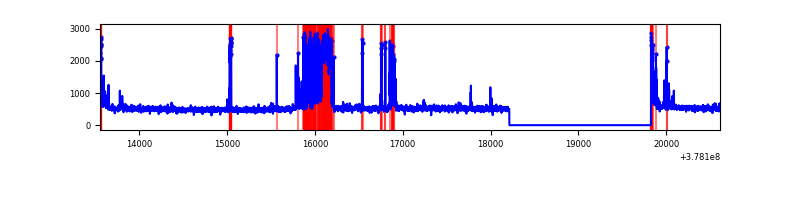 |
| D | 7054 | 5443 | 222 | 222 | 3.15% | 4.08% | 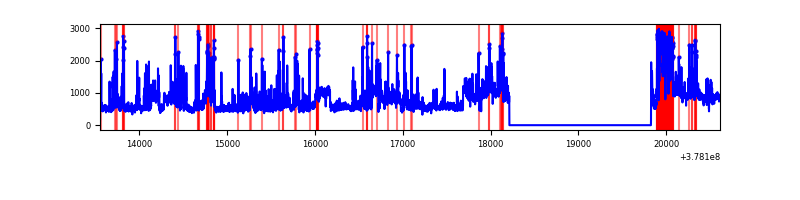 |
Top three noisy pixels from each quadrant. If the there are fewer than three noisy pixels in the level2.evt file, extra rows are filled as -1
| Pixel properties | Quadrant properties | ||||||
|---|---|---|---|---|---|---|---|
| Quadrant | DetID | PixID | Counts | Sigma | Mean | Median | Sigma |
| A | 14 | 4 | 1204008 | 9319.09 | 641 | 629 | 129.1 |
| A | 15 | 169 | 80405 | 617.79 | 641 | 629 | 129.1 |
| A | 13 | 6 | 27342 | 206.87 | 641 | 629 | 129.1 |
| B | 5 | 172 | 1209789 | 9977.94 | 628 | 611 | 121.2 |
| B | 5 | 255 | 88706 | 726.94 | 628 | 611 | 121.2 |
| B | 15 | 222 | 51674 | 421.36 | 628 | 611 | 121.2 |
| C | 9 | 187 | 628388 | 4360.18 | 619 | 623 | 144.0 |
| C | 15 | 214 | 238665 | 1653.34 | 619 | 623 | 144.0 |
| C | 0 | 10 | 96170 | 663.63 | 619 | 623 | 144.0 |
| D | 8 | 195 | 1048261 | 6298.27 | 619 | 605 | 166.3 |
| D | 1 | 47 | 508141 | 3051.19 | 619 | 605 | 166.3 |
| D | 2 | 249 | 116773 | 698.38 | 619 | 605 | 166.3 |
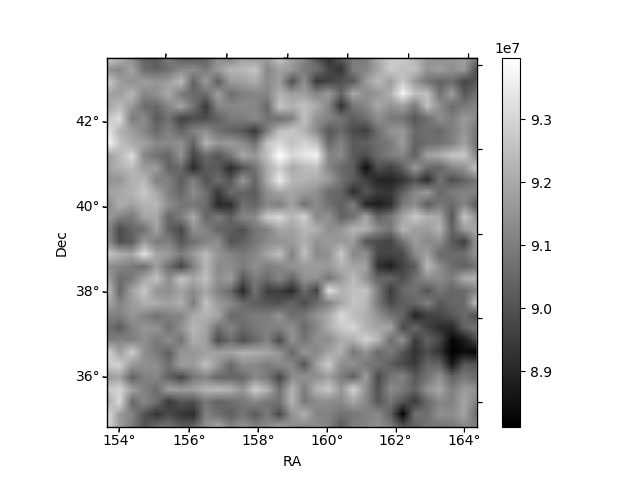
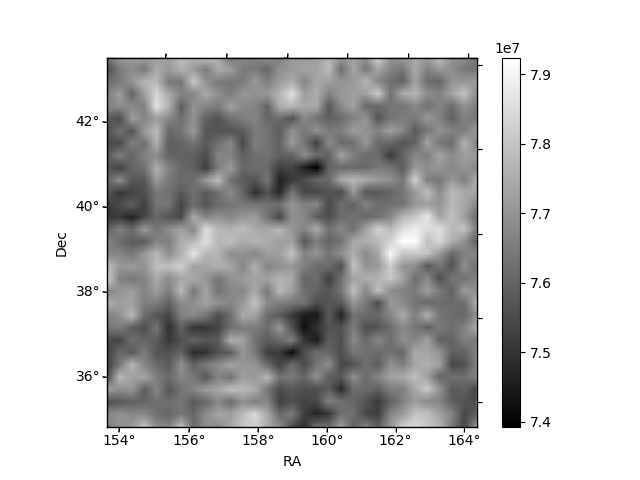
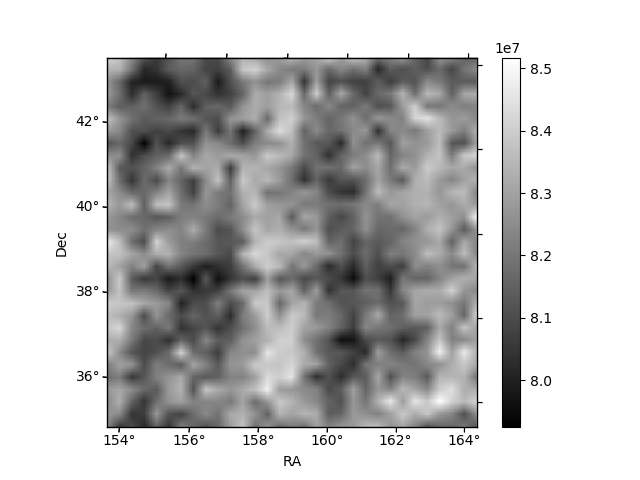
Histogram calculated using DETX and DETY for each event in the final _common_clean file
| Quadrant A | 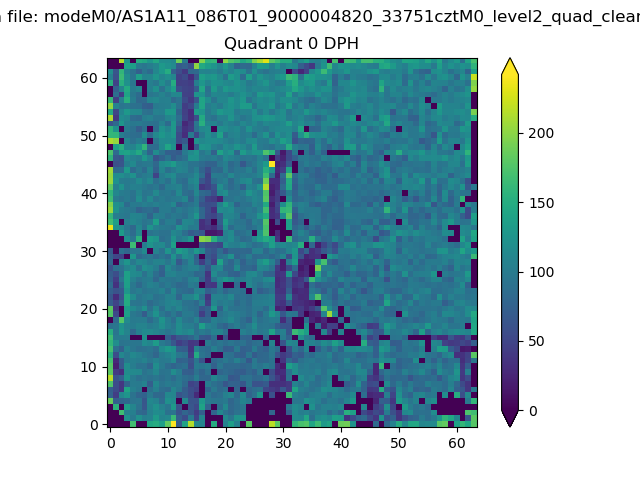 |
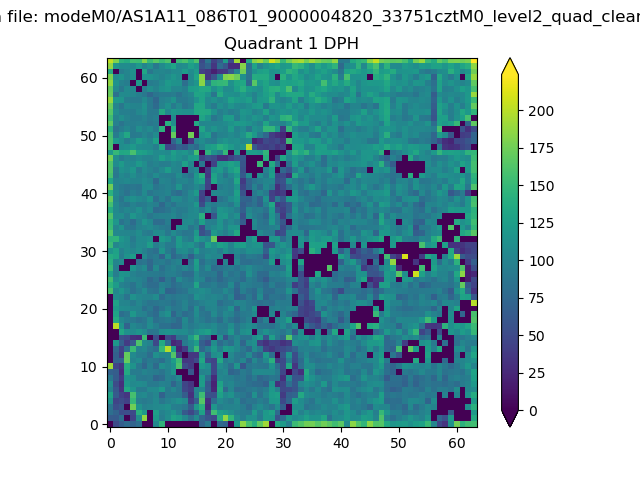 |
Quadrant B |
|---|---|---|---|
| Quadrant D | 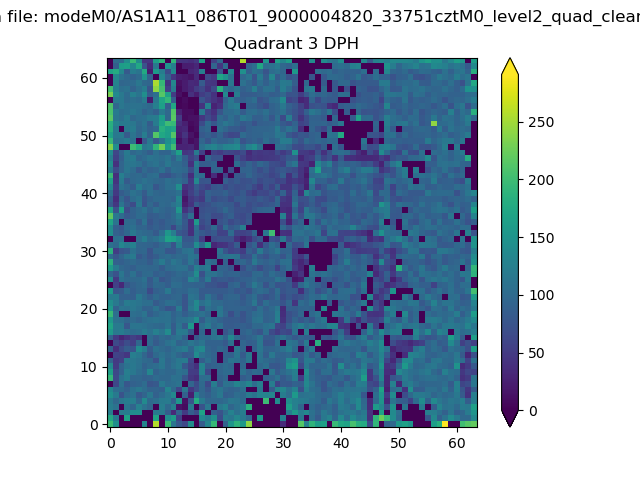 |
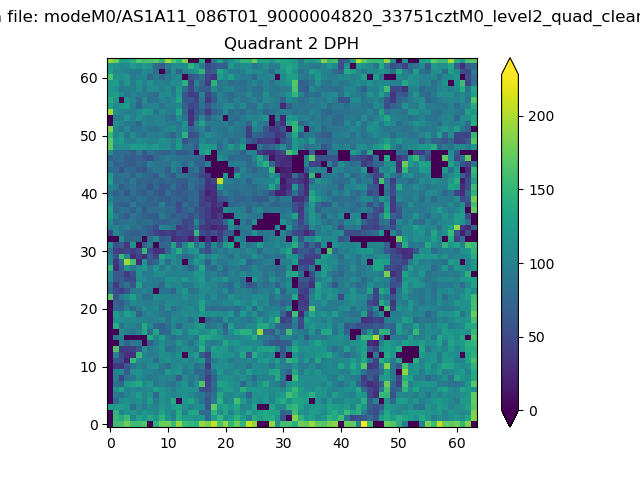 |
Quadrant C |
| Plot type | Count rate plots | Images |
|---|---|---|
| Comparison with Poisson distribution Blue bars denote a histogram of data divided into 1 sec bins. Red curve is a Poisson curve with rate = median count rate of data. |
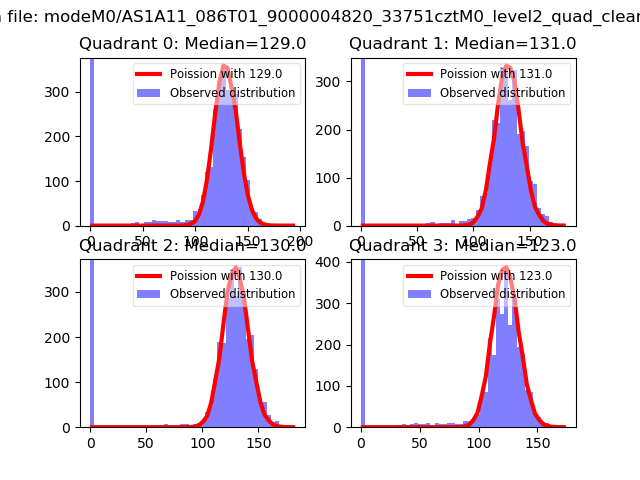 |
 |
| Quadrant-wise count rates Data is divided into 100 sec bins |
 |
|
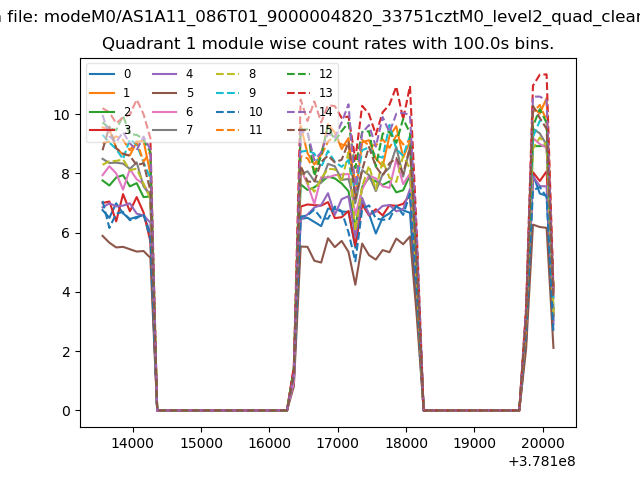
| Module-wise count rates for Quadrant A Data is divided into 100 sec bins |
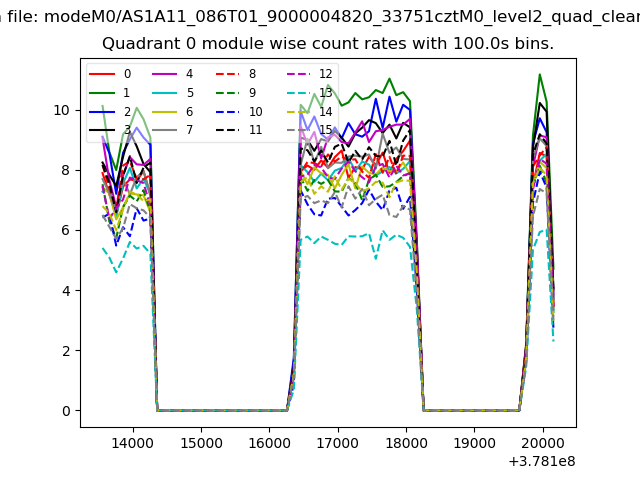 |
 |
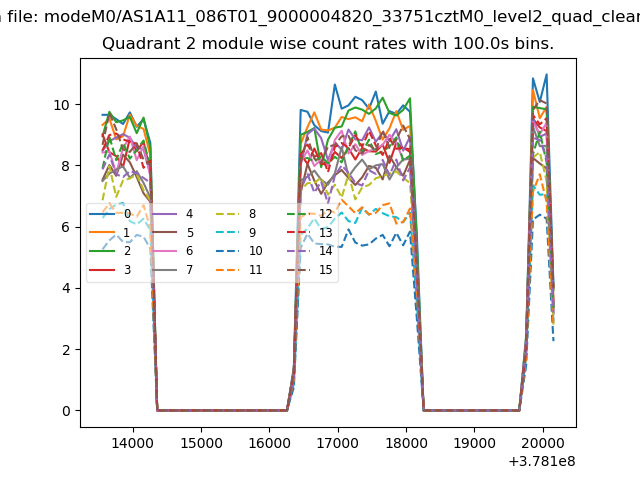
| Module-wise count rates for Quadrant B Data is divided into 100 sec bins |
 |
 |
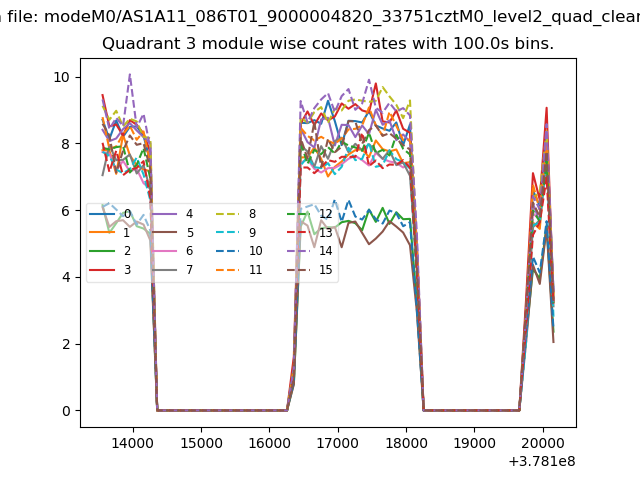
| Module-wise count rates for Quadrant C Data is divided into 100 sec bins |
 |
 |
| Module-wise count rates for Quadrant D Data is divided into 100 sec bins |
 |
 |
| Parameter | Plot |
|---|---|
| CZT HV Monitor | 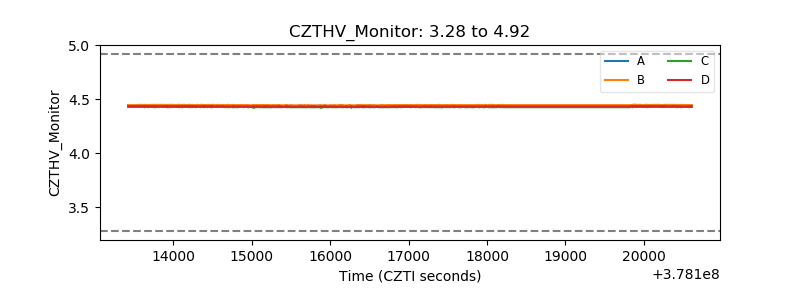 |
| D_VDD | 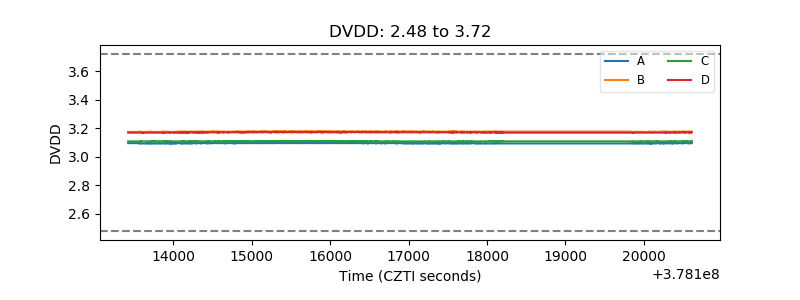 |
| Temperature 1 | 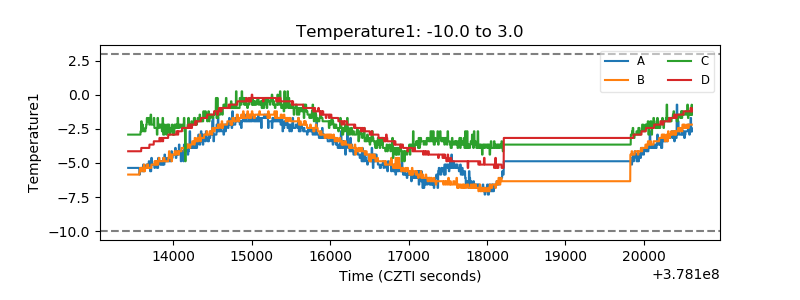 |
| Veto HV Monitor | 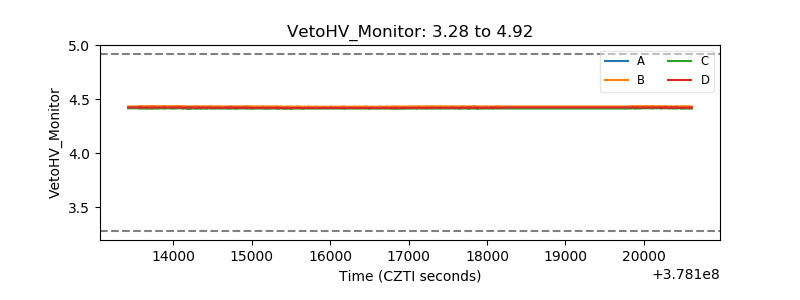 |
| Veto LLD | 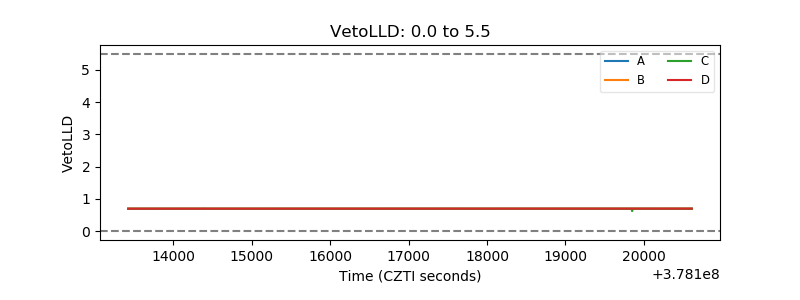 |
| Alpha Counter | 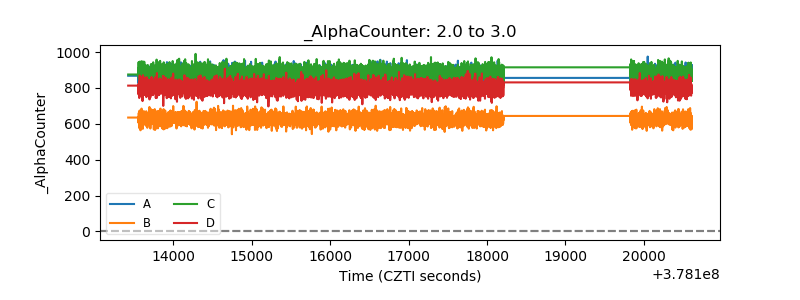 |
| _CPM_Rate | 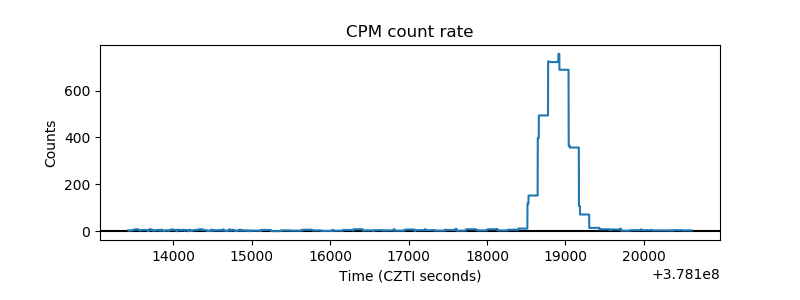 |
| CZT Counter | 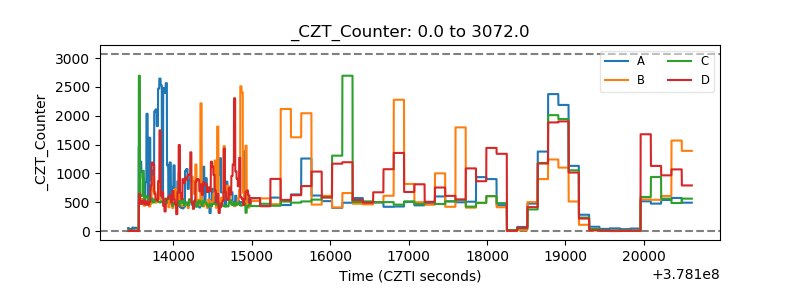 |
| +2.5 Volts monitor | 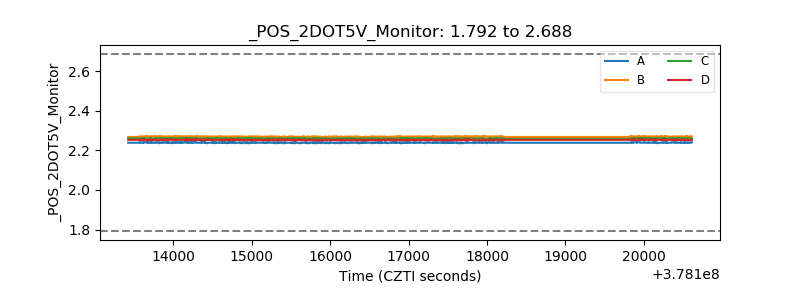 |
| +5 Volts monitor |  |
| _ROLL_ROT | 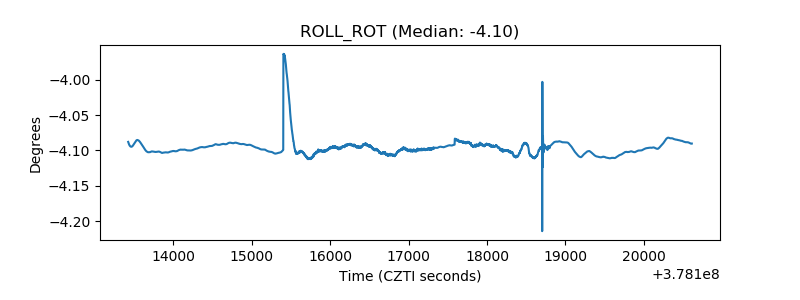 |
| _Roll_DEC | 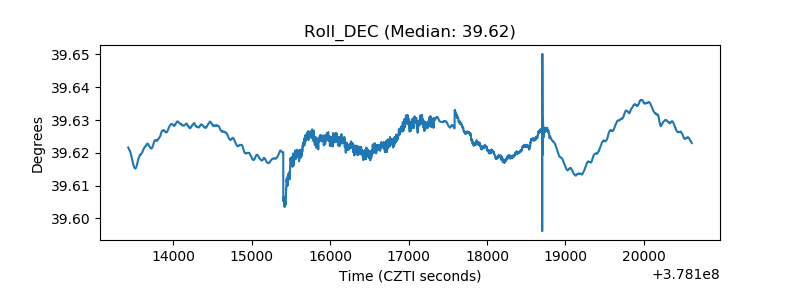 |
| _Roll_RA | 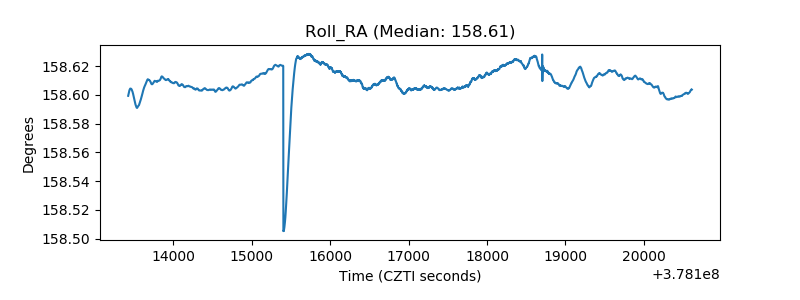 |
| Veto Counter | 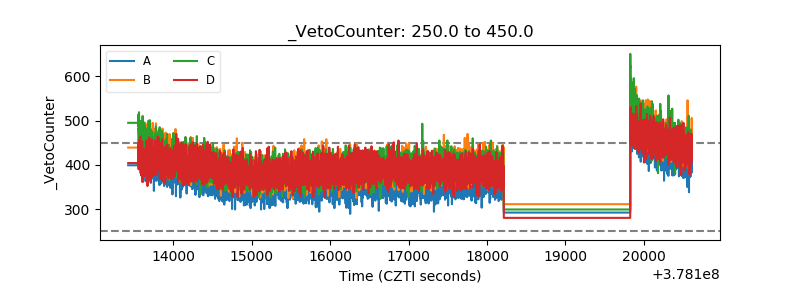 |