| Param | Original file | Final file |
|---|---|---|
| Filename | modeM0/AS1A11_086T01_9000004820_33754cztM0_level2.evt | modeM0/AS1A11_086T01_9000004820_33754cztM0_level2_quad_clean.evt |
| Size (bytes) | 515,577,600 | 53,974,080 |
| Size | 491.7 MB | 51.5 MB |
| Events in quadrant A | 3,086,101 | 321,402 |
| Events in quadrant B | 3,489,633 | 317,039 |
| Events in quadrant C | 3,656,306 | 311,169 |
| Events in quadrant D | 5,013,196 | 302,614 |
| Mode M9 | |||
|---|---|---|---|
| Quadrant | BADHDUFLAG | Total packets | Discarded packets |
| A | 0 | 23 | 0 |
| B | 0 | 23 | 0 |
| C | 0 | 23 | 0 |
| D | 0 | 24 | 0 |
| Mode SS | |||
|---|---|---|---|
| Quadrant | BADHDUFLAG | Total packets | Discarded packets |
| A | 0 | 112 | 0 |
| B | 0 | 112 | 0 |
| C | 0 | 112 | 0 |
| D | 0 | 112 | 0 |
| Mode M0 | |||
|---|---|---|---|
| Quadrant | BADHDUFLAG | Total packets | Discarded packets |
| A | 0 | 12589 | 3 |
| B | 0 | 13825 | 2 |
| C | 0 | 14347 | 2 |
| D | 0 | 18692 | 2 |
| Quadrant | Total seconds | Saturated seconds | Saturation percentage |
|---|---|---|---|
| A | 5450 | 78 | 1.431193% |
| B | 5450 | 141 | 2.587156% |
| C | 5450 | 135 | 2.477064% |
| D | 5450 | 81 | 1.486239% |
Noise dominated data is calculated using 1-second bins in cleaned event files. If a bin has >2000 counts, and if more than 50% of those come from <1% of pixels, then it is considered to be noise-dominated and hence unusable.
| Quadrant | # 1 sec bins | Bins with >0 counts | Bins with >2000 counts | High rate bins dominated by noise | Noise dominated (total time) | Noise dominated (detector-on time) | Marked lightcurve |
|---|---|---|---|---|---|---|---|
| A | 7334 | 5451 | 41 | 41 | 0.56% | 0.75% | 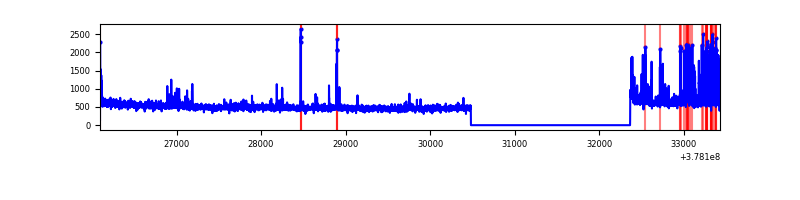 |
| B | 7334 | 5451 | 94 | 94 | 1.28% | 1.72% | 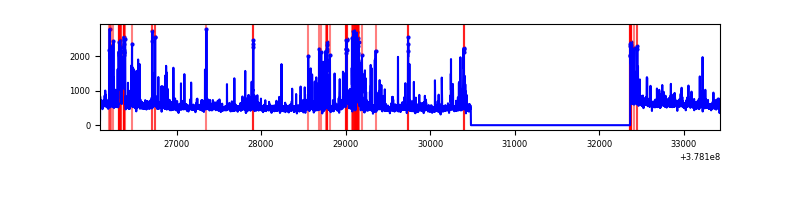 |
| C | 7334 | 5451 | 120 | 120 | 1.64% | 2.20% | 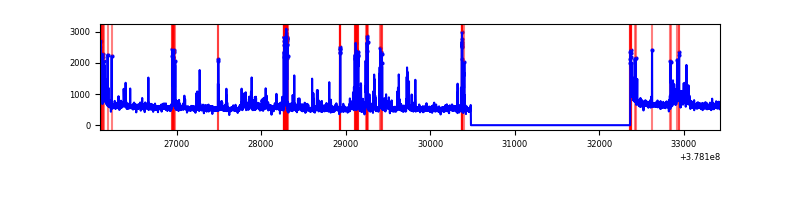 |
| D | 7334 | 5451 | 62 | 62 | 0.85% | 1.14% | 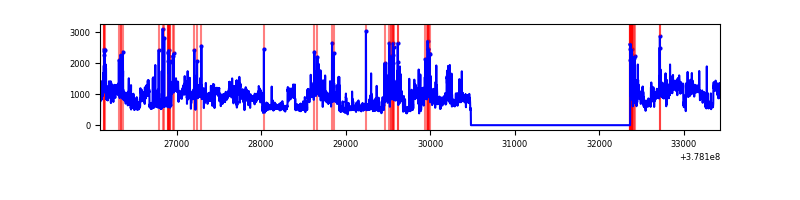 |
Top three noisy pixels from each quadrant. If the there are fewer than three noisy pixels in the level2.evt file, extra rows are filled as -1
| Pixel properties | Quadrant properties | ||||||
|---|---|---|---|---|---|---|---|
| Quadrant | DetID | PixID | Counts | Sigma | Mean | Median | Sigma |
| A | 15 | 169 | 304393 | 2175.55 | 702 | 690 | 139.6 |
| A | 9 | 191 | 30921 | 216.56 | 702 | 690 | 139.6 |
| A | 15 | 237 | 18524 | 127.75 | 702 | 690 | 139.6 |
| B | 5 | 172 | 276768 | 2128.46 | 692 | 676 | 129.7 |
| B | 5 | 255 | 209191 | 1607.49 | 692 | 676 | 129.7 |
| B | 0 | 199 | 67708 | 516.77 | 692 | 676 | 129.7 |
| C | 9 | 187 | 334960 | 2144.64 | 678 | 686 | 155.9 |
| C | 15 | 214 | 239328 | 1531.08 | 678 | 686 | 155.9 |
| C | 14 | 254 | 190633 | 1218.67 | 678 | 686 | 155.9 |
| D | 8 | 195 | 1843156 | 10913.43 | 684 | 662 | 168.8 |
| D | 2 | 250 | 151856 | 895.55 | 684 | 662 | 168.8 |
| D | 1 | 47 | 69594 | 408.3 | 684 | 662 | 168.8 |
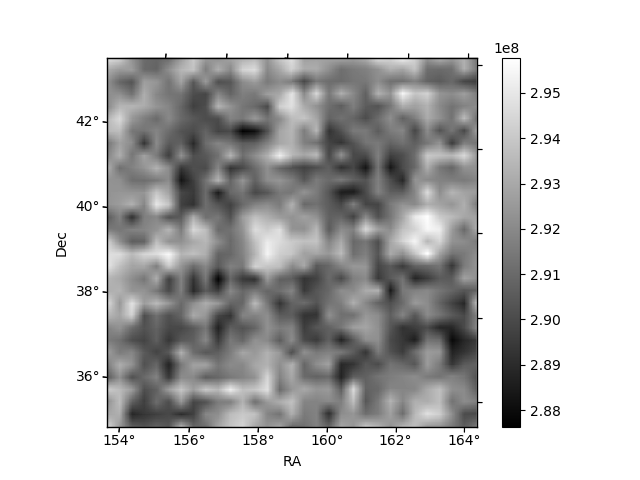
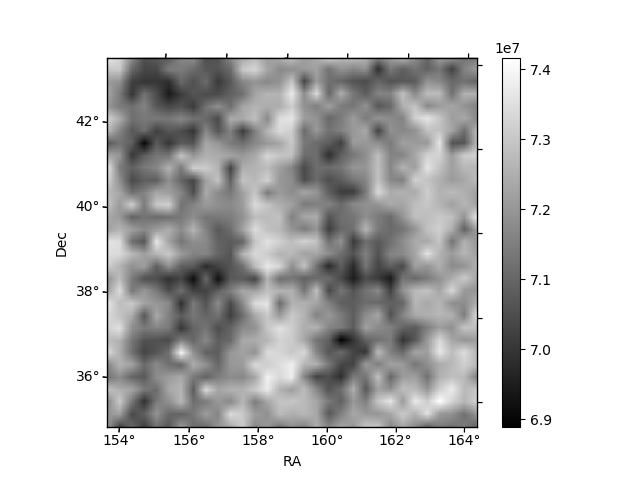
Histogram calculated using DETX and DETY for each event in the final _common_clean file
| Quadrant A | 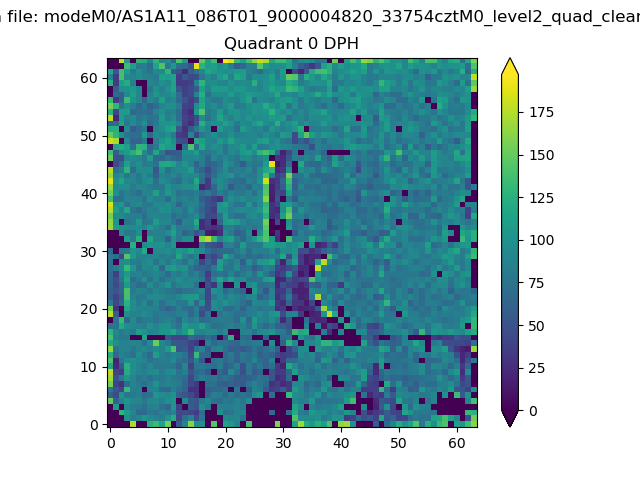 |
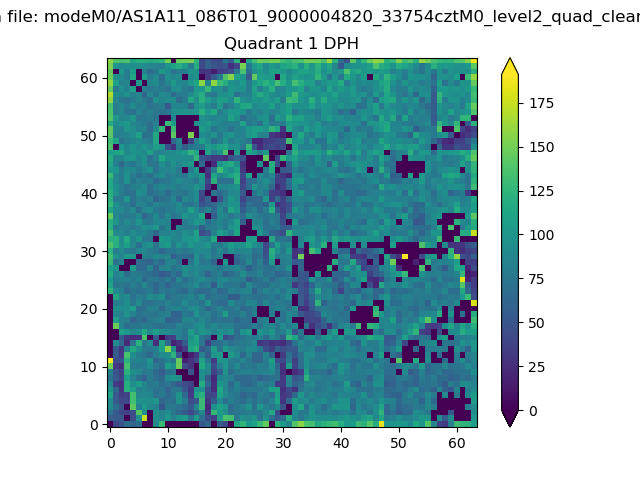 |
Quadrant B |
|---|---|---|---|
| Quadrant D | 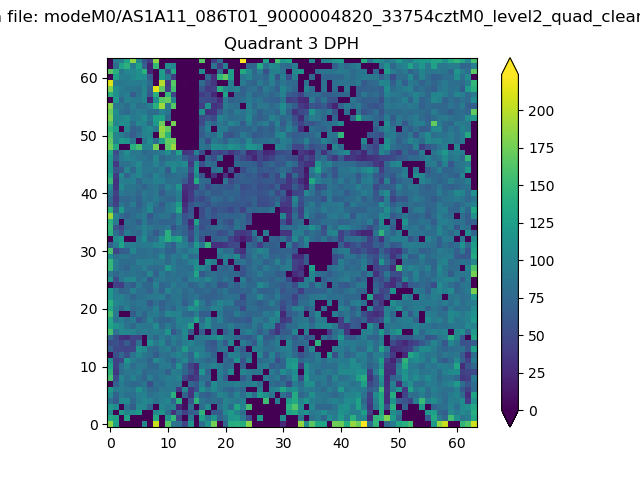 |
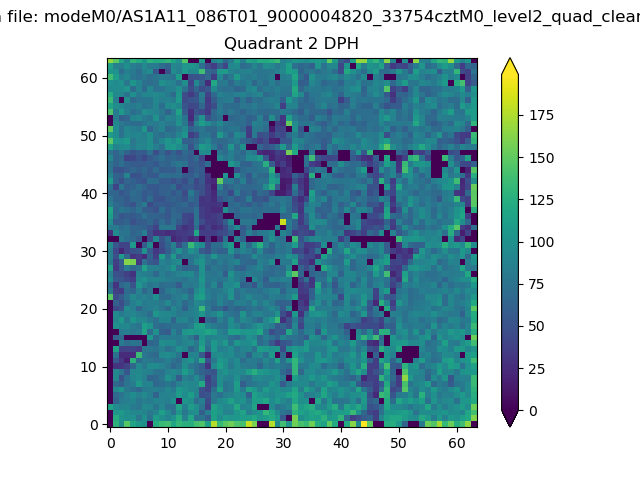 |
Quadrant C |
| Plot type | Count rate plots | Images |
|---|---|---|
| Comparison with Poisson distribution Blue bars denote a histogram of data divided into 1 sec bins. Red curve is a Poisson curve with rate = median count rate of data. |
 |
 |
| Quadrant-wise count rates Data is divided into 100 sec bins |
 |
|
| Module-wise count rates for Quadrant A Data is divided into 100 sec bins |
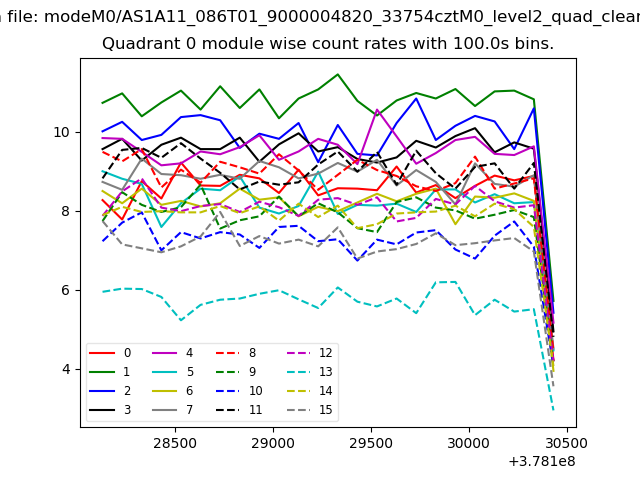 |
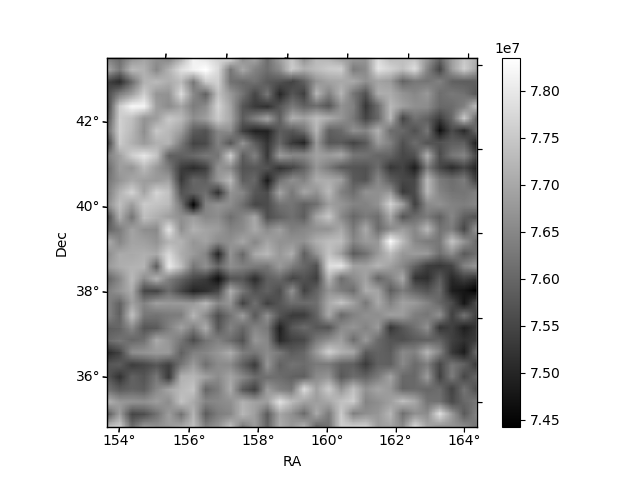 |
| Module-wise count rates for Quadrant B Data is divided into 100 sec bins |
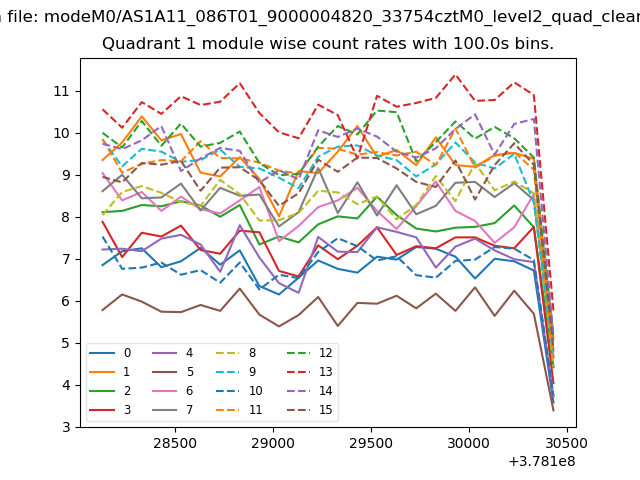 |
 |
| Module-wise count rates for Quadrant C Data is divided into 100 sec bins |
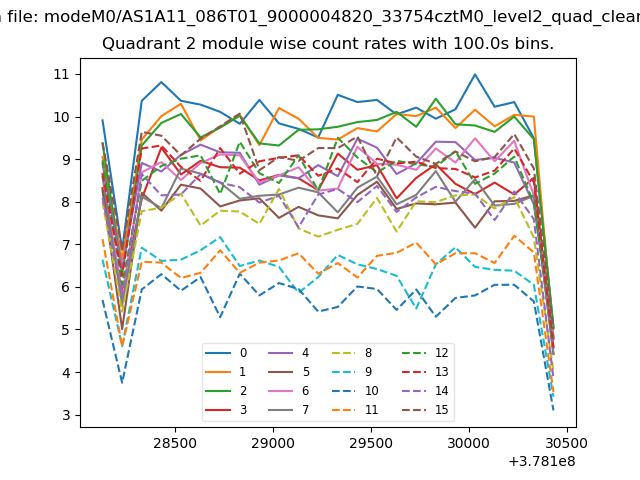 |
 |
| Module-wise count rates for Quadrant D Data is divided into 100 sec bins |
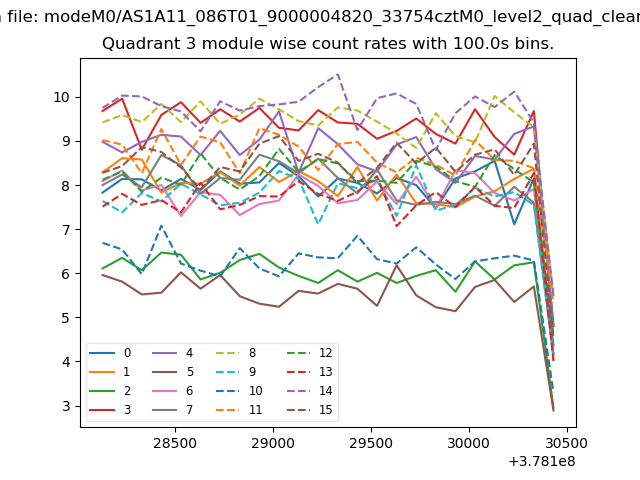 |
 |
| Parameter | Plot |
|---|---|
| CZT HV Monitor | 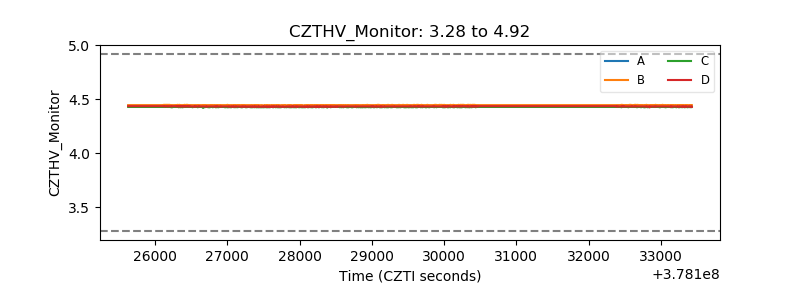 |
| D_VDD | 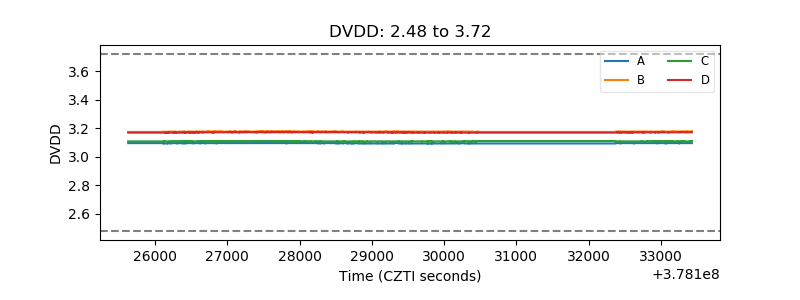 |
| Temperature 1 | 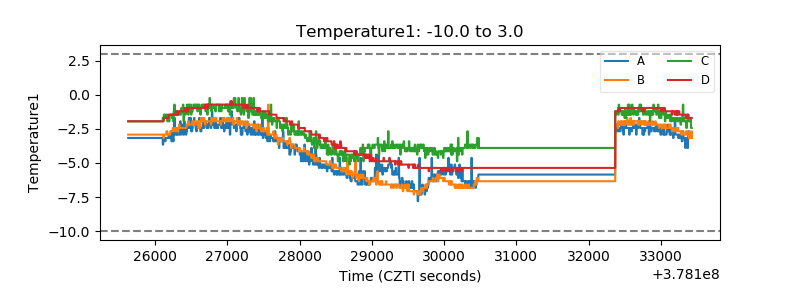 |
| Veto HV Monitor | 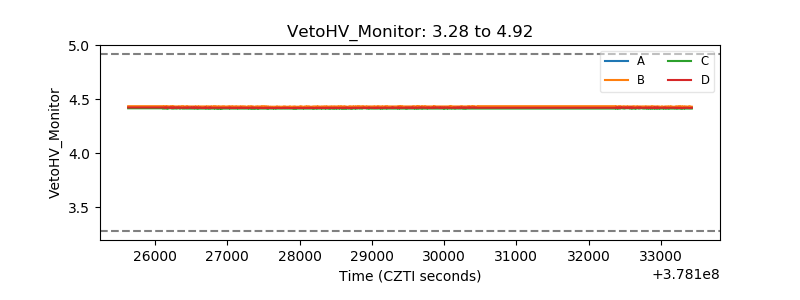 |
| Veto LLD | 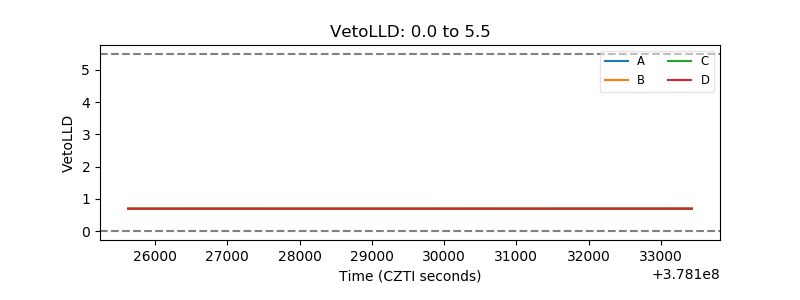 |
| Alpha Counter | 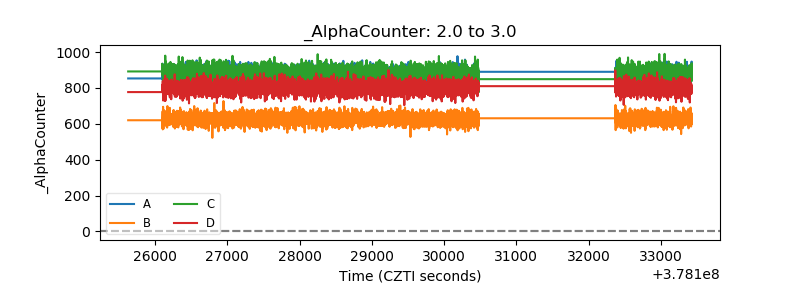 |
| _CPM_Rate |  |
| CZT Counter | 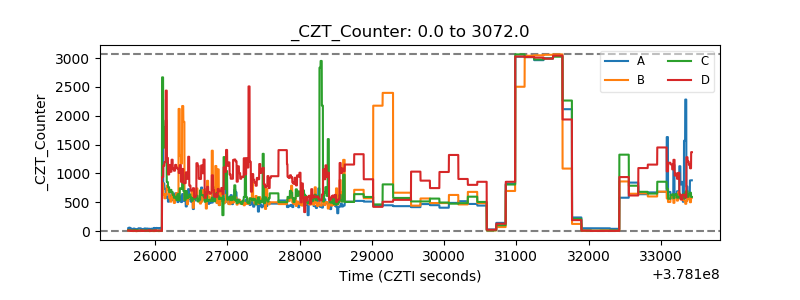 |
| +2.5 Volts monitor |  |
| +5 Volts monitor |  |
| _ROLL_ROT | 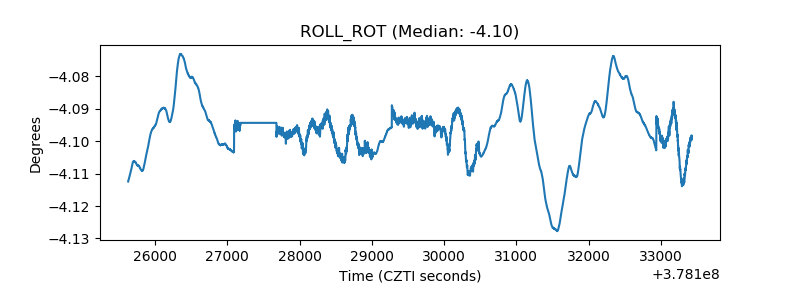 |
| _Roll_DEC | 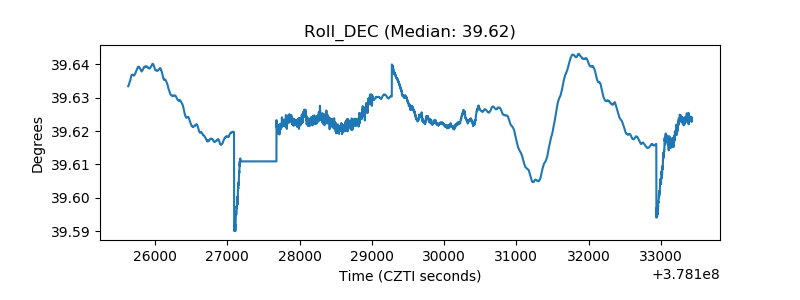 |
| _Roll_RA | 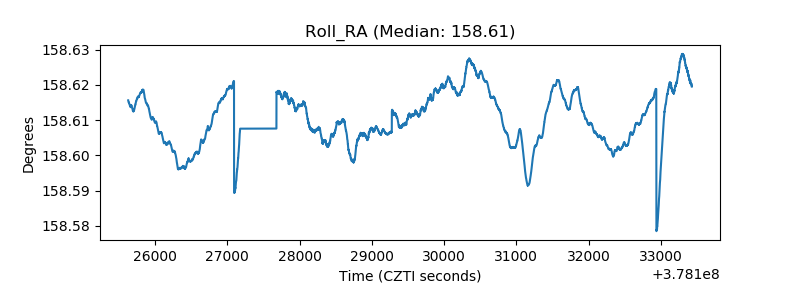 |
| Veto Counter | 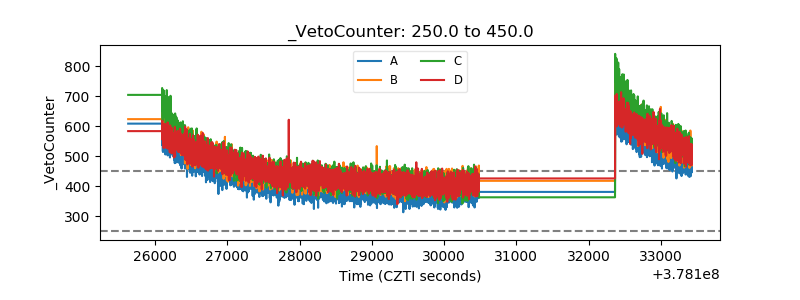 |