| Param | Original file | Final file |
|---|---|---|
| Filename | modeM0/AS1A11_086T01_9000004820_33756cztM0_level2.evt | modeM0/AS1A11_086T01_9000004820_33756cztM0_level2_quad_clean.evt |
| Size (bytes) | 489,968,640 | 70,894,080 |
| Size | 467.3 MB | 67.6 MB |
| Events in quadrant A | 2,621,625 | 457,552 |
| Events in quadrant B | 3,385,437 | 457,393 |
| Events in quadrant C | 3,684,547 | 453,754 |
| Events in quadrant D | 4,808,389 | 427,147 |
| Mode M9 | |||
|---|---|---|---|
| Quadrant | BADHDUFLAG | Total packets | Discarded packets |
| A | 0 | 37 | 0 |
| B | 0 | 37 | 0 |
| C | 0 | 37 | 0 |
| D | 0 | 38 | 0 |
| Mode SS | |||
|---|---|---|---|
| Quadrant | BADHDUFLAG | Total packets | Discarded packets |
| A | 0 | 102 | 0 |
| B | 0 | 102 | 0 |
| C | 0 | 102 | 0 |
| D | 0 | 102 | 0 |
| Mode M0 | |||
|---|---|---|---|
| Quadrant | BADHDUFLAG | Total packets | Discarded packets |
| A | 0 | 10904 | 3 |
| B | 0 | 13294 | 2 |
| C | 0 | 14449 | 2 |
| D | 0 | 17839 | 2 |
| Quadrant | Total seconds | Saturated seconds | Saturation percentage |
|---|---|---|---|
| A | 5002 | 9 | 0.179928% |
| B | 5002 | 204 | 4.078369% |
| C | 5002 | 155 | 3.098760% |
| D | 5002 | 247 | 4.938025% |
Noise dominated data is calculated using 1-second bins in cleaned event files. If a bin has >2000 counts, and if more than 50% of those come from <1% of pixels, then it is considered to be noise-dominated and hence unusable.
| Quadrant | # 1 sec bins | Bins with >0 counts | Bins with >2000 counts | High rate bins dominated by noise | Noise dominated (total time) | Noise dominated (detector-on time) | Marked lightcurve |
|---|---|---|---|---|---|---|---|
| A | 7096 | 5003 | 0 | 0 | 0.00% | 0.00% | 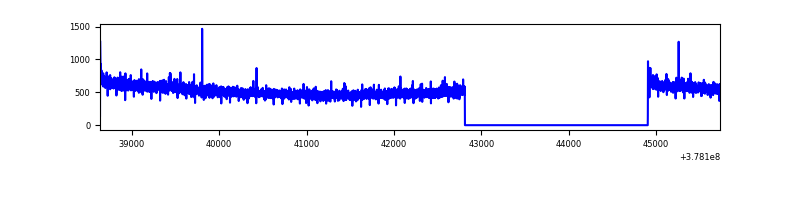 |
| B | 7096 | 5003 | 168 | 168 | 2.37% | 3.36% | 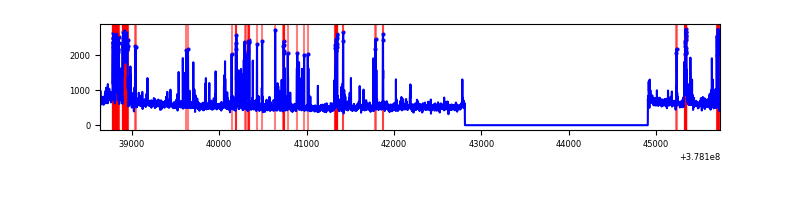 |
| C | 7096 | 5003 | 127 | 127 | 1.79% | 2.54% | 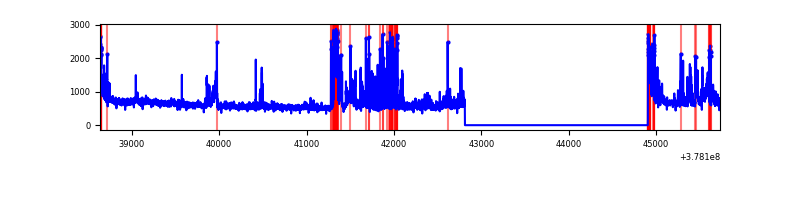 |
| D | 7096 | 5003 | 164 | 164 | 2.31% | 3.28% | 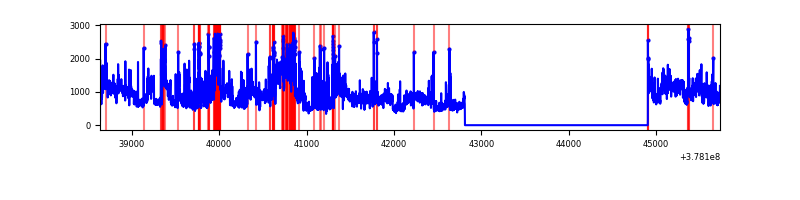 |
Top three noisy pixels from each quadrant. If the there are fewer than three noisy pixels in the level2.evt file, extra rows are filled as -1
| Pixel properties | Quadrant properties | ||||||
|---|---|---|---|---|---|---|---|
| Quadrant | DetID | PixID | Counts | Sigma | Mean | Median | Sigma |
| A | 10 | 83 | 10287 | 71.95 | 672 | 660 | 133.8 |
| A | 13 | 254 | 10258 | 71.73 | 672 | 660 | 133.8 |
| A | 15 | 169 | 8803 | 60.86 | 672 | 660 | 133.8 |
| B | 5 | 172 | 442170 | 3601.51 | 657 | 643 | 122.6 |
| B | 5 | 255 | 152429 | 1238.11 | 657 | 643 | 122.6 |
| B | 0 | 190 | 43486 | 349.47 | 657 | 643 | 122.6 |
| C | 0 | 239 | 514831 | 3456.05 | 658 | 666 | 148.8 |
| C | 15 | 214 | 219369 | 1470.05 | 658 | 666 | 148.8 |
| C | 0 | 10 | 112695 | 753.02 | 658 | 666 | 148.8 |
| D | 8 | 195 | 1318875 | 8331.56 | 655 | 639 | 158.2 |
| D | 15 | 0 | 256367 | 1616.26 | 655 | 639 | 158.2 |
| D | 1 | 47 | 253588 | 1598.7 | 655 | 639 | 158.2 |
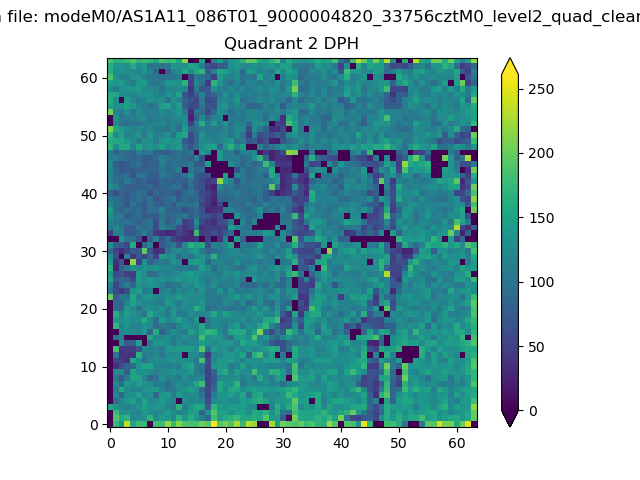
Histogram calculated using DETX and DETY for each event in the final _common_clean file
| Quadrant A | 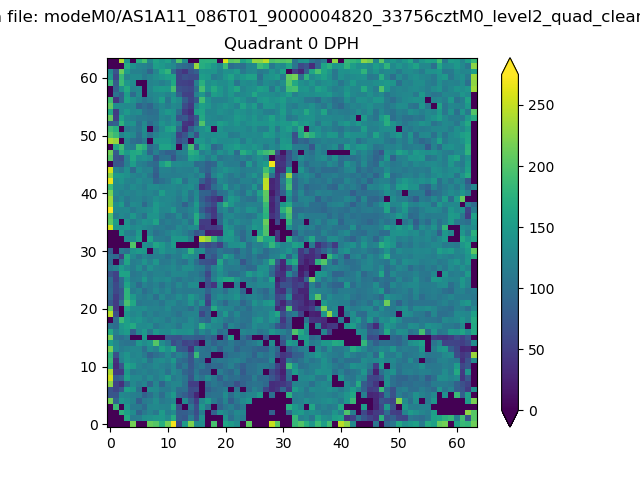 |
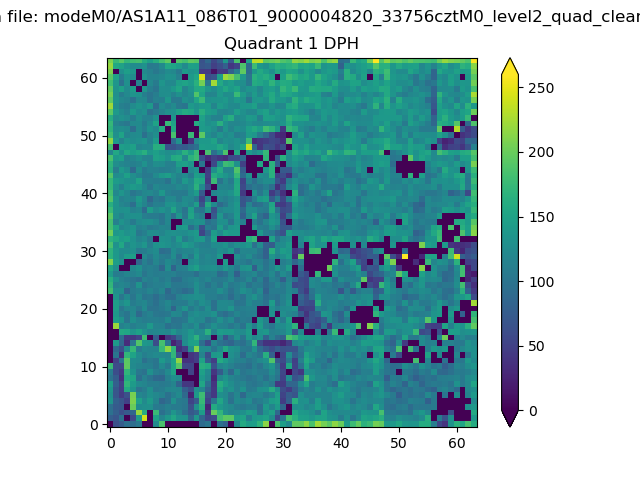 |
Quadrant B |
|---|---|---|---|
| Quadrant D | 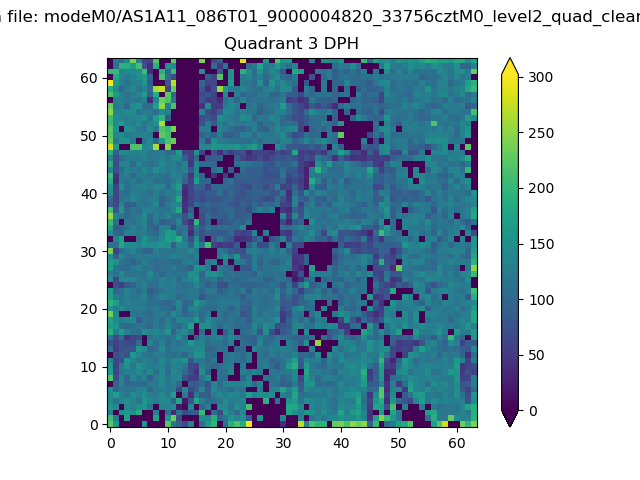 |
 |
Quadrant C |
| Plot type | Count rate plots | Images |
|---|---|---|
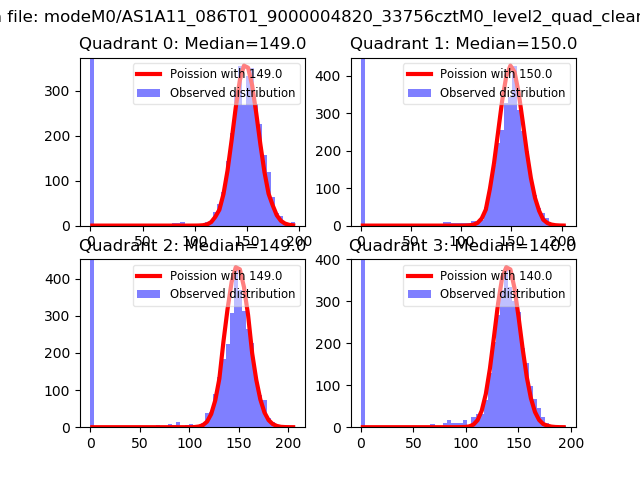
| Comparison with Poisson distribution Blue bars denote a histogram of data divided into 1 sec bins. Red curve is a Poisson curve with rate = median count rate of data. |
 |
 |
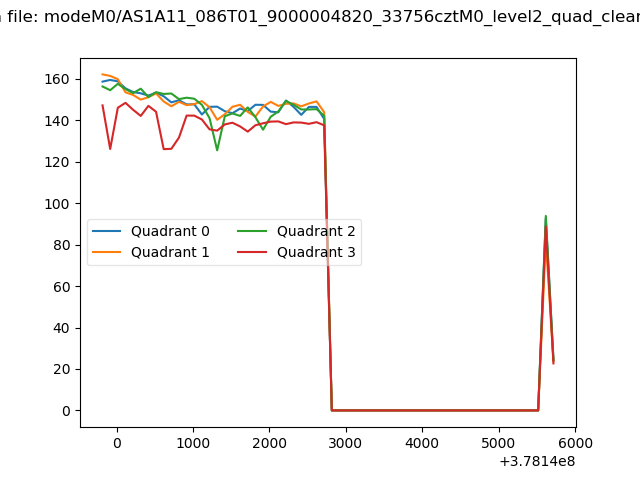
| Quadrant-wise count rates Data is divided into 100 sec bins |
 |
|
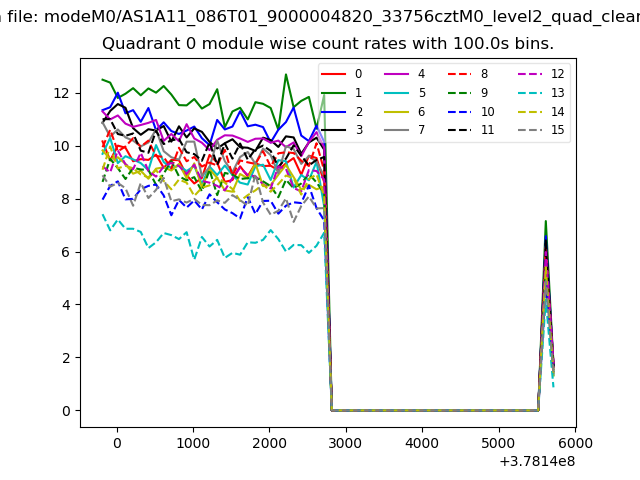
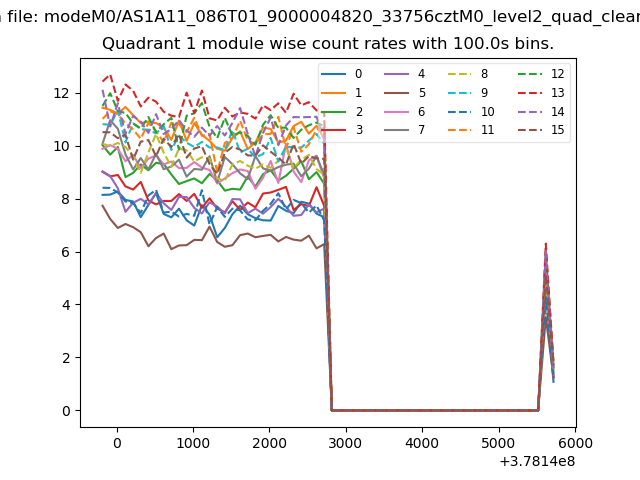
| Module-wise count rates for Quadrant A Data is divided into 100 sec bins |
 |
 |
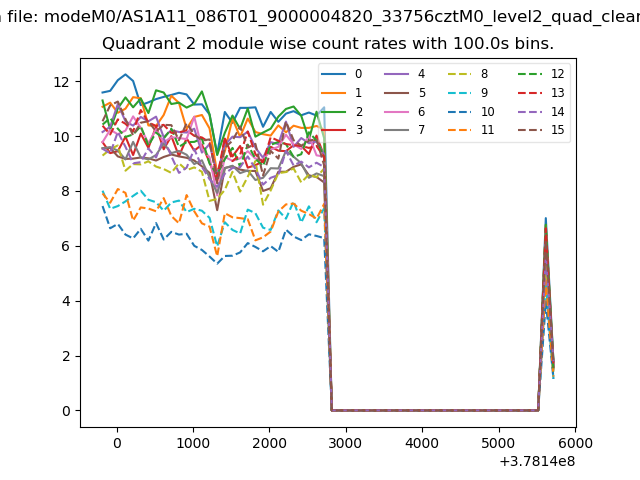
| Module-wise count rates for Quadrant B Data is divided into 100 sec bins |
 |
 |
| Module-wise count rates for Quadrant C Data is divided into 100 sec bins |
 |
 |
| Module-wise count rates for Quadrant D Data is divided into 100 sec bins |
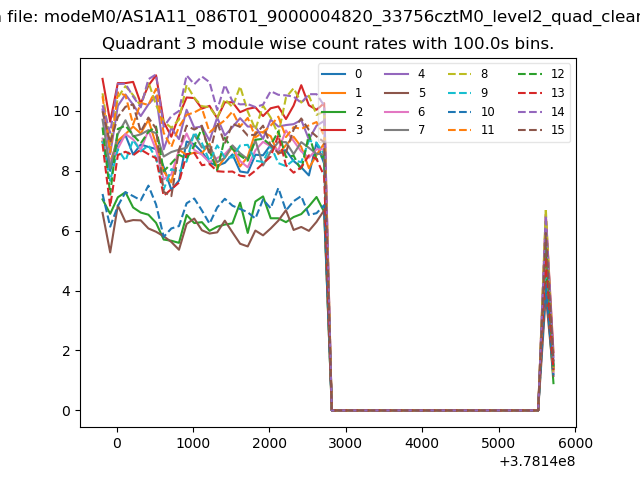 |
 |
| Parameter | Plot |
|---|---|
| CZT HV Monitor | 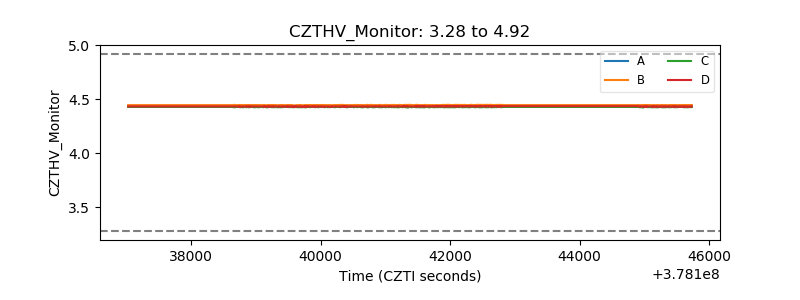 |
| D_VDD | 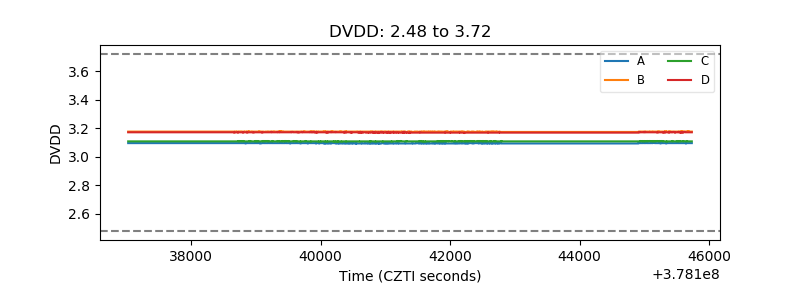 |
| Temperature 1 | 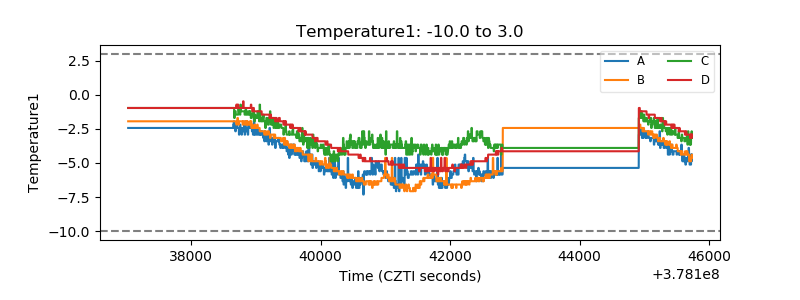 |
| Veto HV Monitor |  |
| Veto LLD | 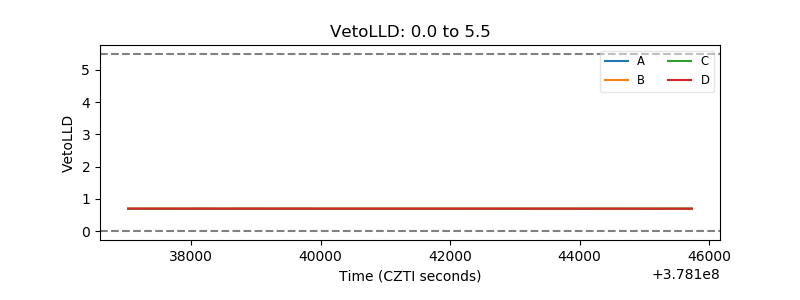 |
| Alpha Counter | 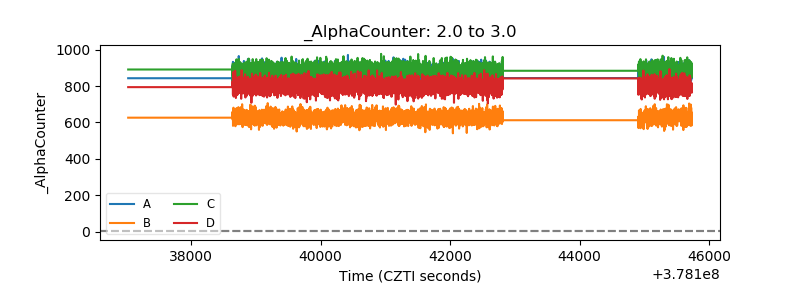 |
| _CPM_Rate | 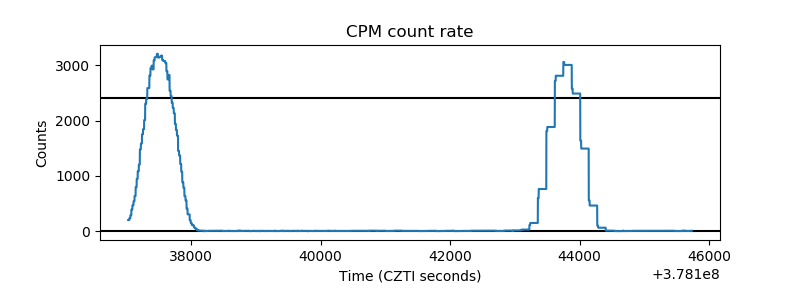 |
| CZT Counter | 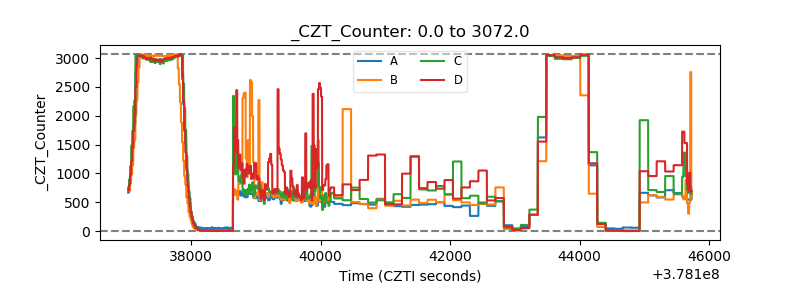 |
| +2.5 Volts monitor | 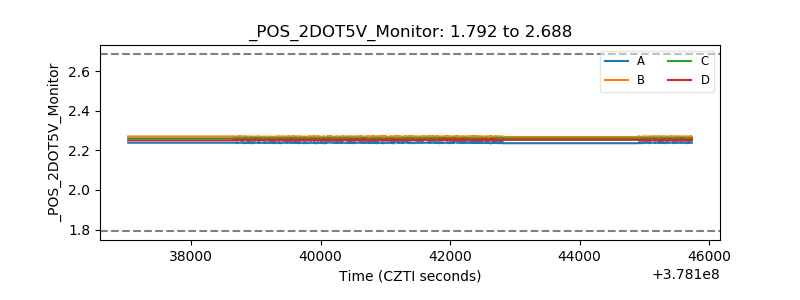 |
| +5 Volts monitor |  |
| _ROLL_ROT | 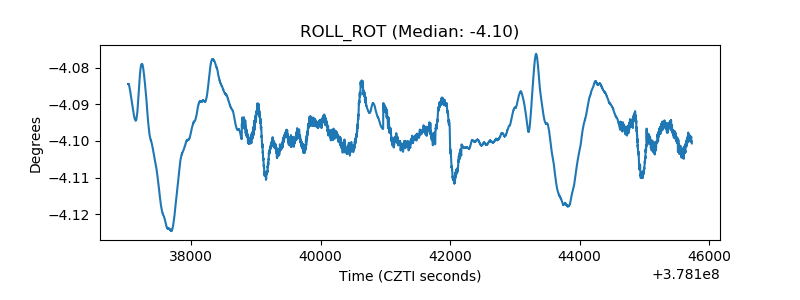 |
| _Roll_DEC | 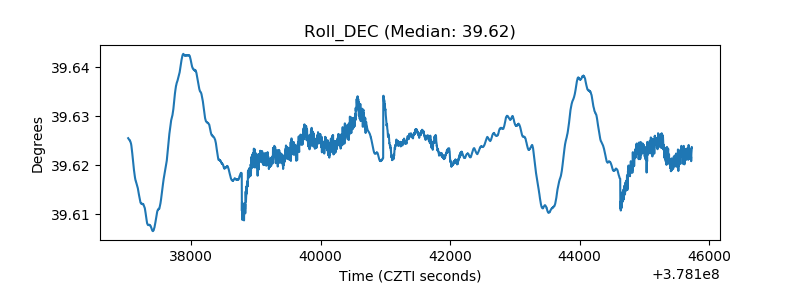 |
| _Roll_RA | 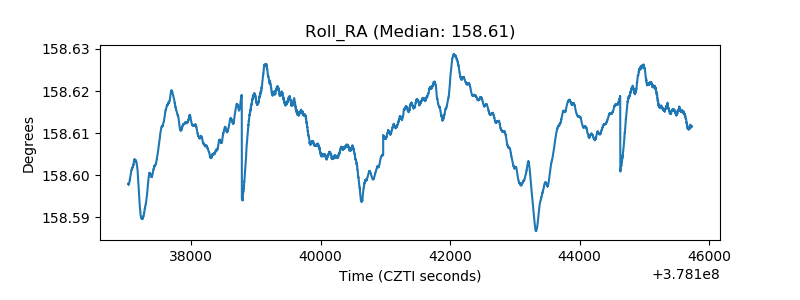 |
| Veto Counter | 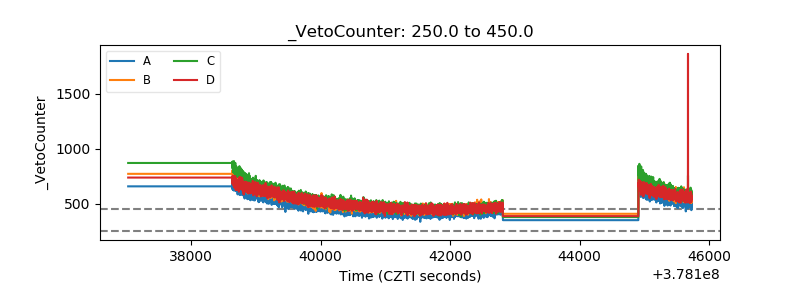 |