| Param | Original file | Final file |
|---|---|---|
| Filename | modeM0/AS1A11_086T01_9000004820_33759cztM0_level2.evt | modeM0/AS1A11_086T01_9000004820_33759cztM0_level2_quad_clean.evt |
| Size (bytes) | 526,193,280 | 91,627,200 |
| Size | 501.8 MB | 87.4 MB |
| Events in quadrant A | 4,169,478 | 589,091 |
| Events in quadrant B | 3,326,021 | 616,204 |
| Events in quadrant C | 3,842,604 | 599,375 |
| Events in quadrant D | 4,227,517 | 587,435 |
| Mode M9 | |||
|---|---|---|---|
| Quadrant | BADHDUFLAG | Total packets | Discarded packets |
| A | 0 | 40 | 0 |
| B | 0 | 40 | 0 |
| C | 0 | 40 | 0 |
| D | 0 | 40 | 0 |
| Mode SS | |||
|---|---|---|---|
| Quadrant | BADHDUFLAG | Total packets | Discarded packets |
| A | 0 | 114 | 0 |
| B | 0 | 114 | 0 |
| C | 0 | 114 | 0 |
| D | 0 | 114 | 0 |
| Mode M0 | |||
|---|---|---|---|
| Quadrant | BADHDUFLAG | Total packets | Discarded packets |
| A | 0 | 16128 | 3 |
| B | 0 | 13367 | 2 |
| C | 0 | 14755 | 2 |
| D | 0 | 16343 | 2 |
| Quadrant | Total seconds | Saturated seconds | Saturation percentage |
|---|---|---|---|
| A | 5459 | 547 | 10.020150% |
| B | 5459 | 180 | 3.297307% |
| C | 5459 | 416 | 7.620443% |
| D | 5459 | 143 | 2.619527% |
Noise dominated data is calculated using 1-second bins in cleaned event files. If a bin has >2000 counts, and if more than 50% of those come from <1% of pixels, then it is considered to be noise-dominated and hence unusable.
| Quadrant | # 1 sec bins | Bins with >0 counts | Bins with >2000 counts | High rate bins dominated by noise | Noise dominated (total time) | Noise dominated (detector-on time) | Marked lightcurve |
|---|---|---|---|---|---|---|---|
| A | 9464 | 5460 | 408 | 408 | 4.31% | 7.47% | 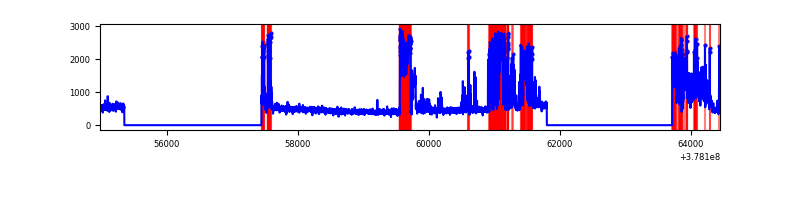 |
| B | 9464 | 5460 | 141 | 141 | 1.49% | 2.58% | 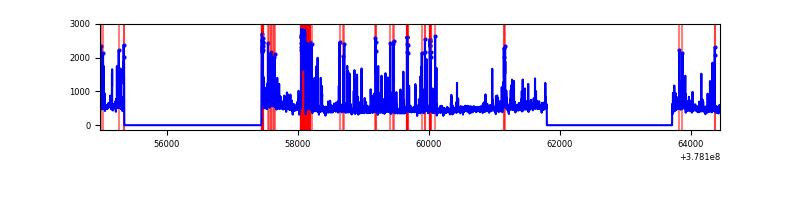 |
| C | 9465 | 5461 | 391 | 391 | 4.13% | 7.16% | 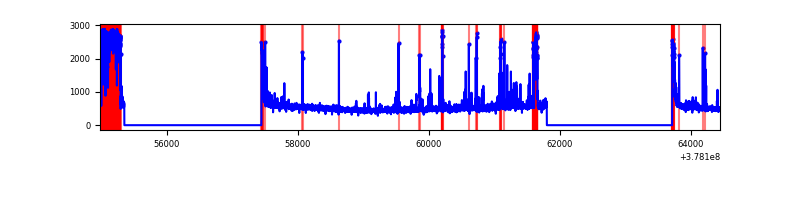 |
| D | 9465 | 5461 | 128 | 128 | 1.35% | 2.34% | 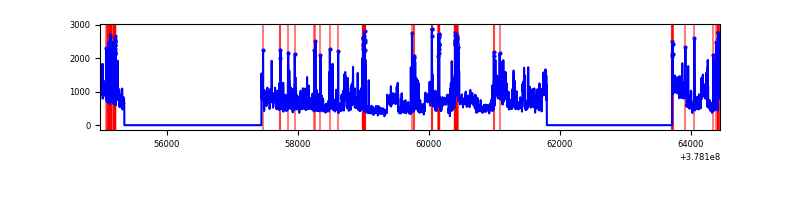 |
Top three noisy pixels from each quadrant. If the there are fewer than three noisy pixels in the level2.evt file, extra rows are filled as -1
| Pixel properties | Quadrant properties | ||||||
|---|---|---|---|---|---|---|---|
| Quadrant | DetID | PixID | Counts | Sigma | Mean | Median | Sigma |
| A | 15 | 169 | 1652833 | 13246.53 | 621 | 610 | 124.7 |
| A | 15 | 237 | 94967 | 756.5 | 621 | 610 | 124.7 |
| A | 13 | 6 | 14772 | 113.54 | 621 | 610 | 124.7 |
| B | 5 | 172 | 550202 | 4470.46 | 640 | 624 | 122.9 |
| B | 5 | 255 | 84311 | 680.74 | 640 | 624 | 122.9 |
| B | 4 | 251 | 54669 | 439.62 | 640 | 624 | 122.9 |
| C | 9 | 187 | 969213 | 6960.32 | 605 | 611 | 139.2 |
| C | 15 | 214 | 231131 | 1656.5 | 605 | 611 | 139.2 |
| C | 0 | 10 | 136628 | 977.41 | 605 | 611 | 139.2 |
| D | 8 | 195 | 970913 | 6275.05 | 626 | 610 | 154.6 |
| D | 2 | 250 | 298921 | 1929.21 | 626 | 610 | 154.6 |
| D | 1 | 47 | 220544 | 1422.34 | 626 | 610 | 154.6 |
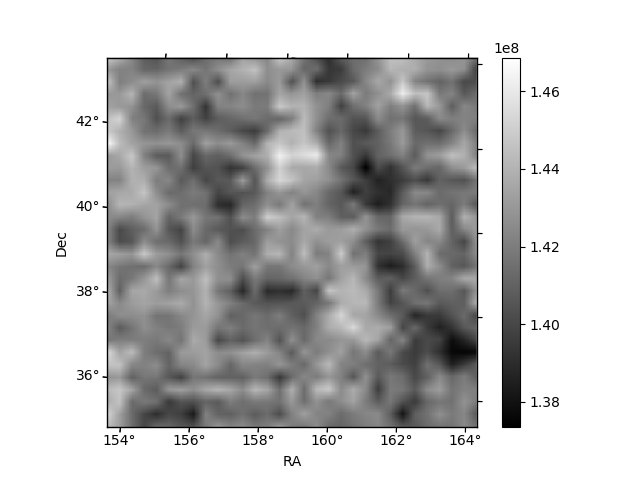
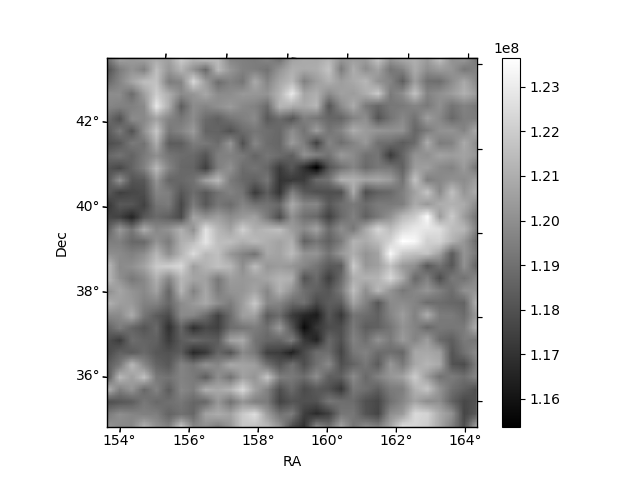
Histogram calculated using DETX and DETY for each event in the final _common_clean file
| Quadrant A | 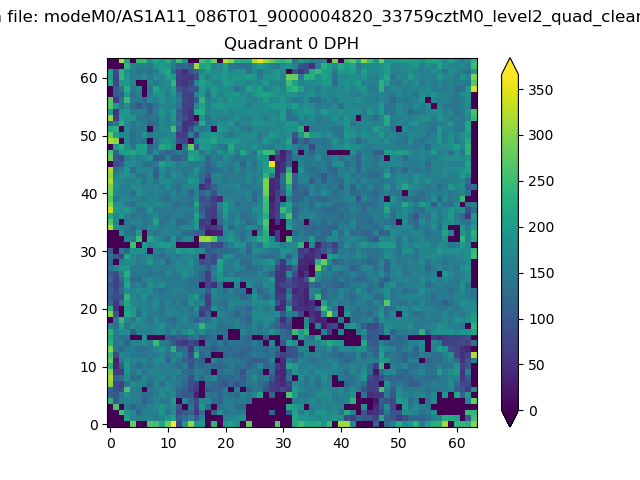 |
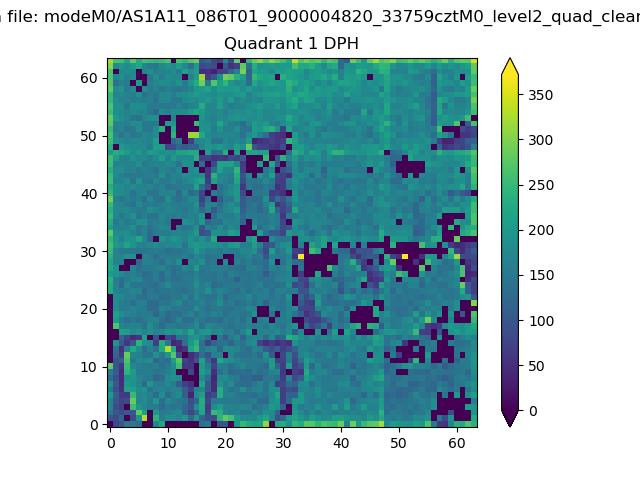 |
Quadrant B |
|---|---|---|---|
| Quadrant D | 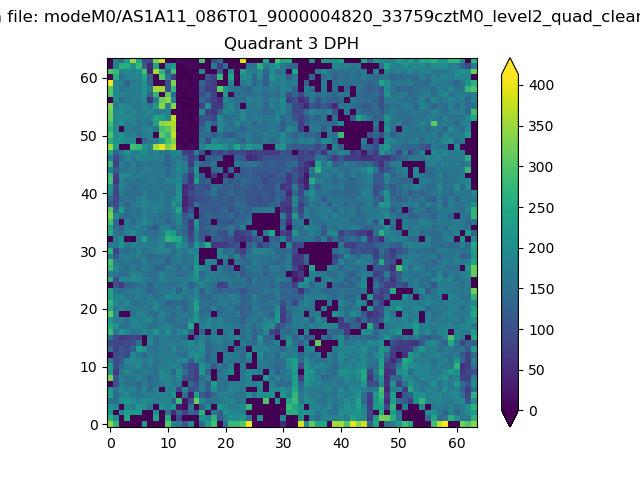 |
 |
Quadrant C |
| Plot type | Count rate plots | Images |
|---|---|---|
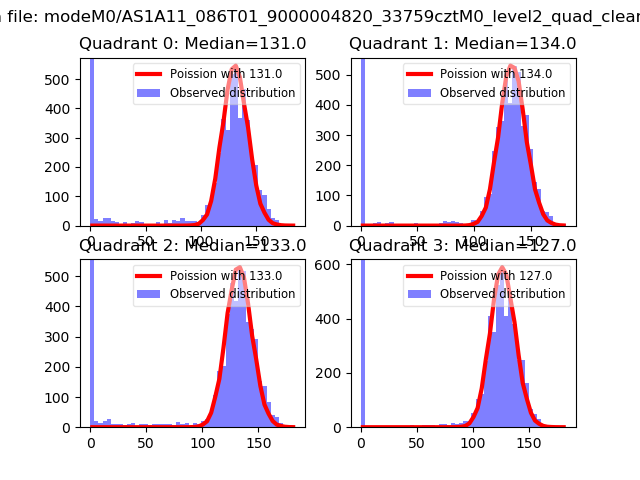
| Comparison with Poisson distribution Blue bars denote a histogram of data divided into 1 sec bins. Red curve is a Poisson curve with rate = median count rate of data. |
 |
 |
| Quadrant-wise count rates Data is divided into 100 sec bins |
 |
|
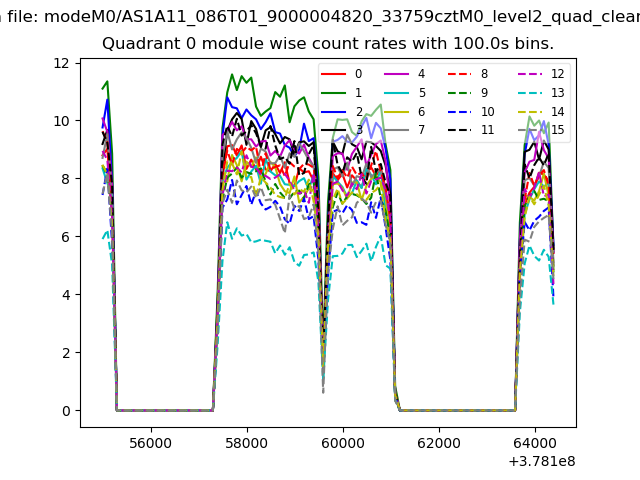
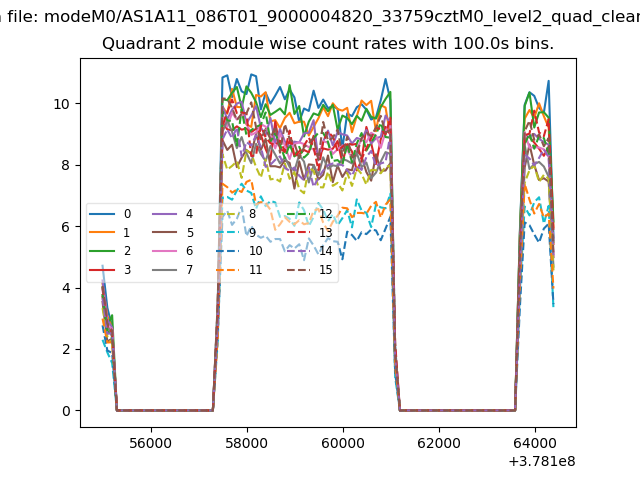
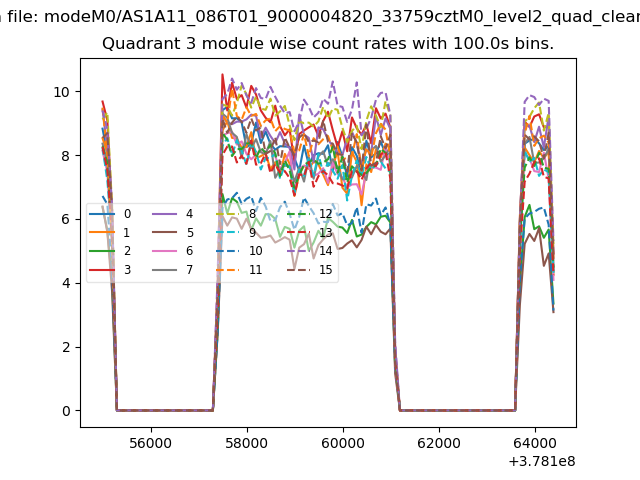
| Module-wise count rates for Quadrant A Data is divided into 100 sec bins |
 |
 |
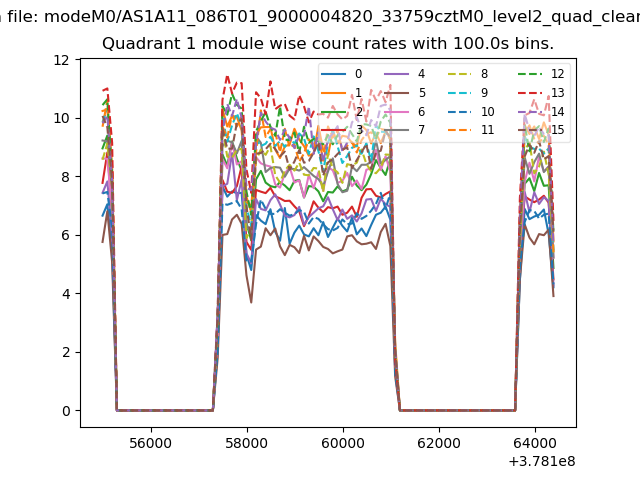
| Module-wise count rates for Quadrant B Data is divided into 100 sec bins |
 |
 |
| Module-wise count rates for Quadrant C Data is divided into 100 sec bins |
 |
 |
| Module-wise count rates for Quadrant D Data is divided into 100 sec bins |
 |
 |
| Parameter | Plot |
|---|---|
| CZT HV Monitor | 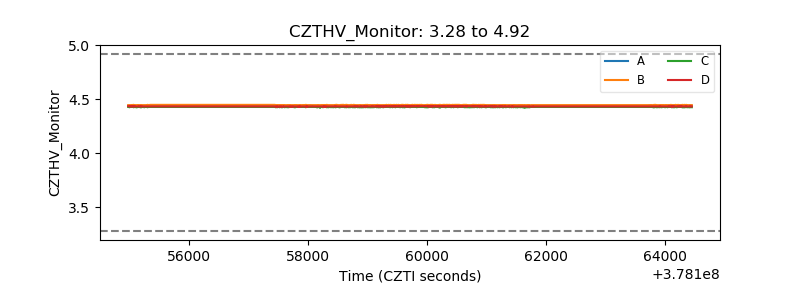 |
| D_VDD | 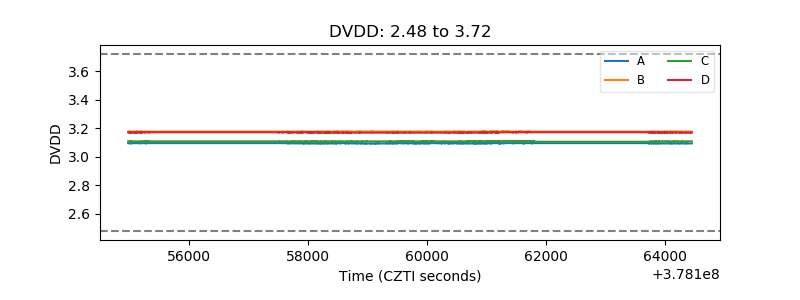 |
| Temperature 1 | 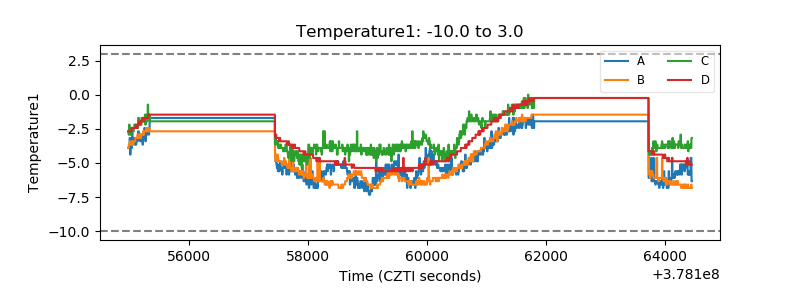 |
| Veto HV Monitor | 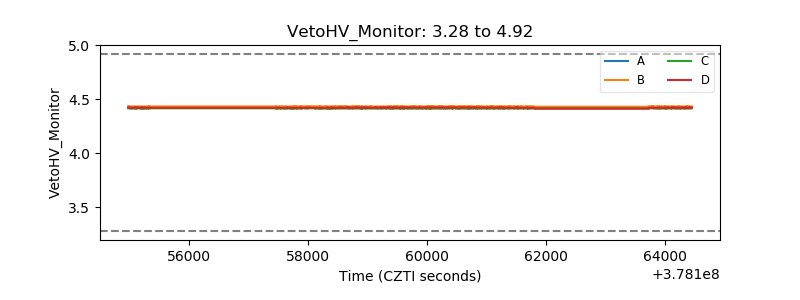 |
| Veto LLD | 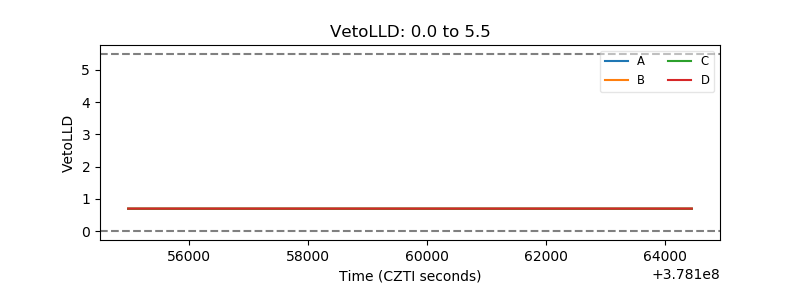 |
| Alpha Counter | 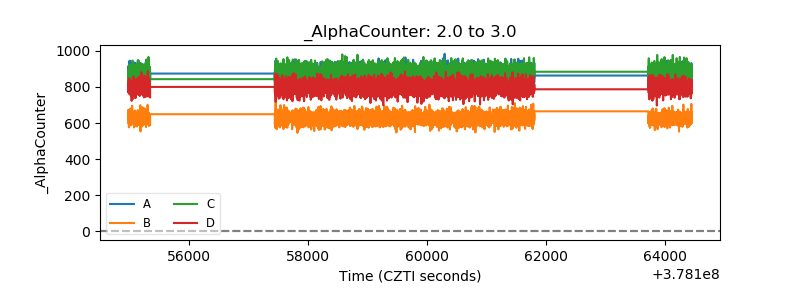 |
| _CPM_Rate |  |
| CZT Counter | 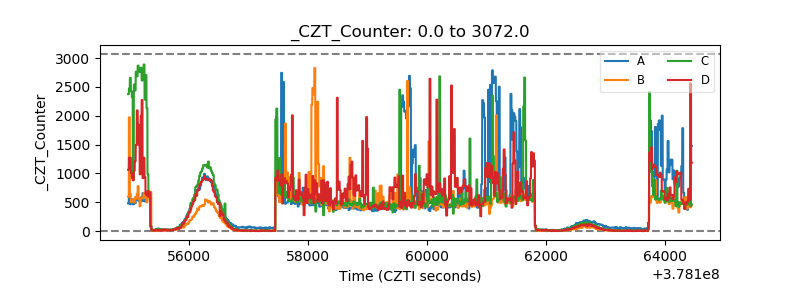 |
| +2.5 Volts monitor | 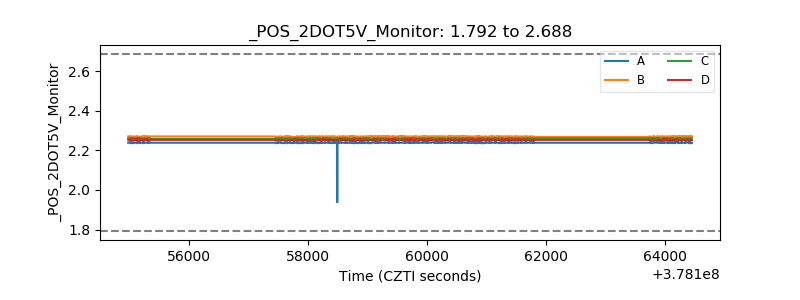 |
| +5 Volts monitor |  |
| _ROLL_ROT | 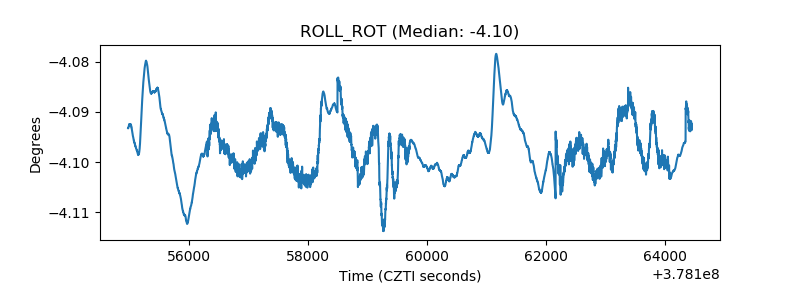 |
| _Roll_DEC | 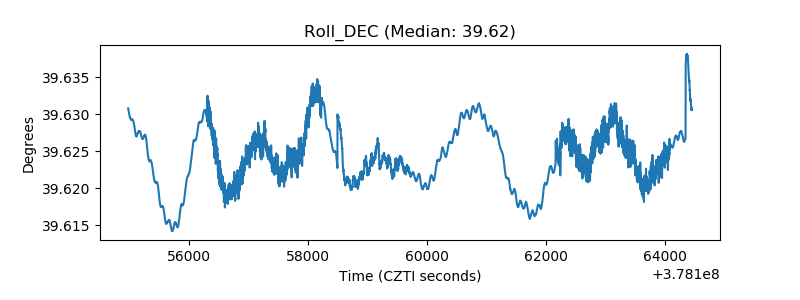 |
| _Roll_RA | 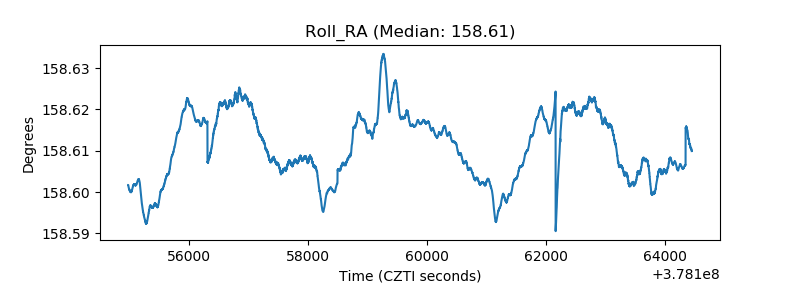 |
| Veto Counter | 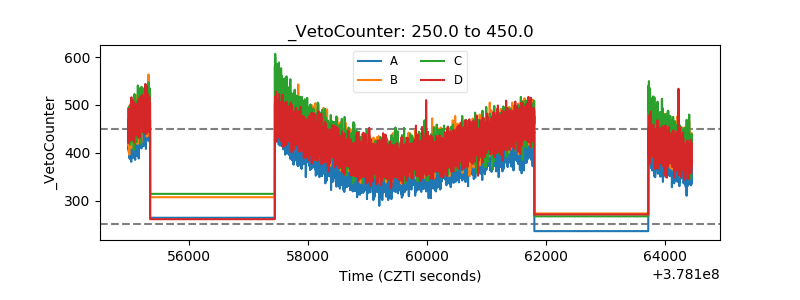 |