| Param | Original file | Final file |
|---|---|---|
| Filename | modeM0/AS1A11_086T01_9000004820_33764cztM0_level2.evt | modeM0/AS1A11_086T01_9000004820_33764cztM0_level2_quad_clean.evt |
| Size (bytes) | 1,127,090,880 | 131,742,720 |
| Size | 1.0 GB | 125.6 MB |
| Events in quadrant A | 10,843,381 | 795,312 |
| Events in quadrant B | 6,476,632 | 825,713 |
| Events in quadrant C | 6,509,145 | 832,461 |
| Events in quadrant D | 9,574,617 | 784,817 |
| Mode M9 | |||
|---|---|---|---|
| Quadrant | BADHDUFLAG | Total packets | Discarded packets |
| A | 0 | 28 | 0 |
| B | 0 | 28 | 0 |
| C | 0 | 28 | 0 |
| D | 0 | 29 | 0 |
| Mode SS | |||
|---|---|---|---|
| Quadrant | BADHDUFLAG | Total packets | Discarded packets |
| A | 0 | 222 | 0 |
| B | 0 | 222 | 0 |
| C | 0 | 222 | 0 |
| D | 0 | 222 | 0 |
| Mode M0 | |||
|---|---|---|---|
| Quadrant | BADHDUFLAG | Total packets | Discarded packets |
| A | 0 | 39478 | 3 |
| B | 0 | 26169 | 2 |
| C | 0 | 26112 | 2 |
| D | 0 | 35948 | 2 |
| Quadrant | Total seconds | Saturated seconds | Saturation percentage |
|---|---|---|---|
| A | 10848 | 1232 | 11.356932% |
| B | 10848 | 380 | 3.502950% |
| C | 10848 | 287 | 2.645649% |
| D | 10848 | 586 | 5.401917% |
Noise dominated data is calculated using 1-second bins in cleaned event files. If a bin has >2000 counts, and if more than 50% of those come from <1% of pixels, then it is considered to be noise-dominated and hence unusable.
| Quadrant | # 1 sec bins | Bins with >0 counts | Bins with >2000 counts | High rate bins dominated by noise | Noise dominated (total time) | Noise dominated (detector-on time) | Marked lightcurve |
|---|---|---|---|---|---|---|---|
| A | 13621 | 10848 | 988 | 988 | 7.25% | 9.11% | 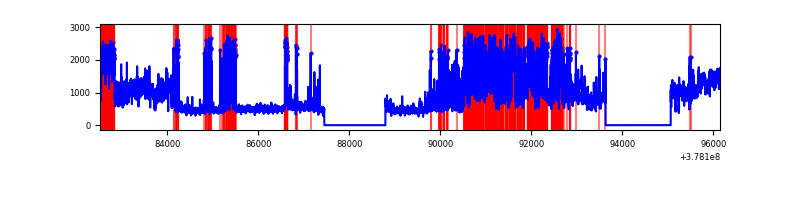 |
| B | 13621 | 10847 | 286 | 286 | 2.10% | 2.64% | 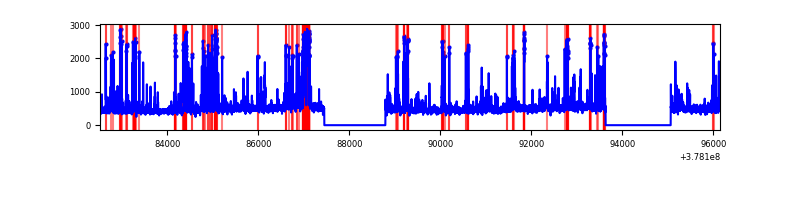 |
| C | 13621 | 10848 | 271 | 271 | 1.99% | 2.50% | 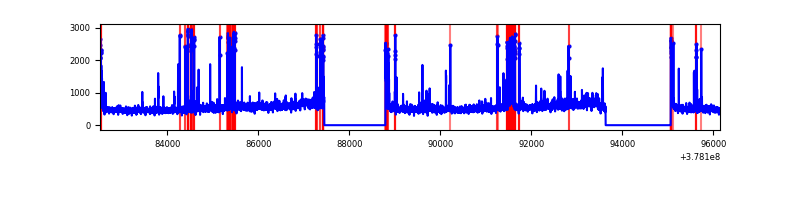 |
| D | 13621 | 10848 | 480 | 480 | 3.52% | 4.42% | 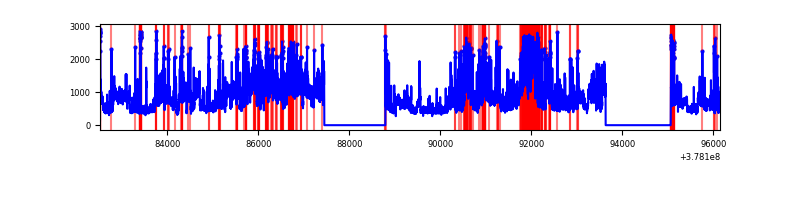 |
Top three noisy pixels from each quadrant. If the there are fewer than three noisy pixels in the level2.evt file, extra rows are filled as -1
| Pixel properties | Quadrant properties | ||||||
|---|---|---|---|---|---|---|---|
| Quadrant | DetID | PixID | Counts | Sigma | Mean | Median | Sigma |
| A | 15 | 169 | 4377951 | 17956.95 | 1215 | 1192 | 243.7 |
| A | 15 | 237 | 1728876 | 7088.34 | 1215 | 1192 | 243.7 |
| A | 13 | 6 | 20574 | 79.52 | 1215 | 1192 | 243.7 |
| B | 5 | 172 | 672362 | 2801.31 | 1246 | 1212 | 239.6 |
| B | 5 | 255 | 644570 | 2685.31 | 1246 | 1212 | 239.6 |
| B | 0 | 190 | 69533 | 285.16 | 1246 | 1212 | 239.6 |
| C | 9 | 187 | 659653 | 2335.22 | 1225 | 1236 | 282.0 |
| C | 15 | 214 | 467906 | 1655.15 | 1225 | 1236 | 282.0 |
| C | 0 | 10 | 175163 | 616.87 | 1225 | 1236 | 282.0 |
| D | 8 | 195 | 2375826 | 7889.98 | 1219 | 1183 | 301.0 |
| D | 2 | 250 | 813897 | 2700.32 | 1219 | 1183 | 301.0 |
| D | 12 | 235 | 463787 | 1537.05 | 1219 | 1183 | 301.0 |
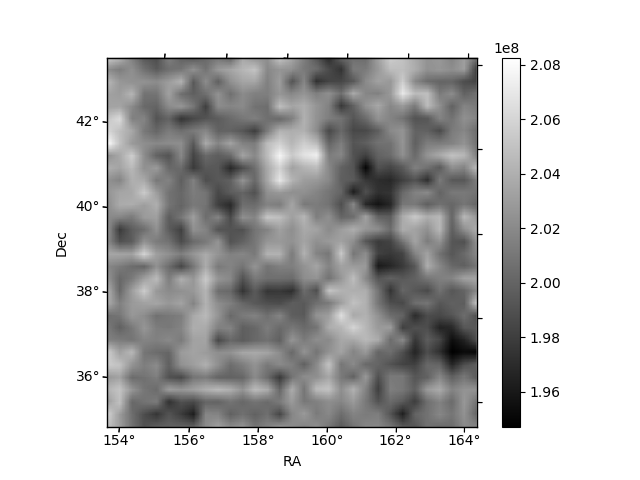
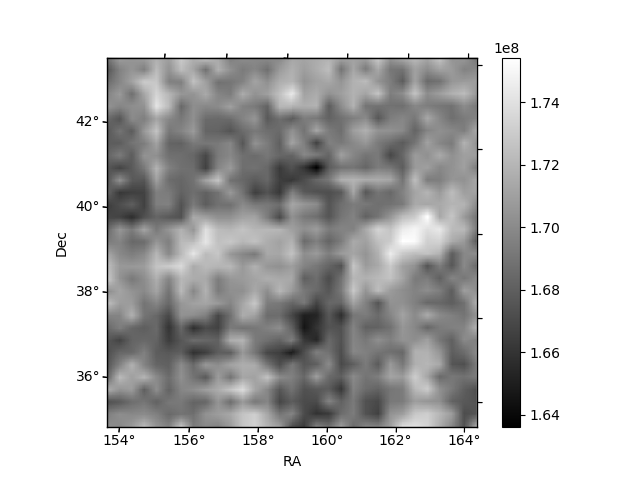
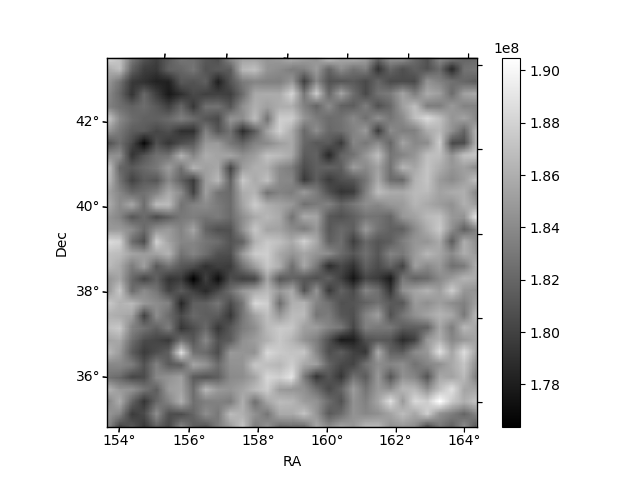
Histogram calculated using DETX and DETY for each event in the final _common_clean file
| Quadrant A | 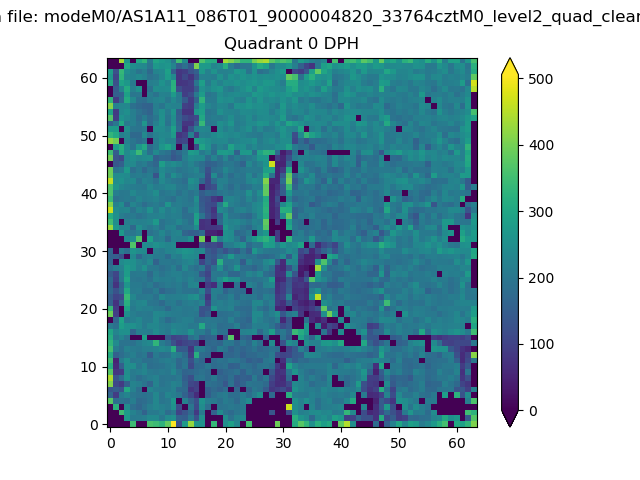 |
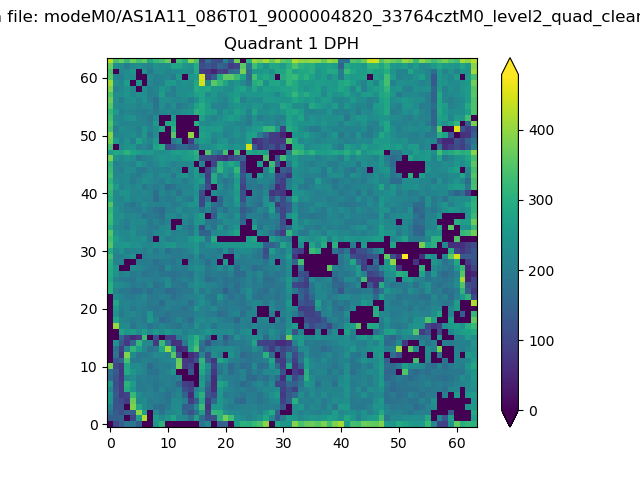 |
Quadrant B |
|---|---|---|---|
| Quadrant D | 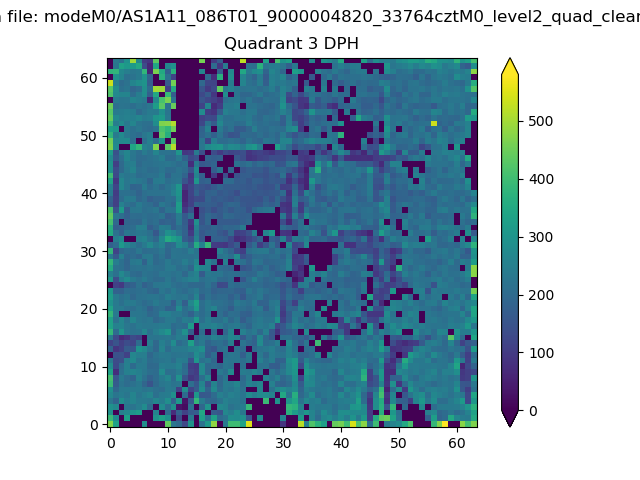 |
 |
Quadrant C |
| Plot type | Count rate plots | Images |
|---|---|---|
| Comparison with Poisson distribution Blue bars denote a histogram of data divided into 1 sec bins. Red curve is a Poisson curve with rate = median count rate of data. |
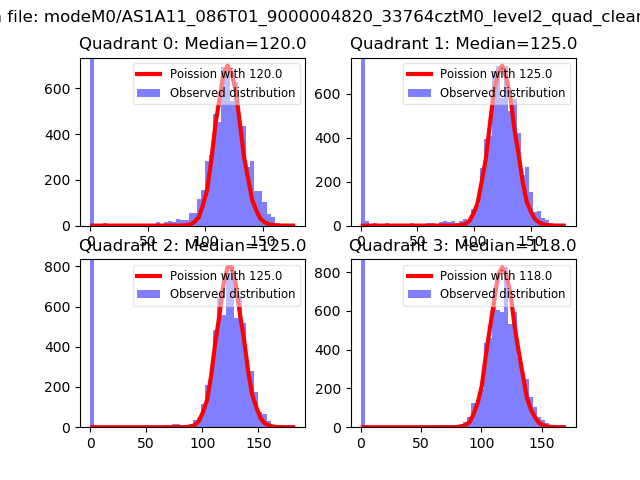 |
 |
| Quadrant-wise count rates Data is divided into 100 sec bins |
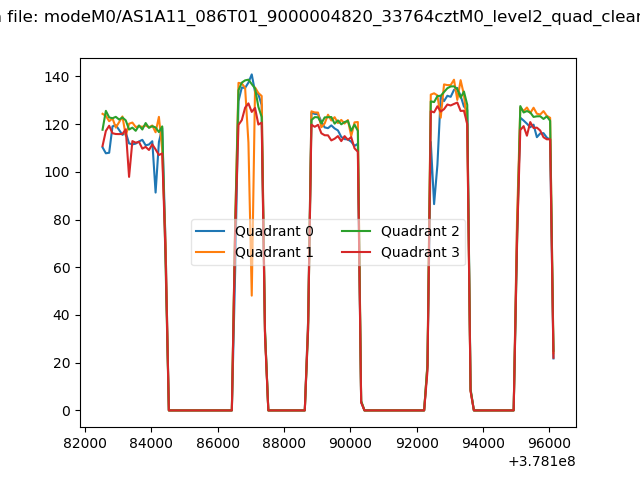 |
|
| Module-wise count rates for Quadrant A Data is divided into 100 sec bins |
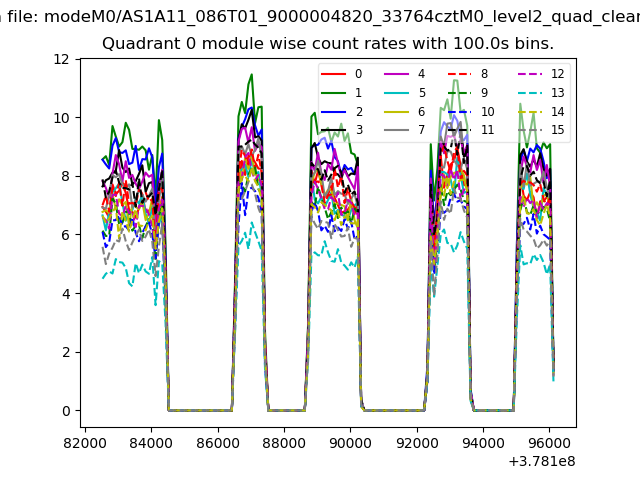 |
 |
| Module-wise count rates for Quadrant B Data is divided into 100 sec bins |
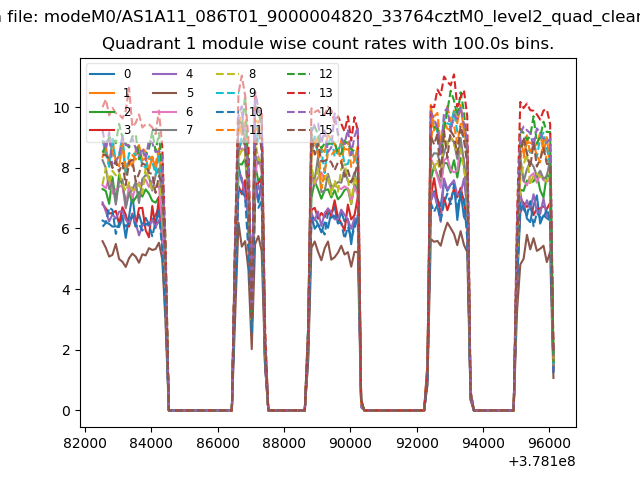 |
 |
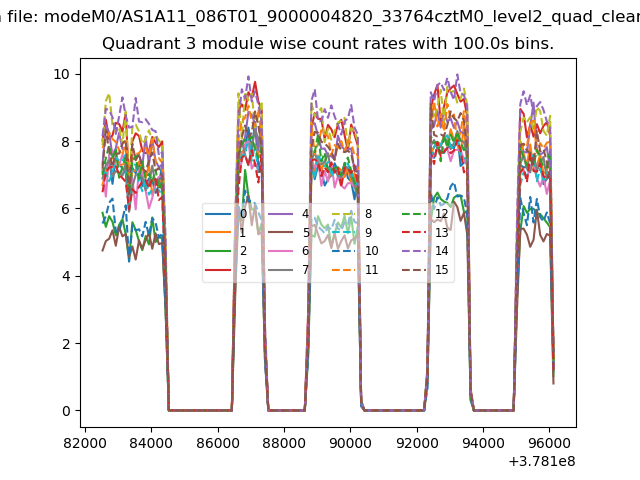
| Module-wise count rates for Quadrant C Data is divided into 100 sec bins |
 |
 |
| Module-wise count rates for Quadrant D Data is divided into 100 sec bins |
 |
 |
| Parameter | Plot |
|---|---|
| CZT HV Monitor | 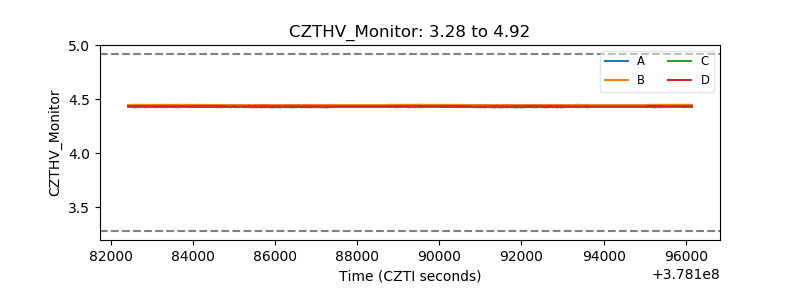 |
| D_VDD | 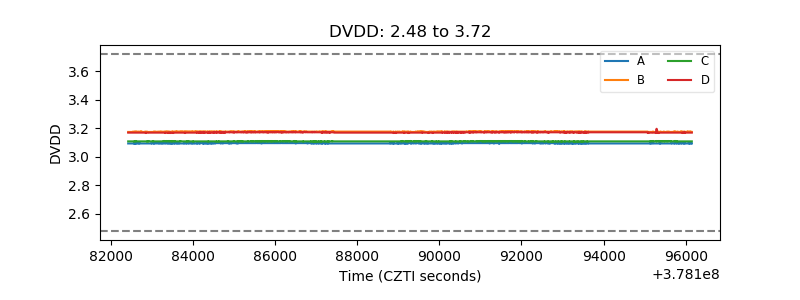 |
| Temperature 1 | 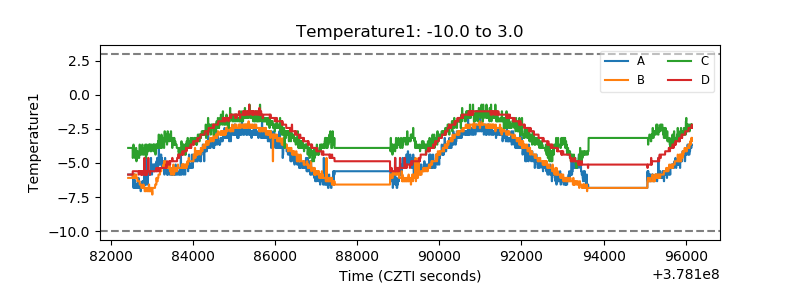 |
| Veto HV Monitor | 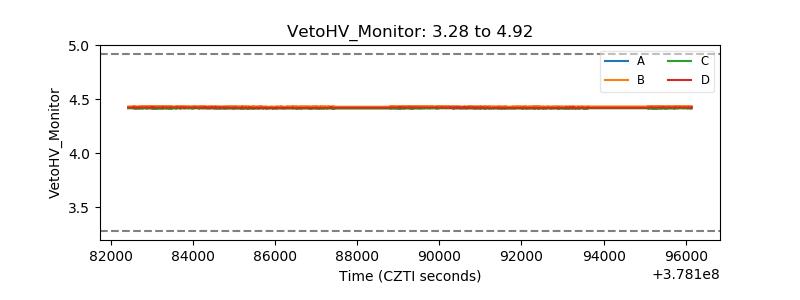 |
| Veto LLD | 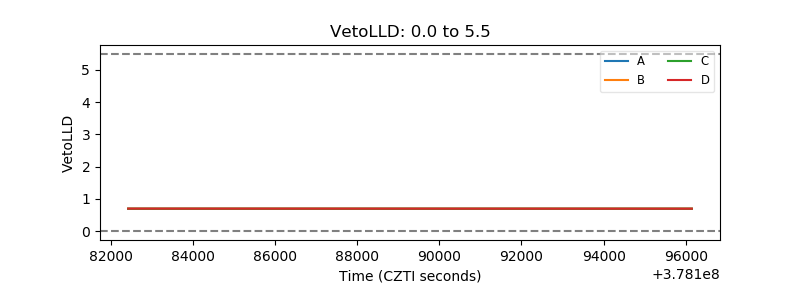 |
| Alpha Counter | 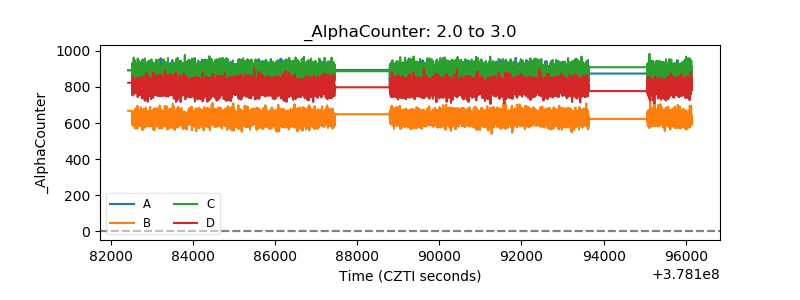 |
| _CPM_Rate | 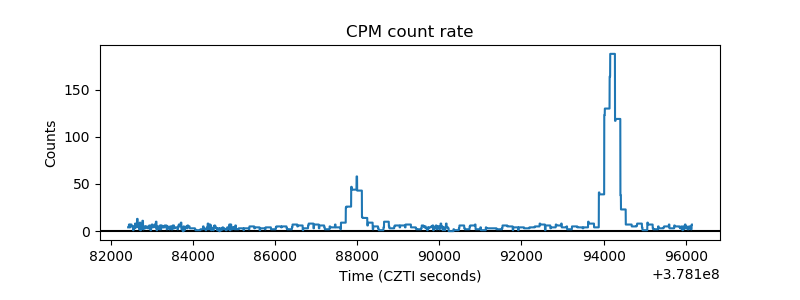 |
| CZT Counter | 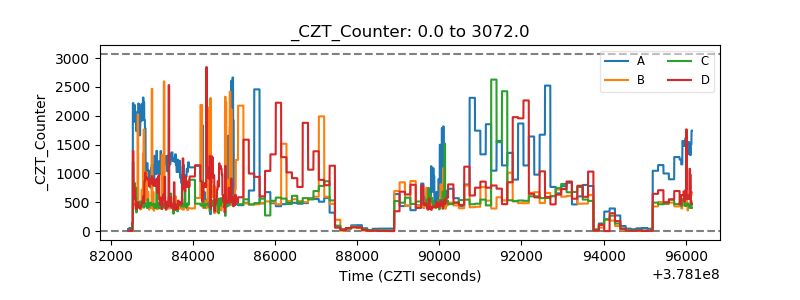 |
| +2.5 Volts monitor |  |
| +5 Volts monitor |  |
| _ROLL_ROT | 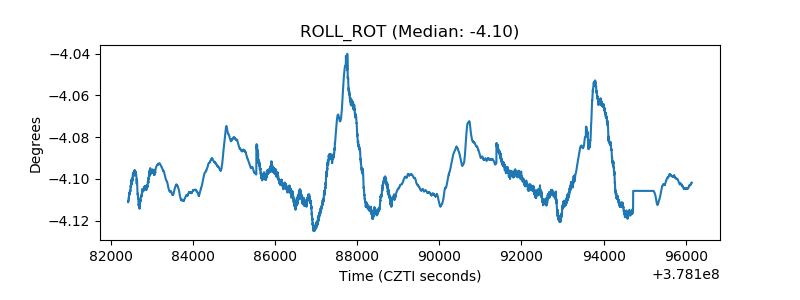 |
| _Roll_DEC | 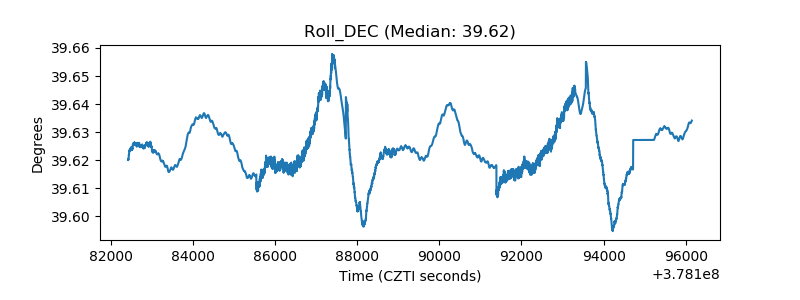 |
| _Roll_RA | 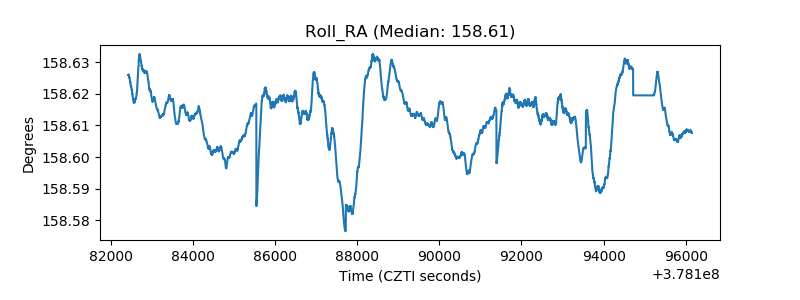 |
| Veto Counter | 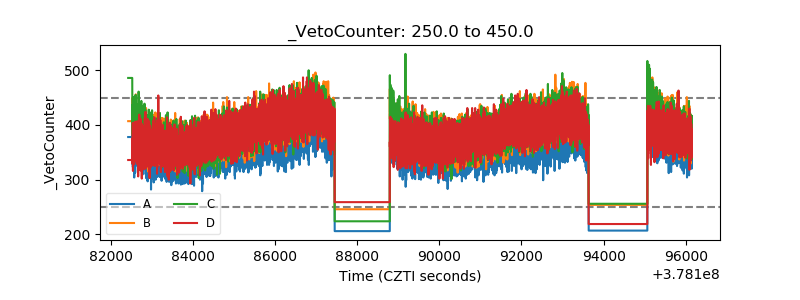 |