| Param | Original file | Final file |
|---|---|---|
| Filename | modeM0/AS1A11_086T01_9000004820_33765cztM0_level2.evt | modeM0/AS1A11_086T01_9000004820_33765cztM0_level2_quad_clean.evt |
| Size (bytes) | 2,655,682,560 | 291,847,680 |
| Size | 2.5 GB | 278.3 MB |
| Events in quadrant A | 25,839,026 | 1,738,439 |
| Events in quadrant B | 15,405,084 | 1,817,205 |
| Events in quadrant C | 15,237,680 | 1,822,400 |
| Events in quadrant D | 22,244,729 | 1,716,887 |
| Mode M9 | |||
|---|---|---|---|
| Quadrant | BADHDUFLAG | Total packets | Discarded packets |
| A | 0 | 71 | 0 |
| B | 0 | 71 | 0 |
| C | 0 | 71 | 0 |
| D | 0 | 72 | 0 |
| Mode SS | |||
|---|---|---|---|
| Quadrant | BADHDUFLAG | Total packets | Discarded packets |
| A | 0 | 514 | 0 |
| B | 0 | 514 | 0 |
| C | 0 | 514 | 0 |
| D | 0 | 514 | 0 |
| Mode M0 | |||
|---|---|---|---|
| Quadrant | BADHDUFLAG | Total packets | Discarded packets |
| A | 0 | 93657 | 6 |
| B | 0 | 62090 | 5 |
| C | 0 | 61389 | 5 |
| D | 0 | 83766 | 5 |
| Quadrant | Total seconds | Saturated seconds | Saturation percentage |
|---|---|---|---|
| A | 25354 | 3945 | 15.559675% |
| B | 25354 | 856 | 3.376193% |
| C | 25354 | 560 | 2.208724% |
| D | 25354 | 1335 | 5.265441% |
Noise dominated data is calculated using 1-second bins in cleaned event files. If a bin has >2000 counts, and if more than 50% of those come from <1% of pixels, then it is considered to be noise-dominated and hence unusable.
| Quadrant | # 1 sec bins | Bins with >0 counts | Bins with >2000 counts | High rate bins dominated by noise | Noise dominated (total time) | Noise dominated (detector-on time) | Marked lightcurve |
|---|---|---|---|---|---|---|---|
| A | 32335 | 25356 | 3221 | 3221 | 9.96% | 12.70% | 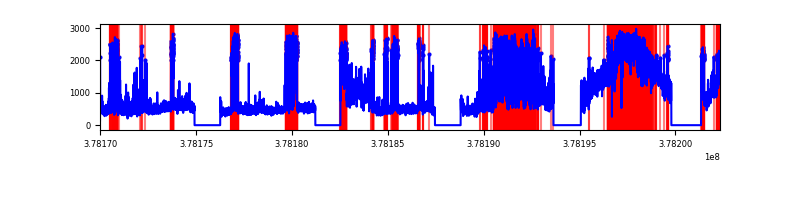 |
| B | 32335 | 25354 | 604 | 604 | 1.87% | 2.38% | 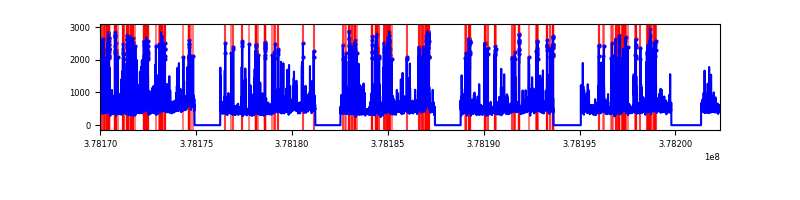 |
| C | 32335 | 25356 | 487 | 487 | 1.51% | 1.92% | 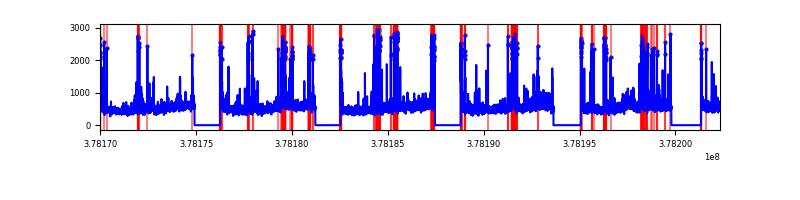 |
| D | 32335 | 25356 | 1120 | 1120 | 3.46% | 4.42% | 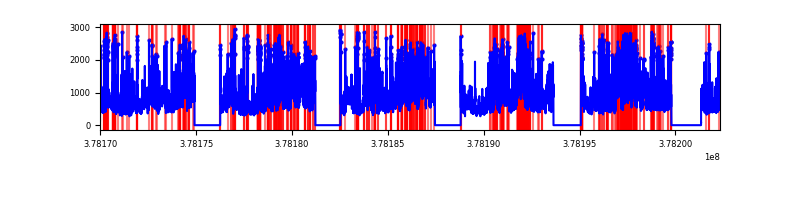 |
Top three noisy pixels from each quadrant. If the there are fewer than three noisy pixels in the level2.evt file, extra rows are filled as -1
| Pixel properties | Quadrant properties | ||||||
|---|---|---|---|---|---|---|---|
| Quadrant | DetID | PixID | Counts | Sigma | Mean | Median | Sigma |
| A | 15 | 169 | 11575730 | 21152.98 | 2772 | 2719 | 547.1 |
| A | 15 | 237 | 3347787 | 6114.07 | 2772 | 2719 | 547.1 |
| A | 7 | 16 | 131902 | 236.12 | 2772 | 2719 | 547.1 |
| B | 5 | 172 | 2069222 | 3717.77 | 2925 | 2845 | 555.8 |
| B | 5 | 255 | 783317 | 1404.2 | 2925 | 2845 | 555.8 |
| B | 0 | 190 | 275884 | 491.24 | 2925 | 2845 | 555.8 |
| C | 9 | 187 | 1509434 | 2280.7 | 2878 | 2900 | 660.6 |
| C | 15 | 214 | 1090714 | 1646.81 | 2878 | 2900 | 660.6 |
| C | 0 | 10 | 386859 | 581.26 | 2878 | 2900 | 660.6 |
| D | 8 | 195 | 5352854 | 7616.99 | 2860 | 2779 | 702.4 |
| D | 2 | 250 | 1655773 | 2353.39 | 2860 | 2779 | 702.4 |
| D | 2 | 249 | 1086632 | 1543.1 | 2860 | 2779 | 702.4 |
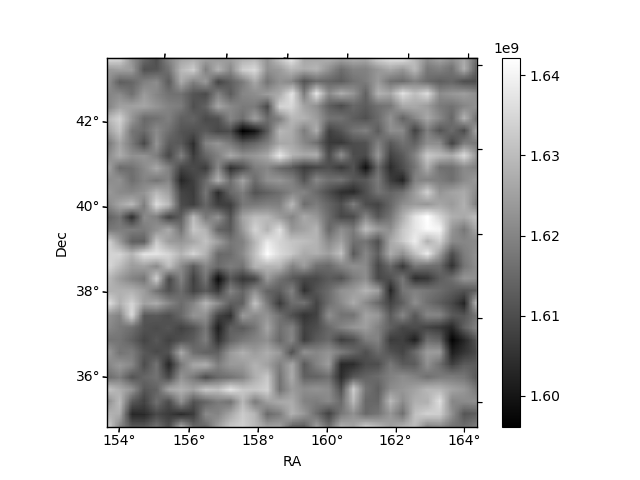
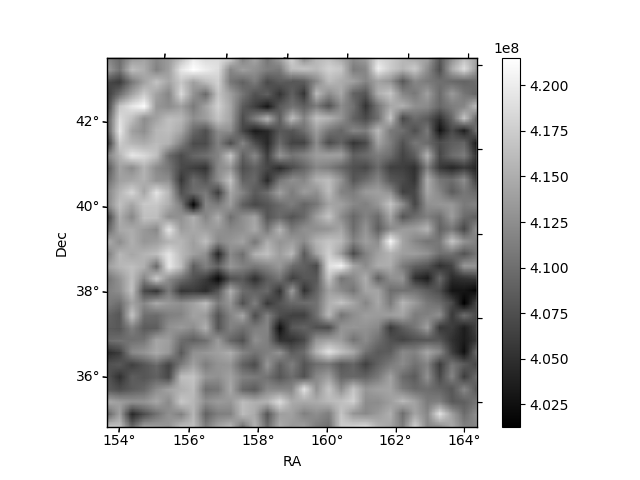
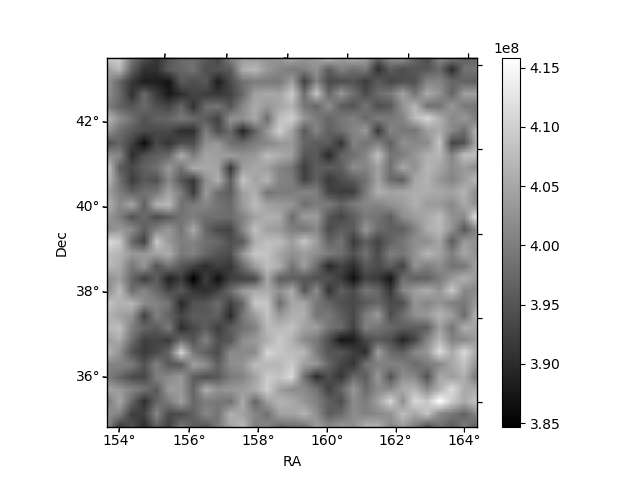
Histogram calculated using DETX and DETY for each event in the final _common_clean file
| Quadrant A | 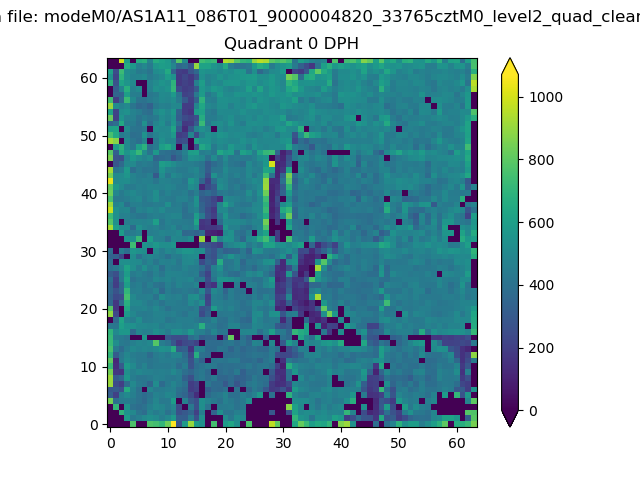 |
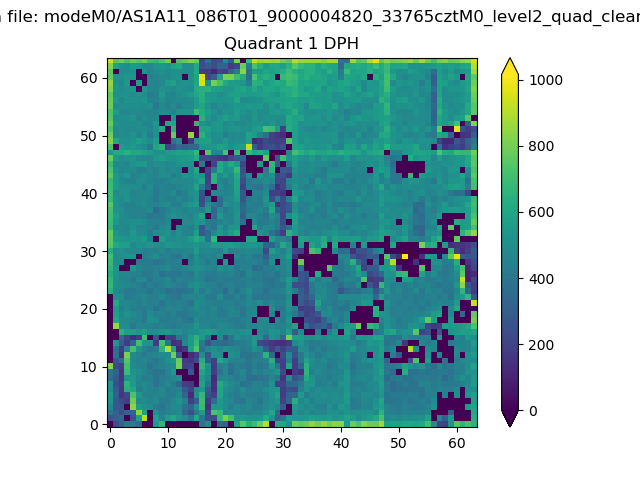 |
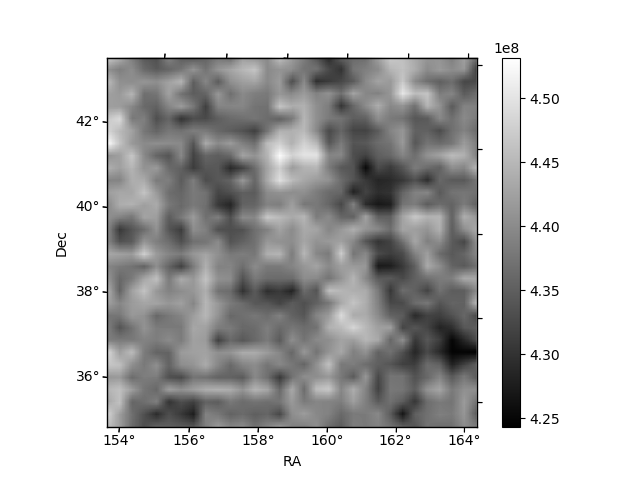
Quadrant B |
|---|---|---|---|
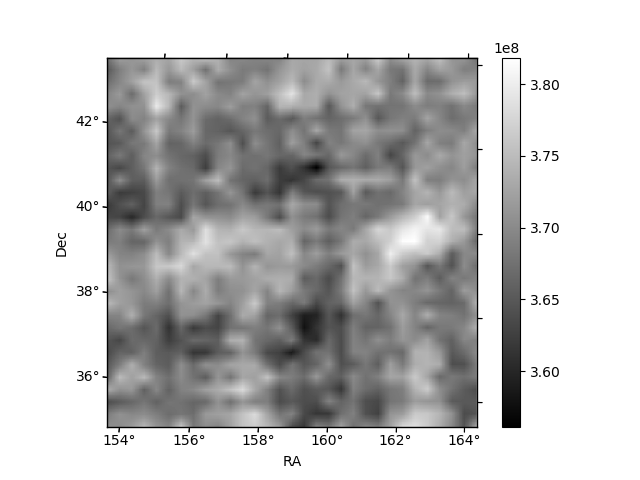
| Quadrant D | 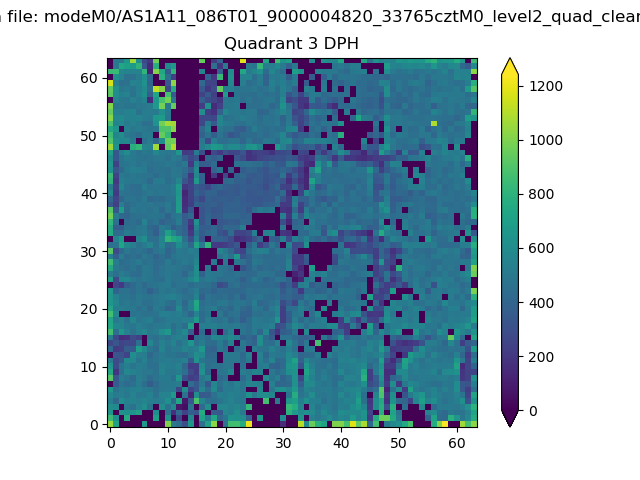 |
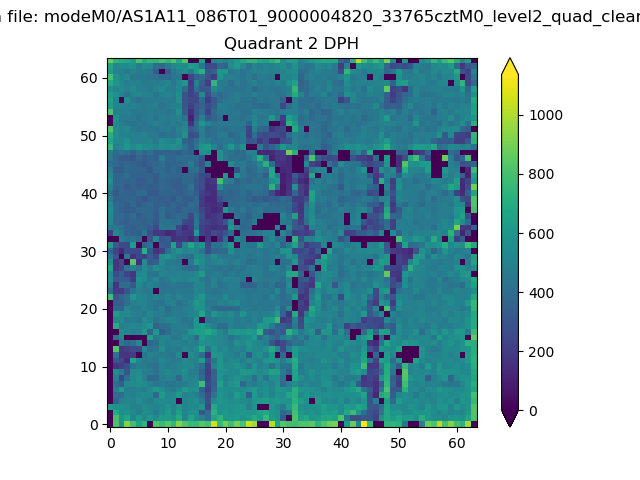 |
Quadrant C |
| Plot type | Count rate plots | Images |
|---|---|---|
| Comparison with Poisson distribution Blue bars denote a histogram of data divided into 1 sec bins. Red curve is a Poisson curve with rate = median count rate of data. |
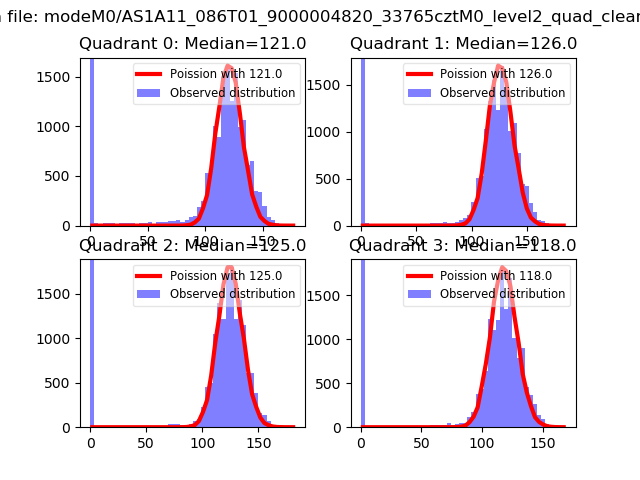 |
 |
| Quadrant-wise count rates Data is divided into 100 sec bins |
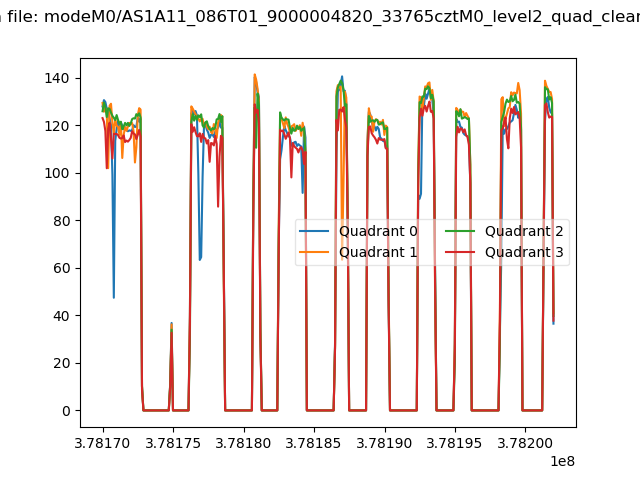 |
|
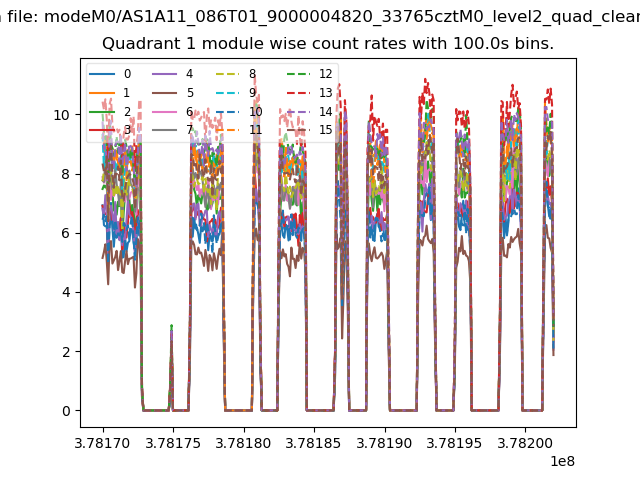
| Module-wise count rates for Quadrant A Data is divided into 100 sec bins |
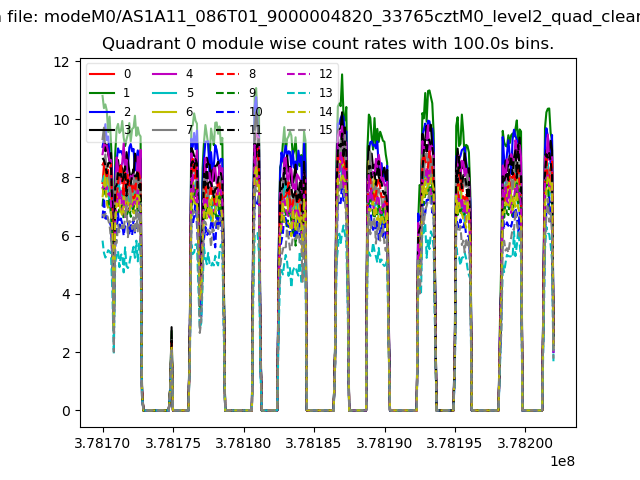 |
 |
| Module-wise count rates for Quadrant B Data is divided into 100 sec bins |
 |
 |
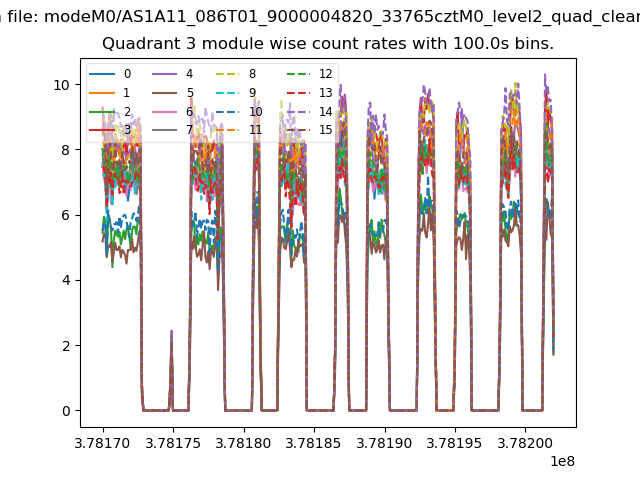
| Module-wise count rates for Quadrant C Data is divided into 100 sec bins |
 |
 |
| Module-wise count rates for Quadrant D Data is divided into 100 sec bins |
 |
 |
| Parameter | Plot |
|---|---|
| CZT HV Monitor | 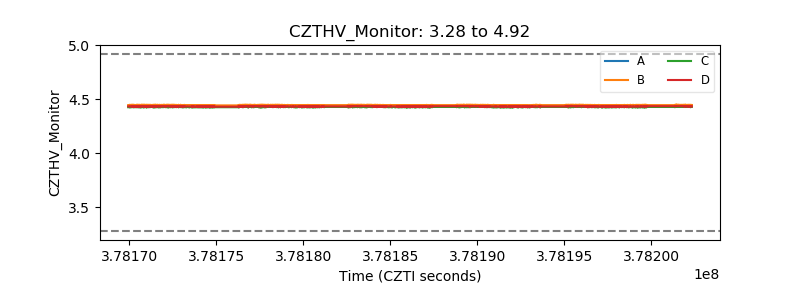 |
| D_VDD | 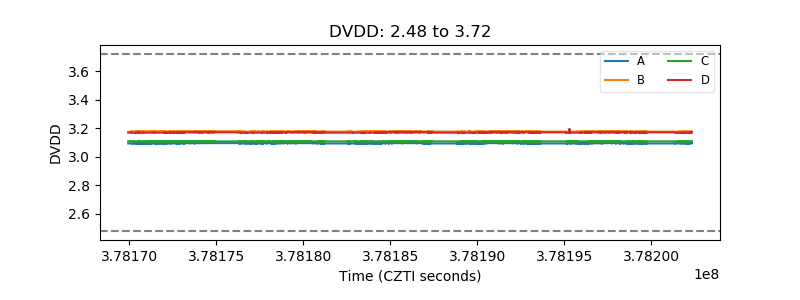 |
| Temperature 1 | 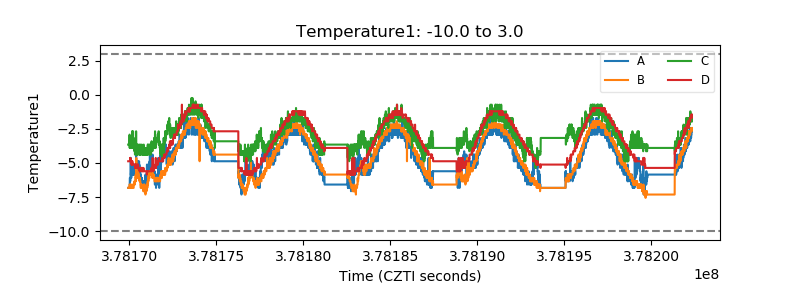 |
| Veto HV Monitor | 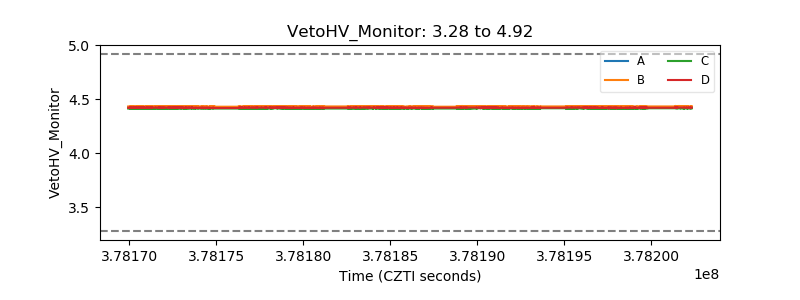 |
| Veto LLD | 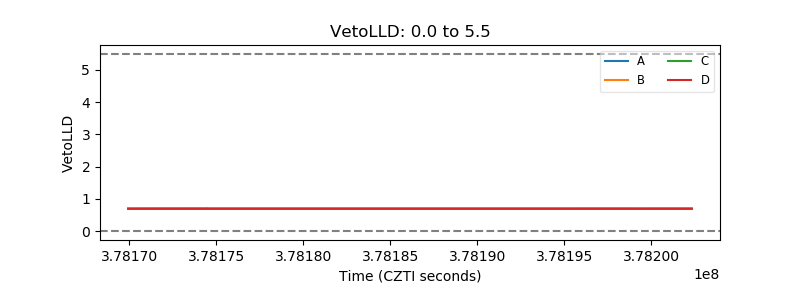 |
| Alpha Counter | 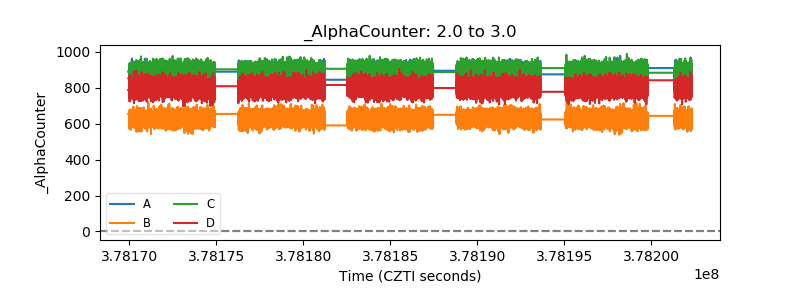 |
| _CPM_Rate |  |
| CZT Counter | 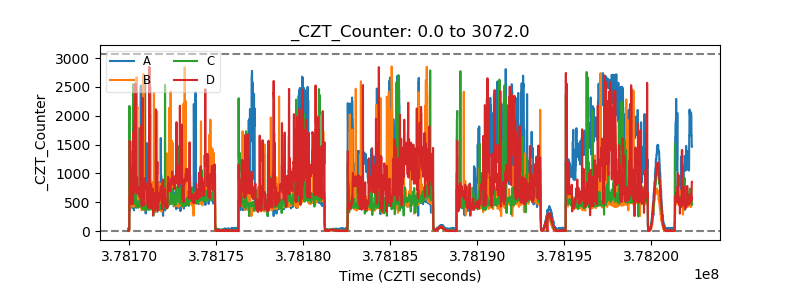 |
| +2.5 Volts monitor |  |
| +5 Volts monitor |  |
| _ROLL_ROT | 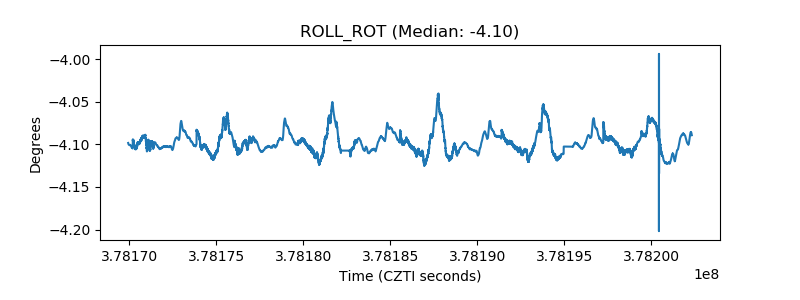 |
| _Roll_DEC | 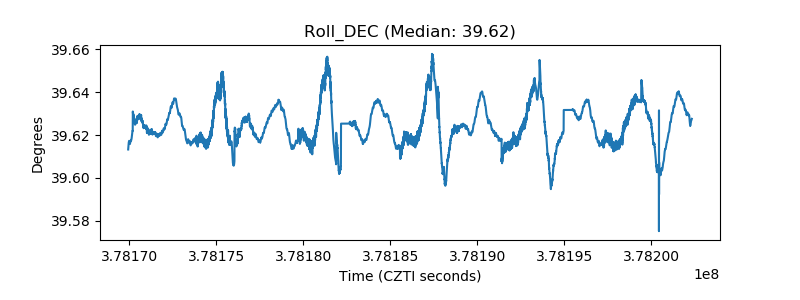 |
| _Roll_RA | 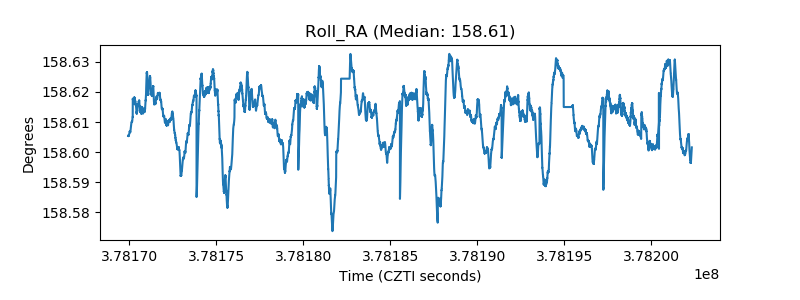 |
| Veto Counter | 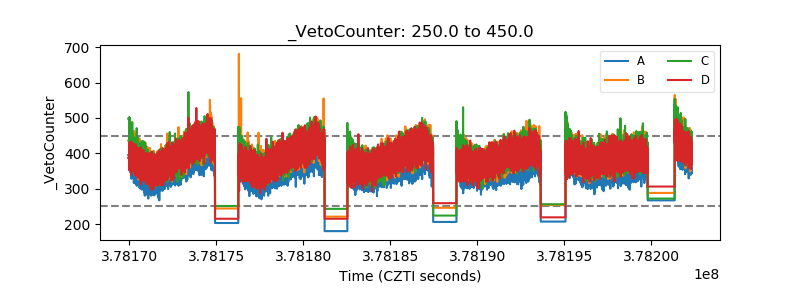 |