| Param | Original file | Final file |
|---|---|---|
| Filename | modeM0/AS1A11_086T01_9000004820_33766cztM0_level2.evt | modeM0/AS1A11_086T01_9000004820_33766cztM0_level2_quad_clean.evt |
| Size (bytes) | 646,476,480 | 58,783,680 |
| Size | 616.5 MB | 56.1 MB |
| Events in quadrant A | 8,538,716 | 326,676 |
| Events in quadrant B | 2,987,054 | 367,941 |
| Events in quadrant C | 3,156,819 | 362,986 |
| Events in quadrant D | 4,528,377 | 340,666 |
| Mode M9 | |||
|---|---|---|---|
| Quadrant | BADHDUFLAG | Total packets | Discarded packets |
| A | 0 | 21 | 0 |
| B | 0 | 21 | 0 |
| C | 0 | 21 | 0 |
| D | 0 | 22 | 0 |
| Mode SS | |||
|---|---|---|---|
| Quadrant | BADHDUFLAG | Total packets | Discarded packets |
| A | 0 | 110 | 0 |
| B | 0 | 110 | 0 |
| C | 0 | 110 | 0 |
| D | 0 | 110 | 0 |
| Mode M0 | |||
|---|---|---|---|
| Quadrant | BADHDUFLAG | Total packets | Discarded packets |
| A | 0 | 29215 | 3 |
| B | 0 | 12182 | 2 |
| C | 0 | 12426 | 2 |
| D | 0 | 17052 | 2 |
| Quadrant | Total seconds | Saturated seconds | Saturation percentage |
|---|---|---|---|
| A | 5448 | 1830 | 33.590308% |
| B | 5448 | 60 | 1.101322% |
| C | 5448 | 42 | 0.770925% |
| D | 5448 | 207 | 3.799559% |
Noise dominated data is calculated using 1-second bins in cleaned event files. If a bin has >2000 counts, and if more than 50% of those come from <1% of pixels, then it is considered to be noise-dominated and hence unusable.
| Quadrant | # 1 sec bins | Bins with >0 counts | Bins with >2000 counts | High rate bins dominated by noise | Noise dominated (total time) | Noise dominated (detector-on time) | Marked lightcurve |
|---|---|---|---|---|---|---|---|
| A | 7150 | 5449 | 1493 | 1493 | 20.88% | 27.40% | 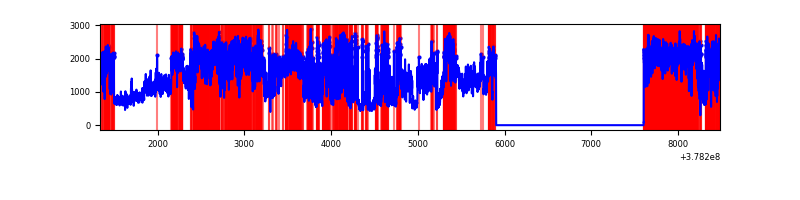 |
| B | 7150 | 5449 | 41 | 41 | 0.57% | 0.75% | 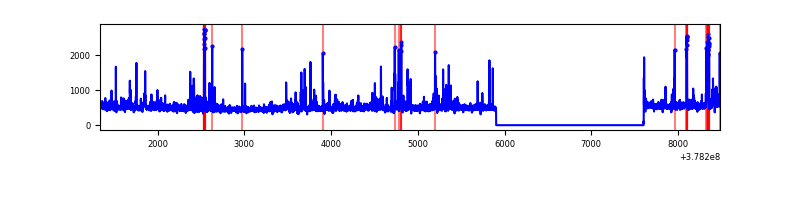 |
| C | 7150 | 5449 | 41 | 41 | 0.57% | 0.75% | 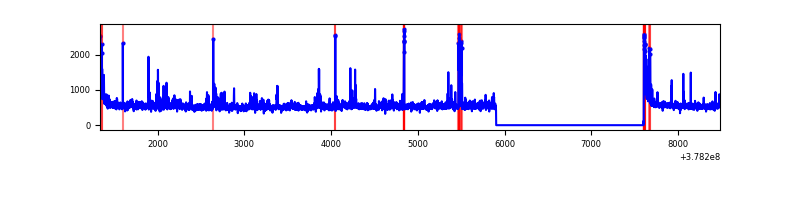 |
| D | 7150 | 5449 | 206 | 206 | 2.88% | 3.78% | 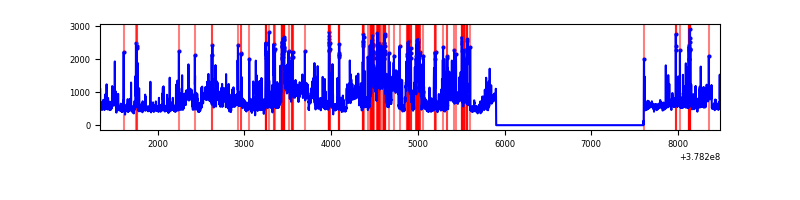 |
Top three noisy pixels from each quadrant. If the there are fewer than three noisy pixels in the level2.evt file, extra rows are filled as -1
| Pixel properties | Quadrant properties | ||||||
|---|---|---|---|---|---|---|---|
| Quadrant | DetID | PixID | Counts | Sigma | Mean | Median | Sigma |
| A | 15 | 169 | 4455256 | 37050.95 | 594 | 581 | 120.2 |
| A | 15 | 237 | 1757893 | 14616.12 | 594 | 581 | 120.2 |
| A | 13 | 6 | 15742 | 126.1 | 594 | 581 | 120.2 |
| B | 5 | 172 | 206716 | 1630.65 | 652 | 636 | 126.4 |
| B | 0 | 219 | 42239 | 329.19 | 652 | 636 | 126.4 |
| B | 5 | 255 | 38381 | 298.66 | 652 | 636 | 126.4 |
| C | 15 | 214 | 239099 | 1619.49 | 638 | 642 | 147.2 |
| C | 0 | 10 | 129101 | 872.43 | 638 | 642 | 147.2 |
| C | 9 | 187 | 97201 | 655.78 | 638 | 642 | 147.2 |
| D | 8 | 195 | 969598 | 6219.23 | 634 | 615 | 155.8 |
| D | 2 | 249 | 431740 | 2767.09 | 634 | 615 | 155.8 |
| D | 1 | 47 | 209152 | 1338.45 | 634 | 615 | 155.8 |
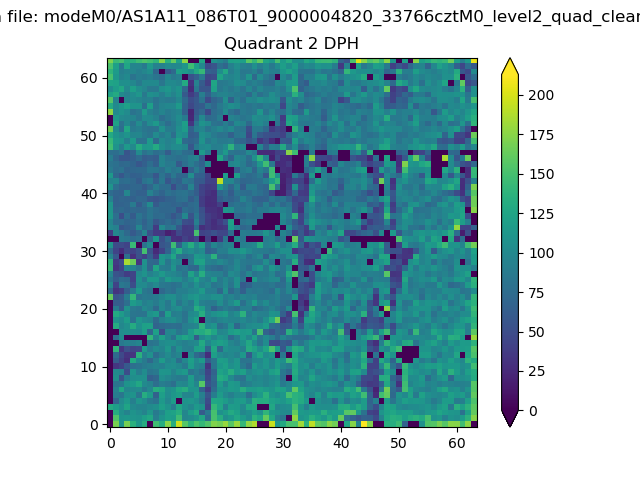
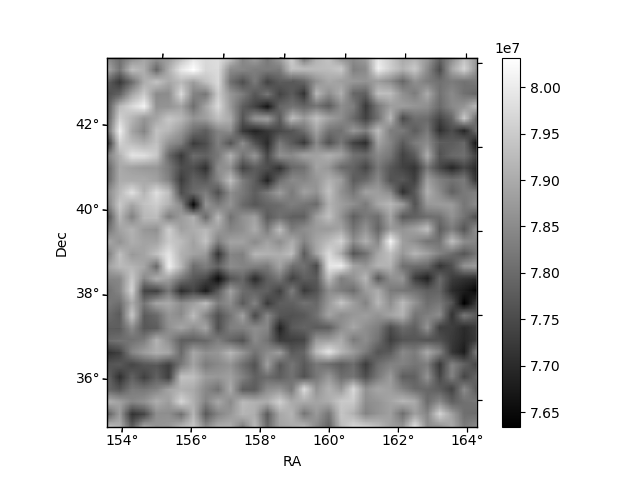
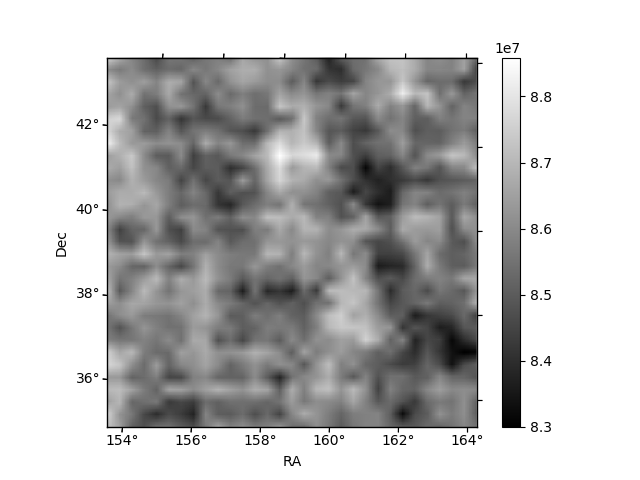
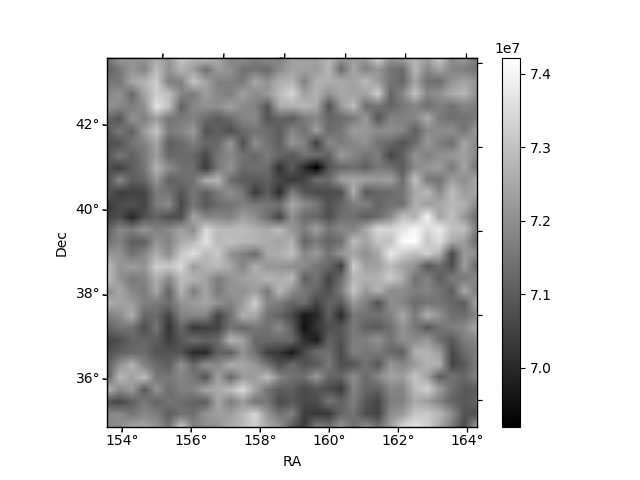
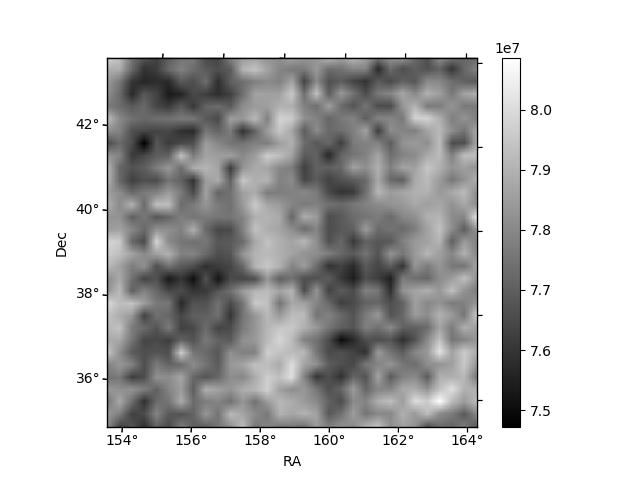
Histogram calculated using DETX and DETY for each event in the final _common_clean file
| Quadrant A |  |
 |
Quadrant B |
|---|---|---|---|
| Quadrant D | 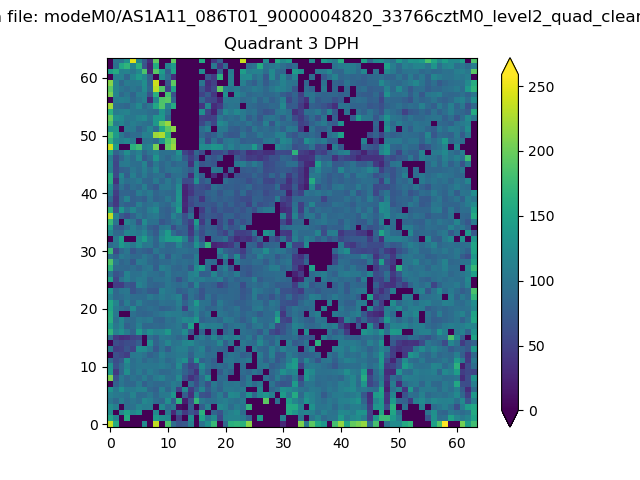 |
 |
Quadrant C |
| Plot type | Count rate plots | Images |
|---|---|---|
| Comparison with Poisson distribution Blue bars denote a histogram of data divided into 1 sec bins. Red curve is a Poisson curve with rate = median count rate of data. |
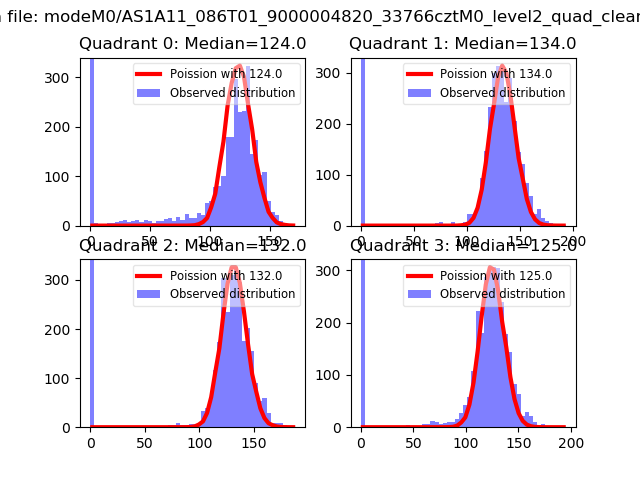 |
 |
| Quadrant-wise count rates Data is divided into 100 sec bins |
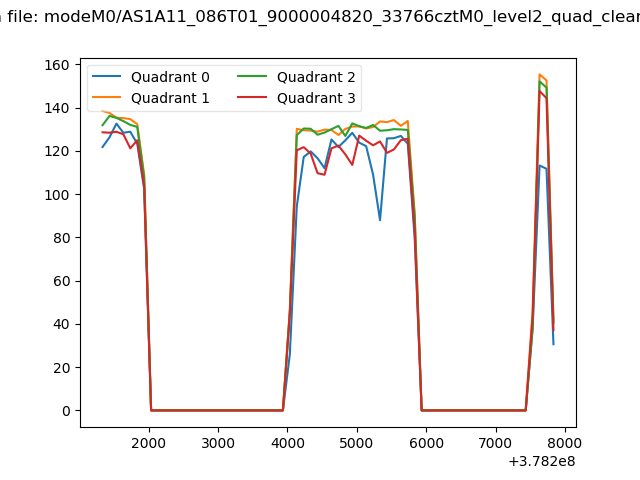 |
|
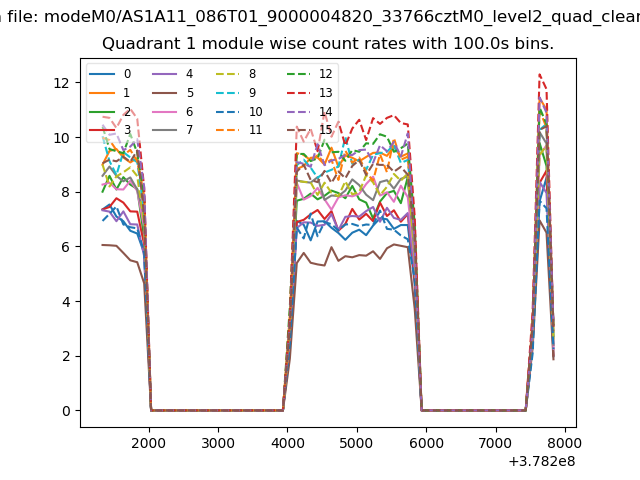
| Module-wise count rates for Quadrant A Data is divided into 100 sec bins |
 |
 |
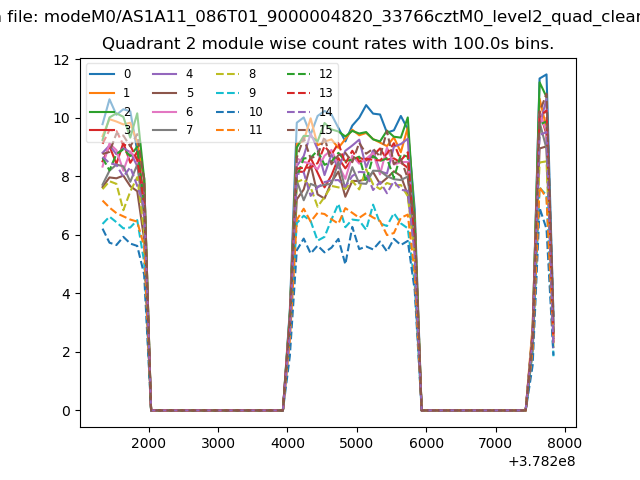
| Module-wise count rates for Quadrant B Data is divided into 100 sec bins |
 |
 |
| Module-wise count rates for Quadrant C Data is divided into 100 sec bins |
 |
 |
| Module-wise count rates for Quadrant D Data is divided into 100 sec bins |
 |
 |
| Parameter | Plot |
|---|---|
| CZT HV Monitor | 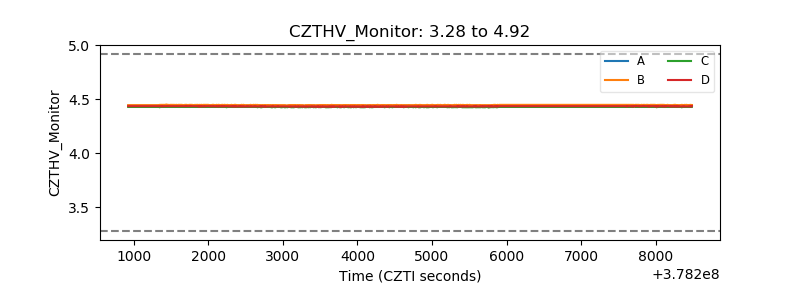 |
| D_VDD | 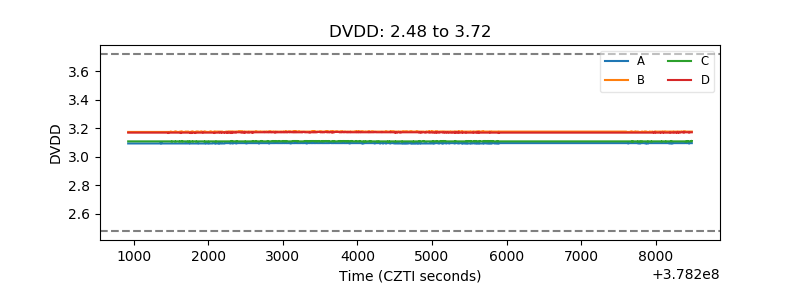 |
| Temperature 1 | 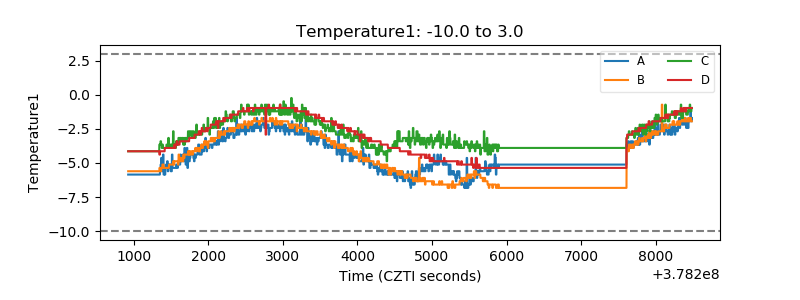 |
| Veto HV Monitor |  |
| Veto LLD | 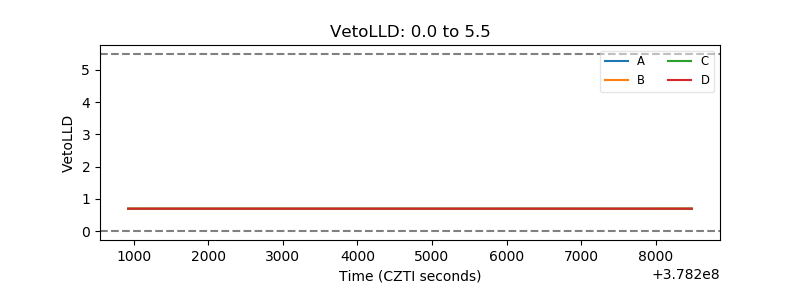 |
| Alpha Counter | 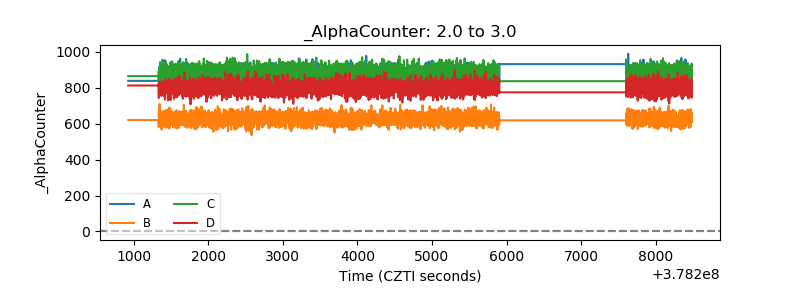 |
| _CPM_Rate | 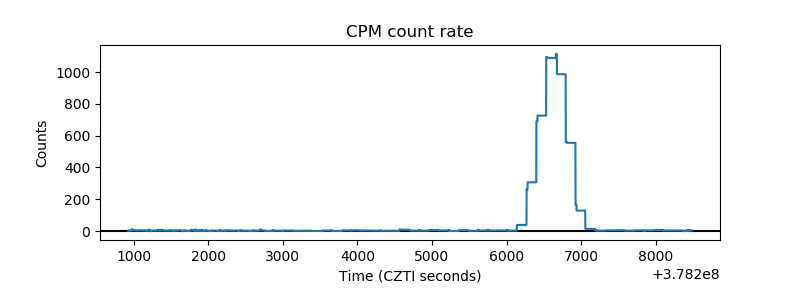 |
| CZT Counter | 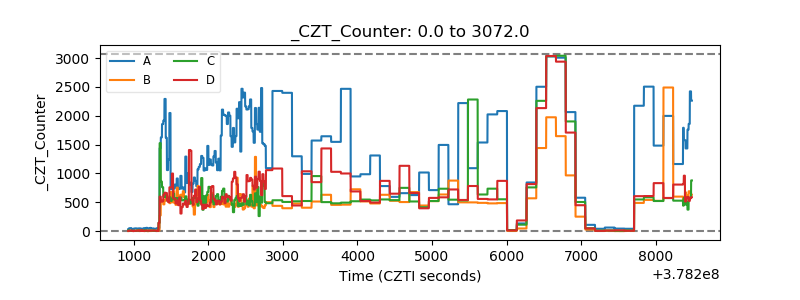 |
| +2.5 Volts monitor |  |
| +5 Volts monitor | 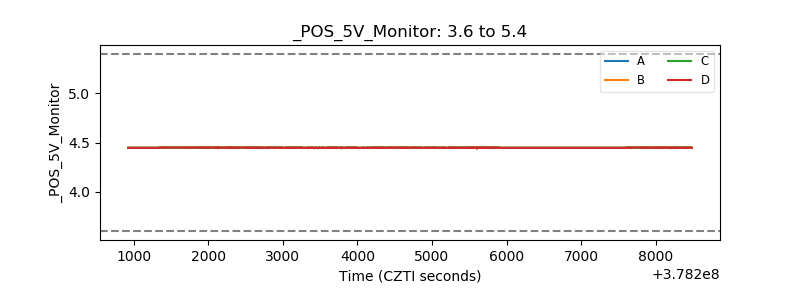 |
| _ROLL_ROT | 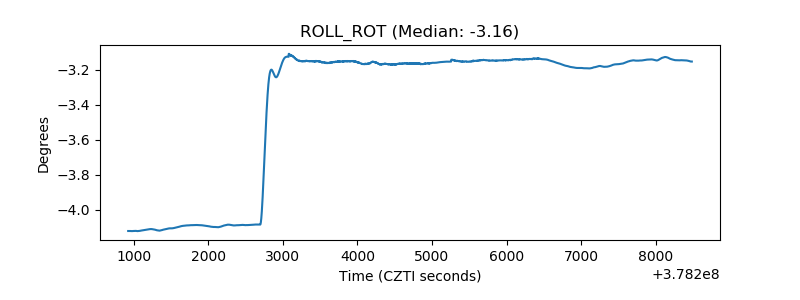 |
| _Roll_DEC | 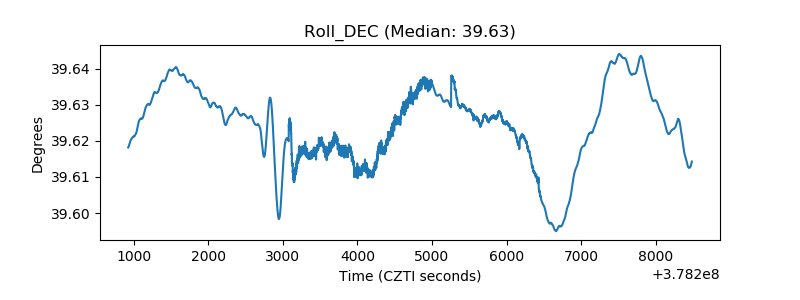 |
| _Roll_RA | 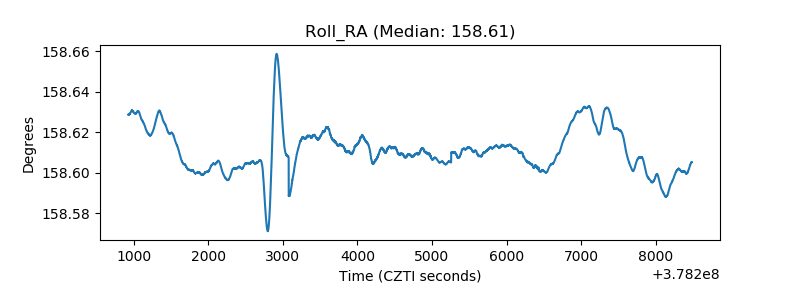 |
| Veto Counter | 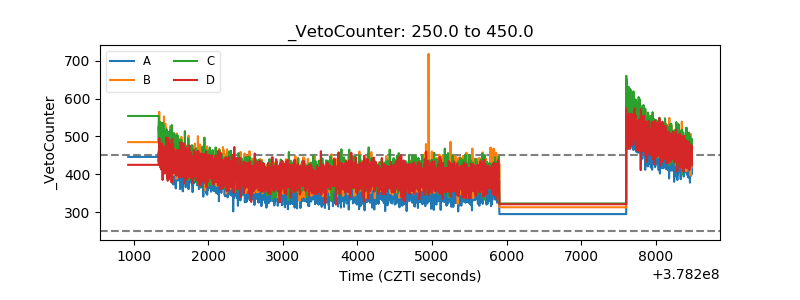 |