| Param | Original file | Final file |
|---|---|---|
| Filename | modeM0/AS1A11_086T01_9000004820_33768cztM0_level2.evt | modeM0/AS1A11_086T01_9000004820_33768cztM0_level2_quad_clean.evt |
| Size (bytes) | 765,250,560 | 51,001,920 |
| Size | 729.8 MB | 48.6 MB |
| Events in quadrant A | 10,078,559 | 239,987 |
| Events in quadrant B | 3,805,895 | 308,155 |
| Events in quadrant C | 3,114,720 | 317,191 |
| Events in quadrant D | 5,809,529 | 296,639 |
| Mode M9 | |||
|---|---|---|---|
| Quadrant | BADHDUFLAG | Total packets | Discarded packets |
| A | 0 | 27 | 0 |
| B | 0 | 27 | 0 |
| C | 0 | 27 | 0 |
| D | 0 | 28 | 0 |
| Mode SS | |||
|---|---|---|---|
| Quadrant | BADHDUFLAG | Total packets | Discarded packets |
| A | 0 | 112 | 0 |
| B | 0 | 112 | 0 |
| C | 0 | 112 | 0 |
| D | 0 | 112 | 0 |
| Mode M0 | |||
|---|---|---|---|
| Quadrant | BADHDUFLAG | Total packets | Discarded packets |
| A | 0 | 33738 | 3 |
| B | 0 | 14848 | 2 |
| C | 0 | 12362 | 2 |
| D | 0 | 21109 | 2 |
| Quadrant | Total seconds | Saturated seconds | Saturation percentage |
|---|---|---|---|
| A | 5444 | 2870 | 52.718589% |
| B | 5444 | 270 | 4.959589% |
| C | 5444 | 33 | 0.606172% |
| D | 5444 | 429 | 7.880235% |
Noise dominated data is calculated using 1-second bins in cleaned event files. If a bin has >2000 counts, and if more than 50% of those come from <1% of pixels, then it is considered to be noise-dominated and hence unusable.
| Quadrant | # 1 sec bins | Bins with >0 counts | Bins with >2000 counts | High rate bins dominated by noise | Noise dominated (total time) | Noise dominated (detector-on time) | Marked lightcurve |
|---|---|---|---|---|---|---|---|
| A | 7238 | 5445 | 2612 | 2612 | 36.09% | 47.97% | 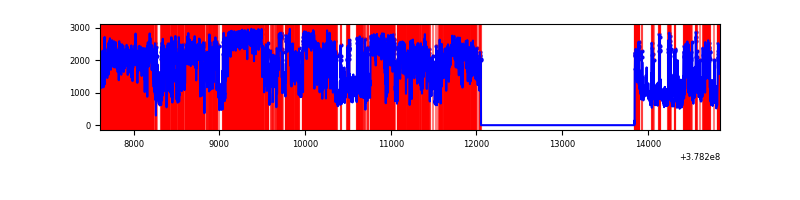 |
| B | 7238 | 5445 | 197 | 197 | 2.72% | 3.62% | 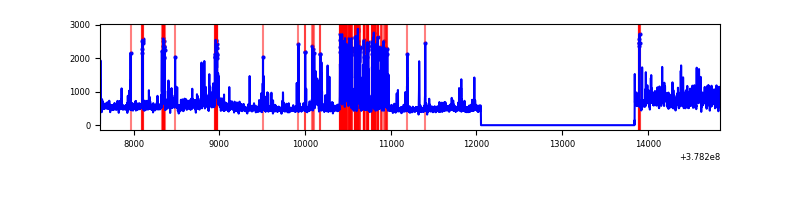 |
| C | 7238 | 5445 | 27 | 27 | 0.37% | 0.50% | 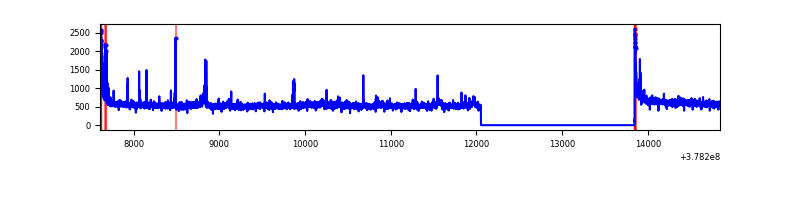 |
| D | 7238 | 5445 | 456 | 456 | 6.30% | 8.37% | 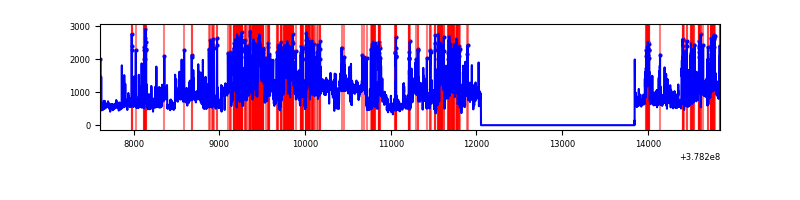 |
Top three noisy pixels from each quadrant. If the there are fewer than three noisy pixels in the level2.evt file, extra rows are filled as -1
| Pixel properties | Quadrant properties | ||||||
|---|---|---|---|---|---|---|---|
| Quadrant | DetID | PixID | Counts | Sigma | Mean | Median | Sigma |
| A | 15 | 169 | 6210773 | 57317.8 | 543 | 534 | 108.3 |
| A | 15 | 237 | 1735993 | 16017.53 | 543 | 534 | 108.3 |
| A | 13 | 6 | 18250 | 163.51 | 543 | 534 | 108.3 |
| B | 5 | 172 | 644382 | 5090.66 | 666 | 650 | 126.5 |
| B | 0 | 189 | 171496 | 1351.06 | 666 | 650 | 126.5 |
| B | 5 | 255 | 147991 | 1165.18 | 666 | 650 | 126.5 |
| C | 15 | 214 | 239140 | 1568.45 | 664 | 671 | 152.0 |
| C | 0 | 10 | 129183 | 845.24 | 664 | 671 | 152.0 |
| C | 9 | 187 | 50462 | 327.48 | 664 | 671 | 152.0 |
| D | 8 | 195 | 1318874 | 8167.79 | 655 | 636 | 161.4 |
| D | 2 | 249 | 884035 | 5473.53 | 655 | 636 | 161.4 |
| D | 1 | 47 | 418466 | 2588.87 | 655 | 636 | 161.4 |
Histogram calculated using DETX and DETY for each event in the final _common_clean file
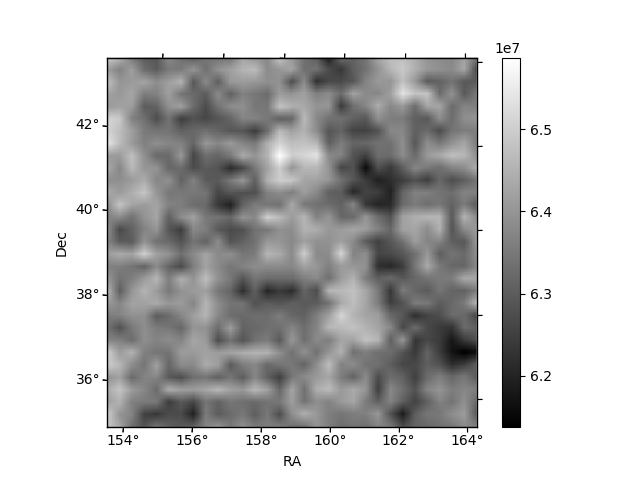
| Quadrant A | 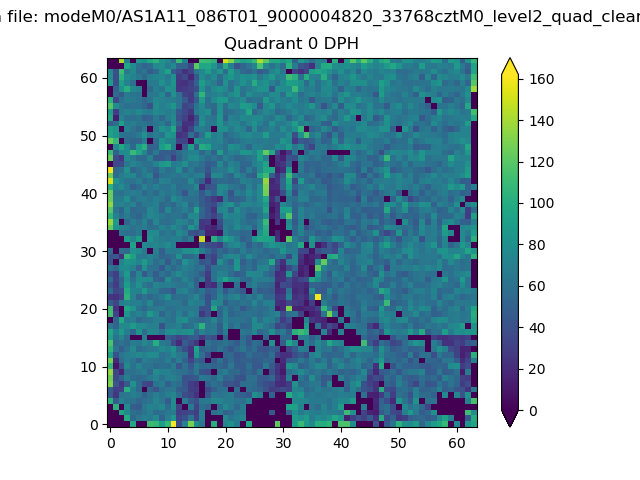 |
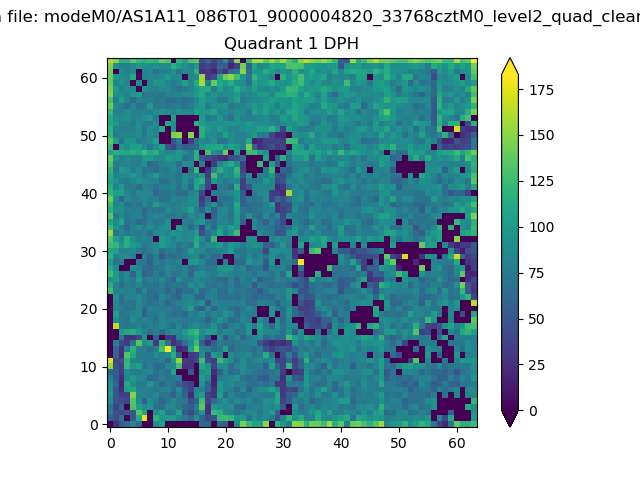 |
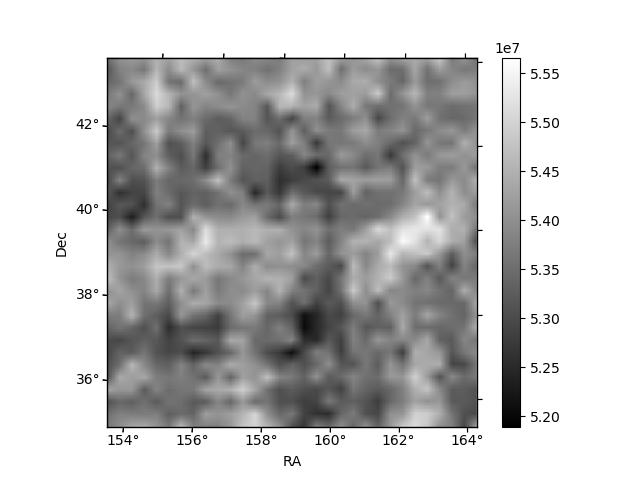
Quadrant B |
|---|---|---|---|
| Quadrant D | 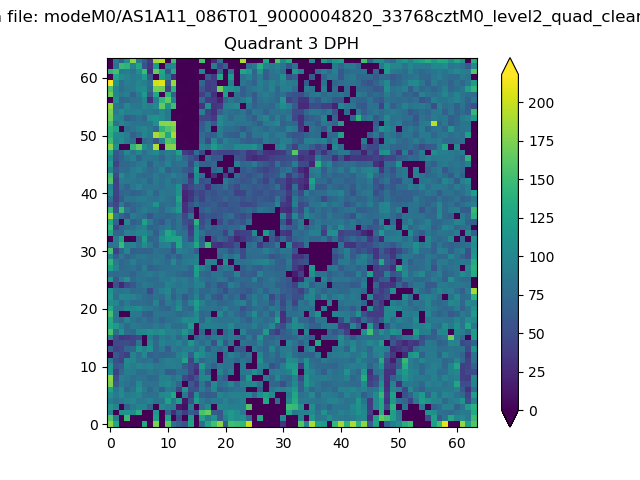 |
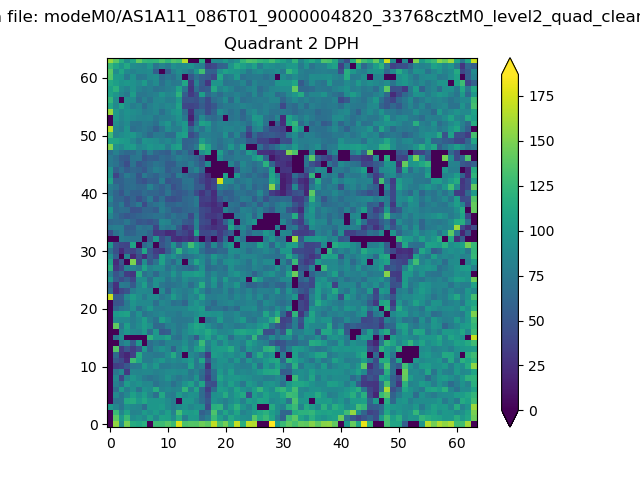 |
Quadrant C |
| Plot type | Count rate plots | Images |
|---|---|---|
| Comparison with Poisson distribution Blue bars denote a histogram of data divided into 1 sec bins. Red curve is a Poisson curve with rate = median count rate of data. |
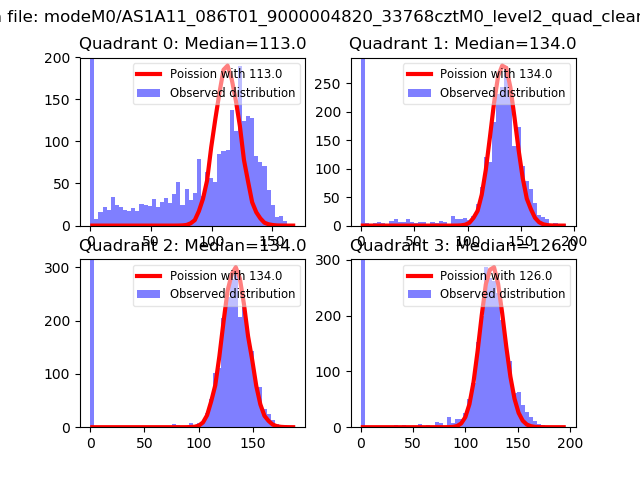 |
 |
| Quadrant-wise count rates Data is divided into 100 sec bins |
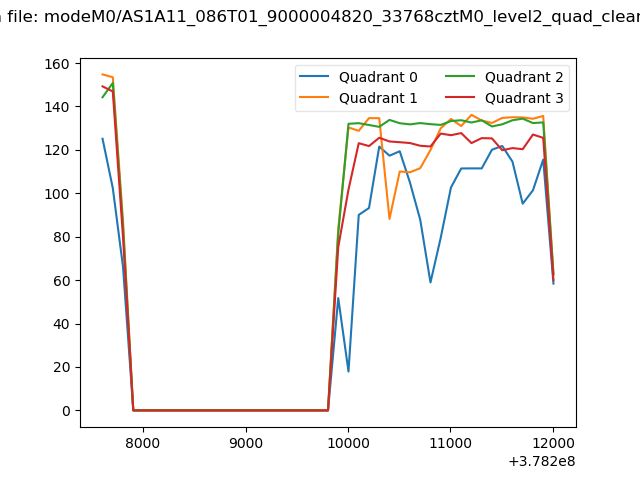 |
|
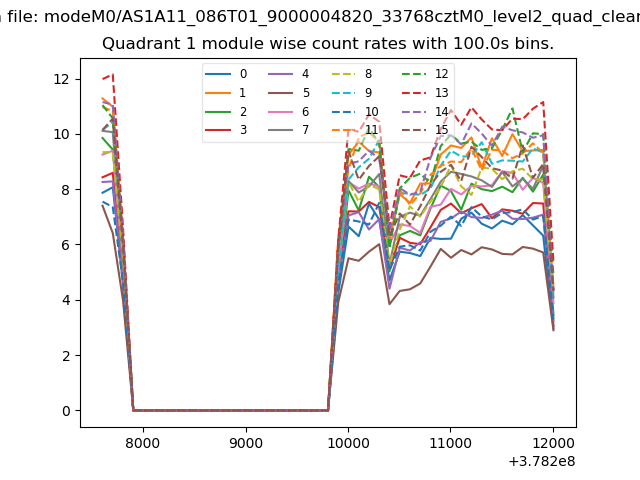
| Module-wise count rates for Quadrant A Data is divided into 100 sec bins |
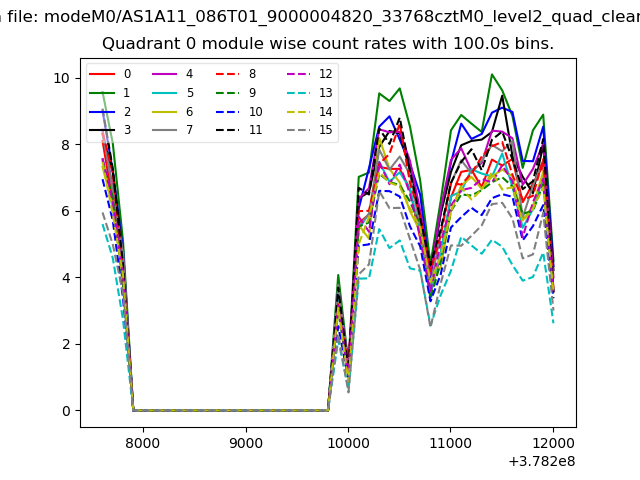 |
 |
| Module-wise count rates for Quadrant B Data is divided into 100 sec bins |
 |
 |
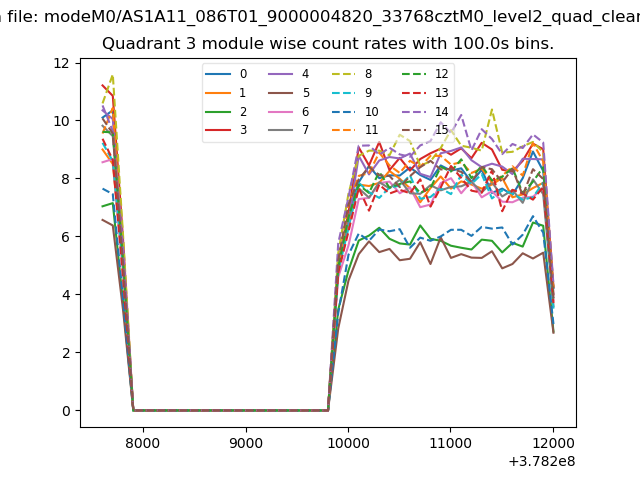
| Module-wise count rates for Quadrant C Data is divided into 100 sec bins |
 |
 |
| Module-wise count rates for Quadrant D Data is divided into 100 sec bins |
 |
 |
| Parameter | Plot |
|---|---|
| CZT HV Monitor |  |
| D_VDD | 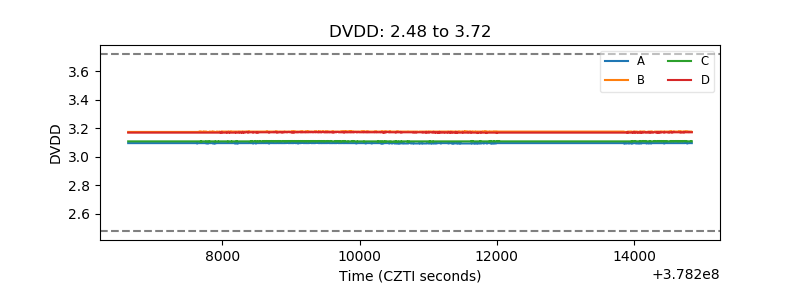 |
| Temperature 1 | 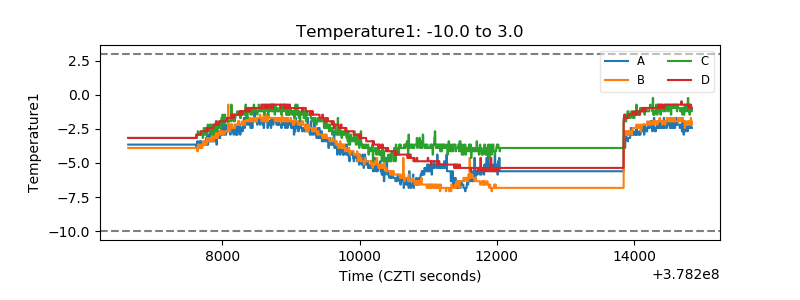 |
| Veto HV Monitor | 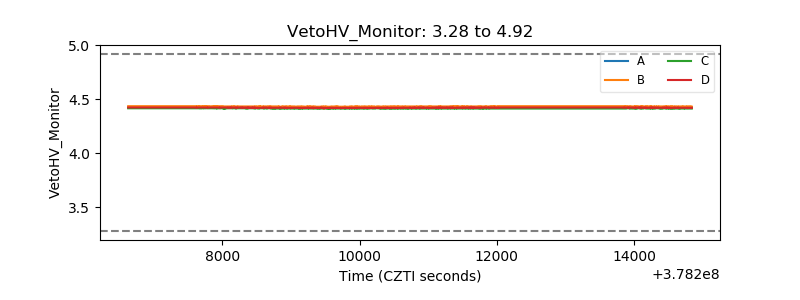 |
| Veto LLD | 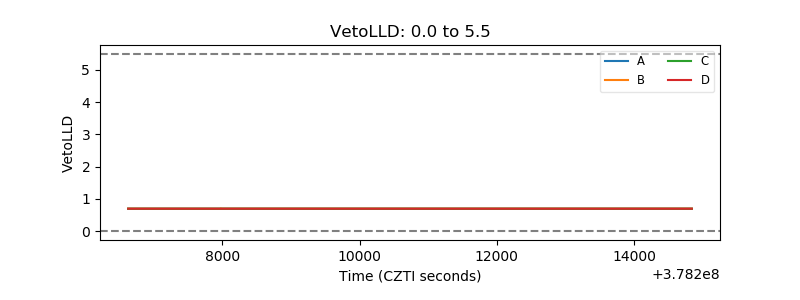 |
| Alpha Counter |  |
| _CPM_Rate | 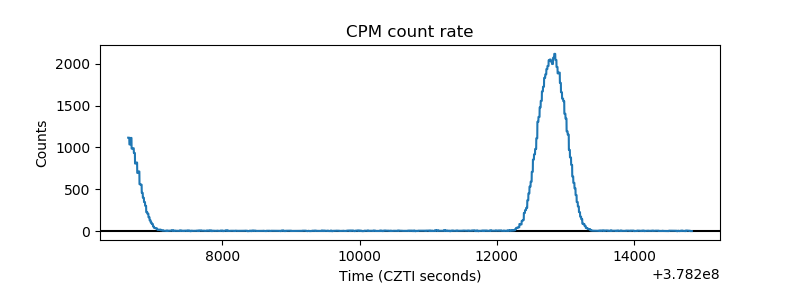 |
| CZT Counter | 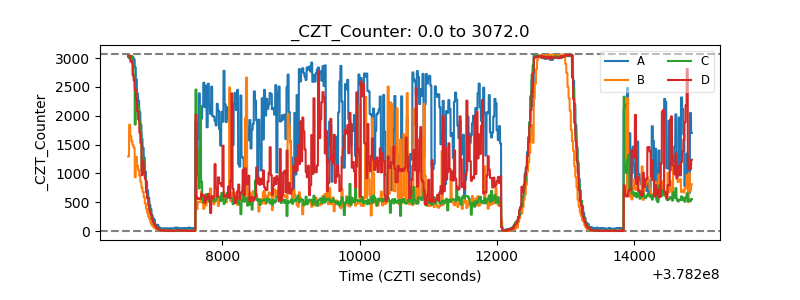 |
| +2.5 Volts monitor |  |
| +5 Volts monitor |  |
| _ROLL_ROT | 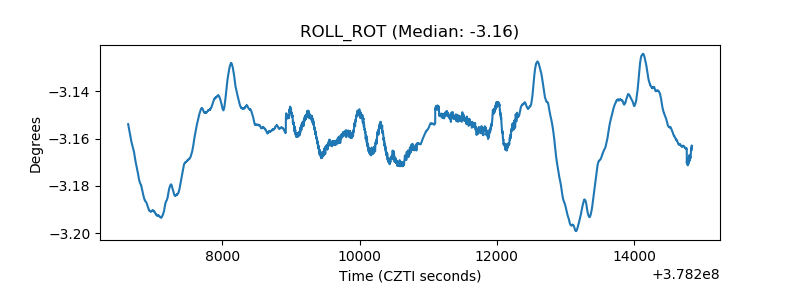 |
| _Roll_DEC | 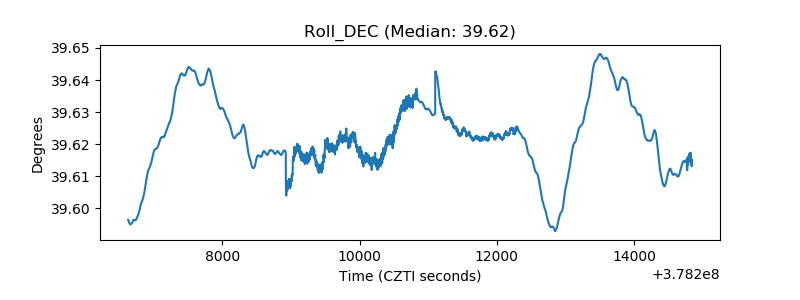 |
| _Roll_RA | 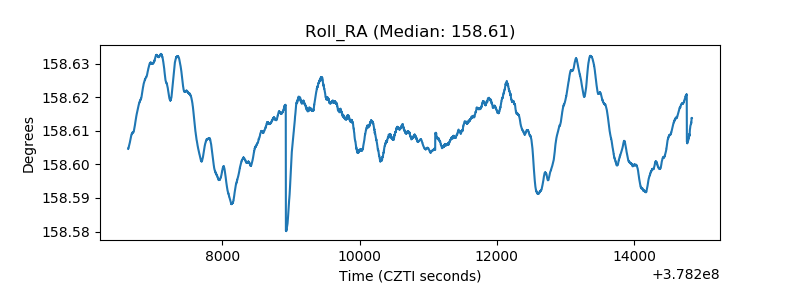 |
| Veto Counter | 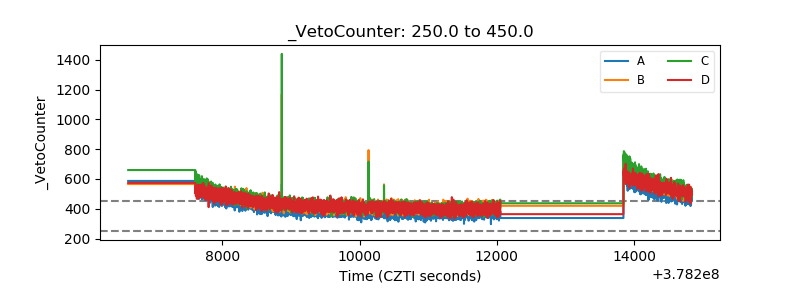 |