| Param | Original file | Final file |
|---|---|---|
| Filename | modeM0/AS1A11_086T01_9000004820_33769cztM0_level2.evt | modeM0/AS1A11_086T01_9000004820_33769cztM0_level2_quad_clean.evt |
| Size (bytes) | 770,284,800 | 52,824,960 |
| Size | 734.6 MB | 50.4 MB |
| Events in quadrant A | 9,270,625 | 256,401 |
| Events in quadrant B | 3,846,716 | 330,199 |
| Events in quadrant C | 3,382,167 | 334,707 |
| Events in quadrant D | 6,465,342 | 299,030 |
| Mode M9 | |||
|---|---|---|---|
| Quadrant | BADHDUFLAG | Total packets | Discarded packets |
| A | 0 | 25 | 0 |
| B | 0 | 25 | 0 |
| C | 0 | 25 | 0 |
| D | 0 | 26 | 0 |
| Mode SS | |||
|---|---|---|---|
| Quadrant | BADHDUFLAG | Total packets | Discarded packets |
| A | 0 | 110 | 0 |
| B | 0 | 110 | 0 |
| C | 0 | 110 | 0 |
| D | 0 | 110 | 0 |
| Mode M0 | |||
|---|---|---|---|
| Quadrant | BADHDUFLAG | Total packets | Discarded packets |
| A | 0 | 31292 | 3 |
| B | 0 | 15022 | 2 |
| C | 0 | 13472 | 2 |
| D | 0 | 23030 | 2 |
| Quadrant | Total seconds | Saturated seconds | Saturation percentage |
|---|---|---|---|
| A | 5401 | 2249 | 41.640437% |
| B | 5401 | 252 | 4.665803% |
| C | 5401 | 89 | 1.647843% |
| D | 5401 | 853 | 15.793372% |
Noise dominated data is calculated using 1-second bins in cleaned event files. If a bin has >2000 counts, and if more than 50% of those come from <1% of pixels, then it is considered to be noise-dominated and hence unusable.
| Quadrant | # 1 sec bins | Bins with >0 counts | Bins with >2000 counts | High rate bins dominated by noise | Noise dominated (total time) | Noise dominated (detector-on time) | Marked lightcurve |
|---|---|---|---|---|---|---|---|
| A | 7314 | 5402 | 2052 | 2052 | 28.06% | 37.99% | 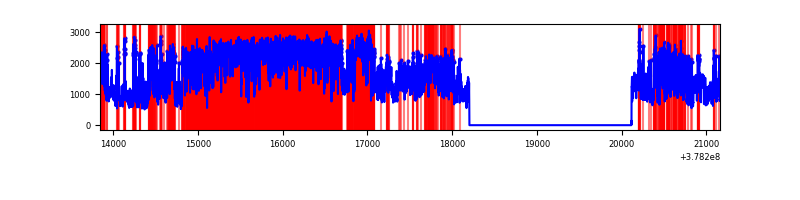 |
| B | 7314 | 5402 | 183 | 183 | 2.50% | 3.39% | 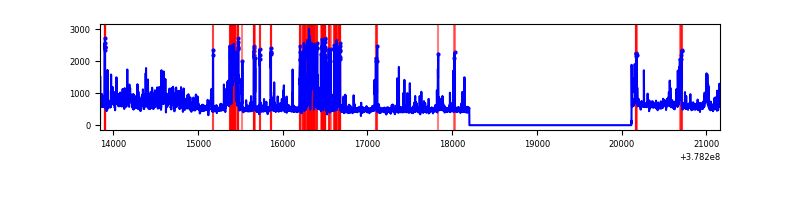 |
| C | 7314 | 5402 | 69 | 69 | 0.94% | 1.28% | 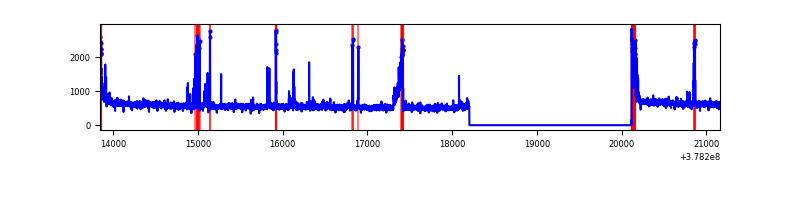 |
| D | 7314 | 5402 | 839 | 839 | 11.47% | 15.53% | 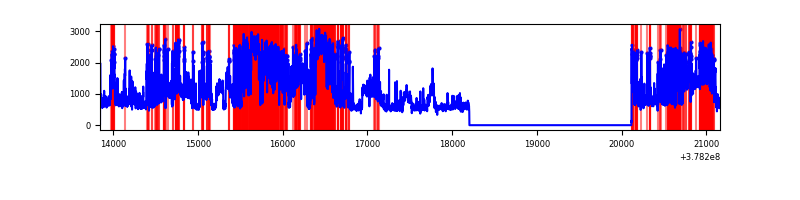 |
Top three noisy pixels from each quadrant. If the there are fewer than three noisy pixels in the level2.evt file, extra rows are filled as -1
| Pixel properties | Quadrant properties | ||||||
|---|---|---|---|---|---|---|---|
| Quadrant | DetID | PixID | Counts | Sigma | Mean | Median | Sigma |
| A | 15 | 169 | 5109139 | 42369.17 | 607 | 595 | 120.6 |
| A | 15 | 237 | 1792408 | 14860.91 | 607 | 595 | 120.6 |
| A | 13 | 6 | 16676 | 133.37 | 607 | 595 | 120.6 |
| B | 5 | 172 | 734564 | 5627.87 | 696 | 678 | 130.4 |
| B | 0 | 189 | 176804 | 1350.64 | 696 | 678 | 130.4 |
| B | 3 | 112 | 48909 | 369.86 | 696 | 678 | 130.4 |
| C | 15 | 214 | 236117 | 1485.79 | 693 | 701 | 158.4 |
| C | 9 | 187 | 226307 | 1423.88 | 693 | 701 | 158.4 |
| C | 0 | 10 | 145073 | 911.18 | 693 | 701 | 158.4 |
| D | 8 | 195 | 1189846 | 7340.08 | 660 | 644 | 162.0 |
| D | 2 | 249 | 953123 | 5878.96 | 660 | 644 | 162.0 |
| D | 7 | 223 | 563652 | 3475.04 | 660 | 644 | 162.0 |
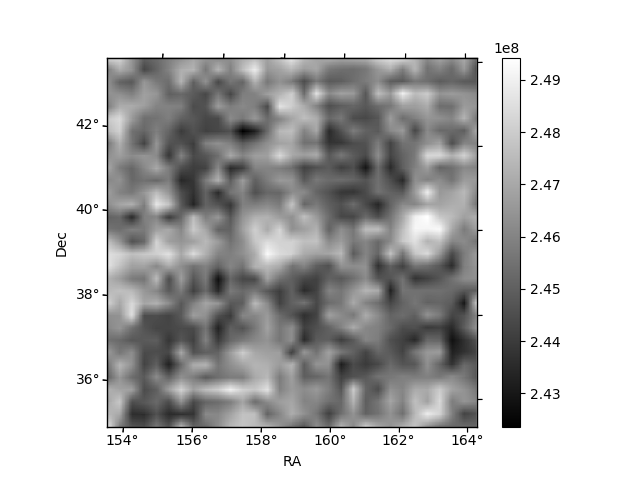
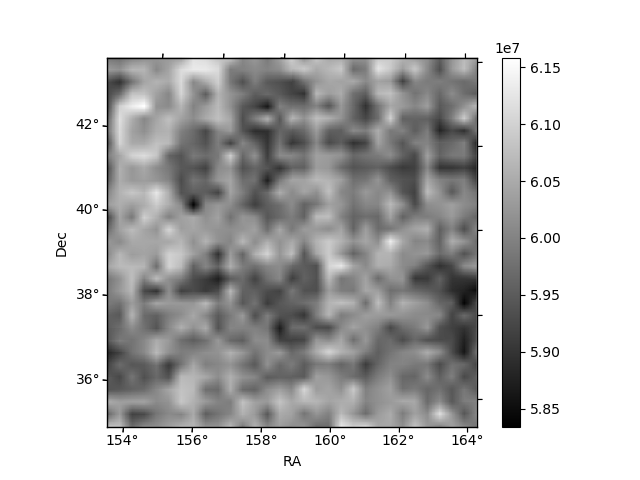
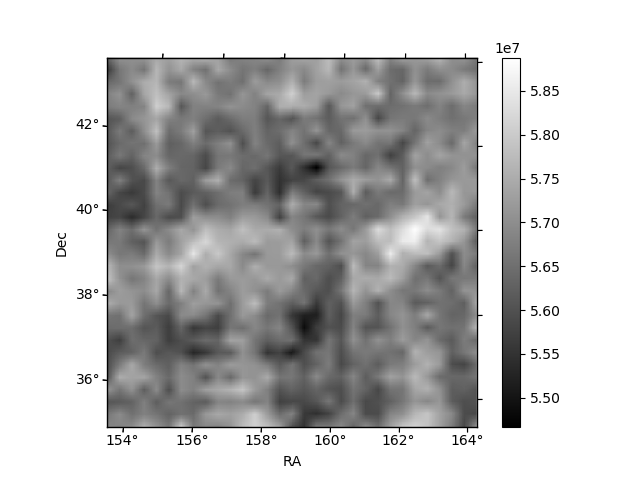
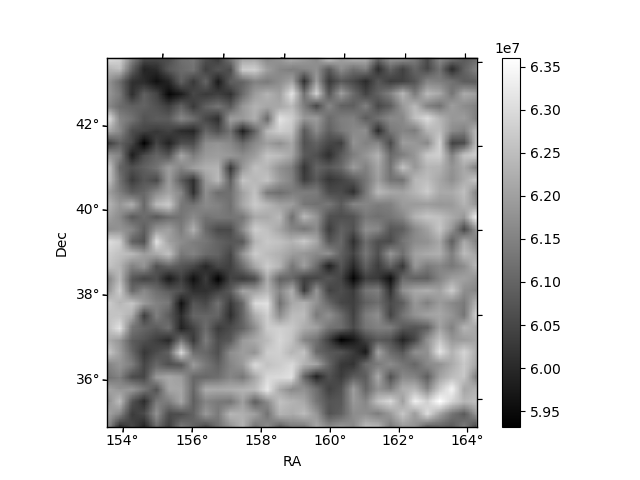
Histogram calculated using DETX and DETY for each event in the final _common_clean file
| Quadrant A | 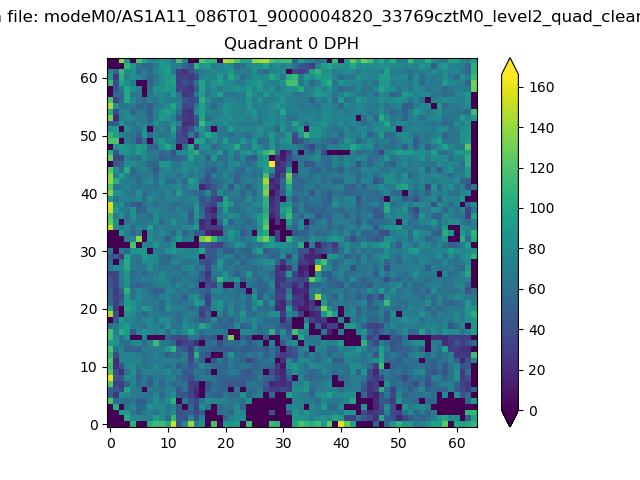 |
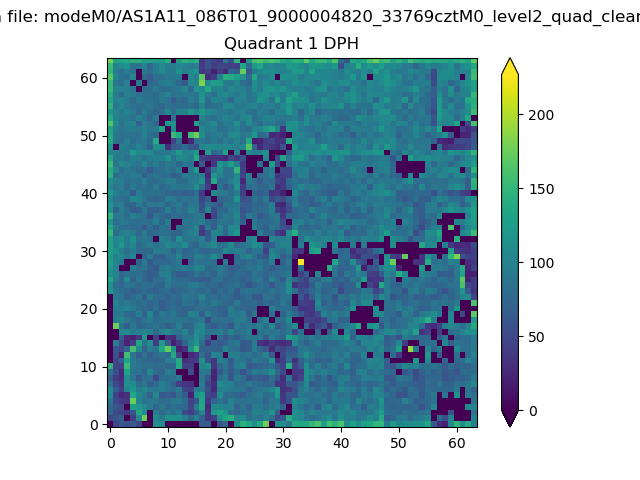 |
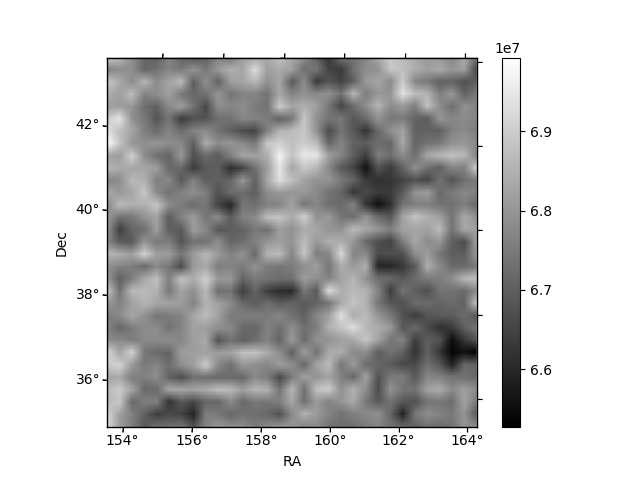
Quadrant B |
|---|---|---|---|
| Quadrant D | 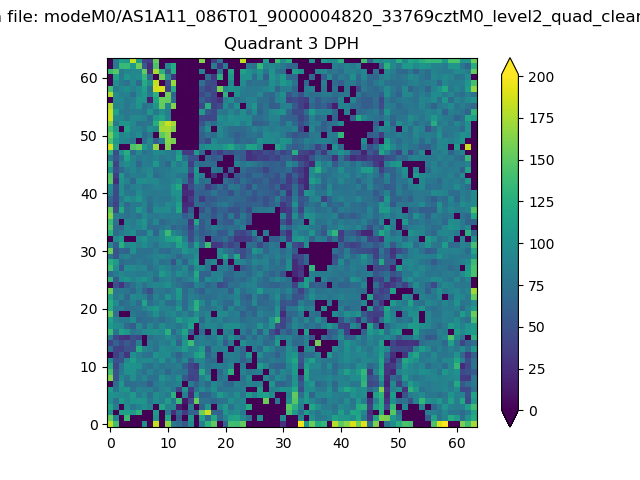 |
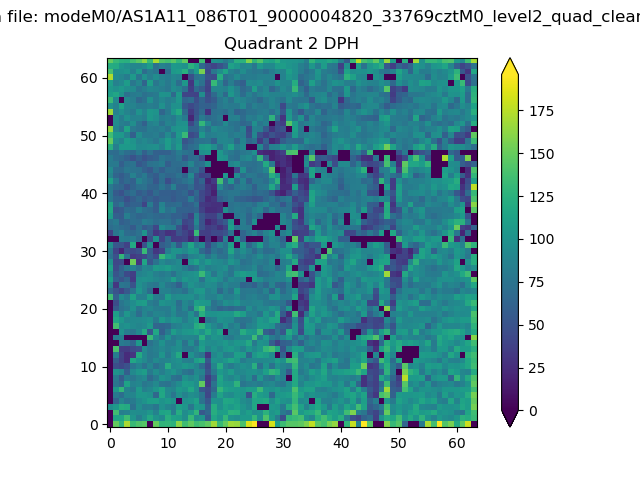 |
Quadrant C |
| Plot type | Count rate plots | Images |
|---|---|---|
| Comparison with Poisson distribution Blue bars denote a histogram of data divided into 1 sec bins. Red curve is a Poisson curve with rate = median count rate of data. |
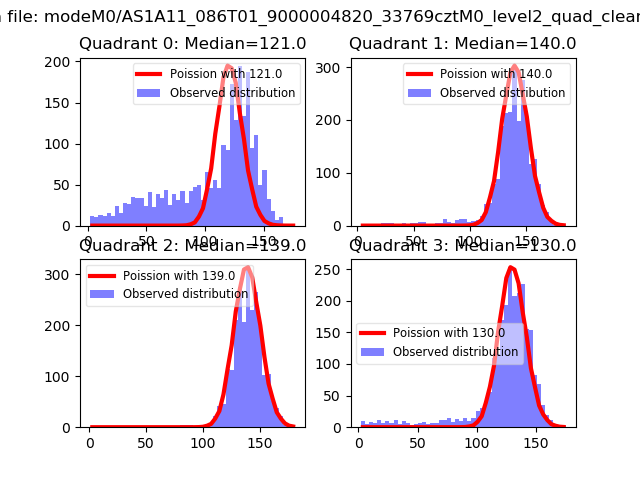 |
 |
| Quadrant-wise count rates Data is divided into 100 sec bins |
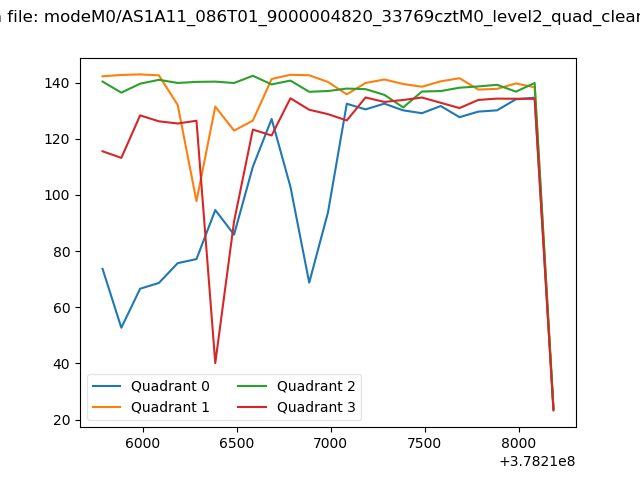 |
|
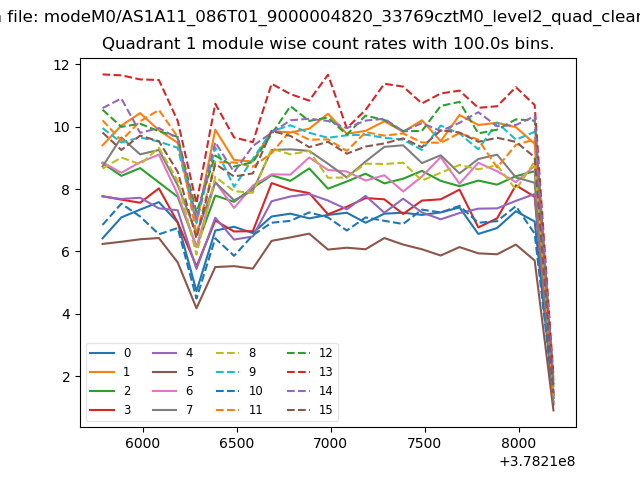
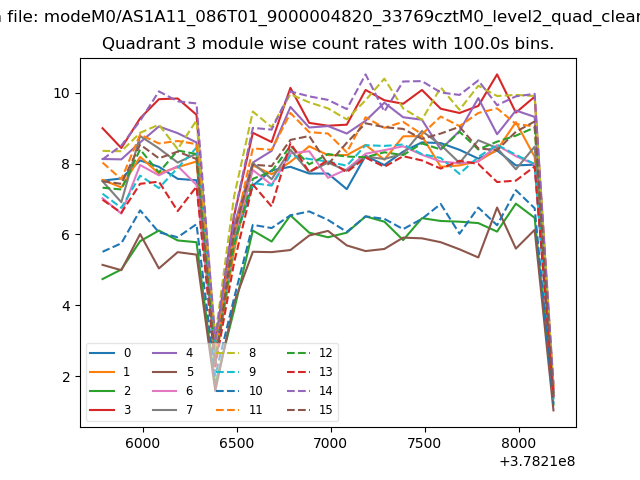
| Module-wise count rates for Quadrant A Data is divided into 100 sec bins |
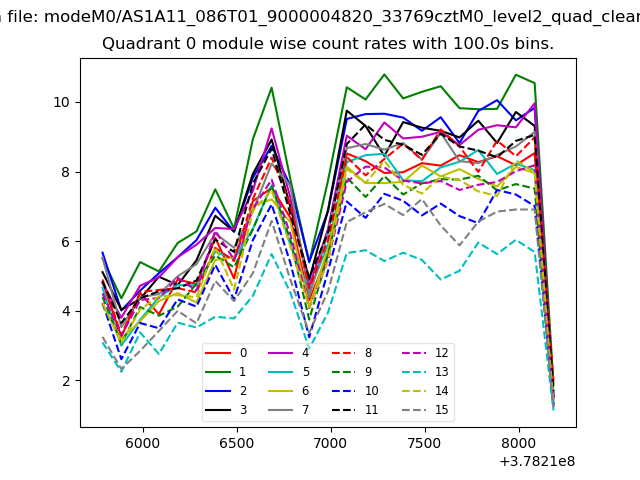 |
 |
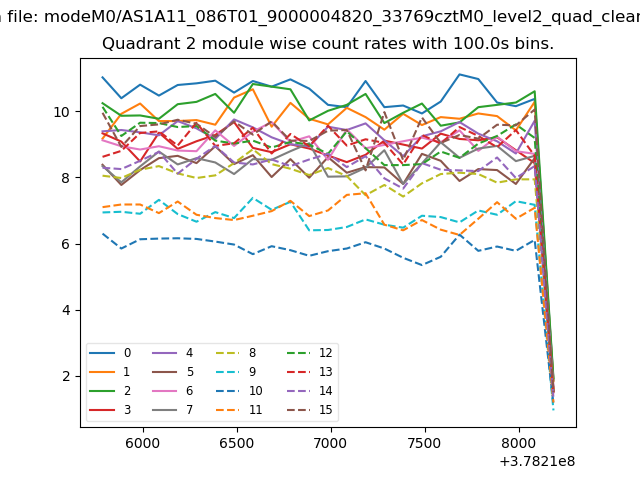
| Module-wise count rates for Quadrant B Data is divided into 100 sec bins |
 |
 |
| Module-wise count rates for Quadrant C Data is divided into 100 sec bins |
 |
 |
| Module-wise count rates for Quadrant D Data is divided into 100 sec bins |
 |
 |
| Parameter | Plot |
|---|---|
| CZT HV Monitor | 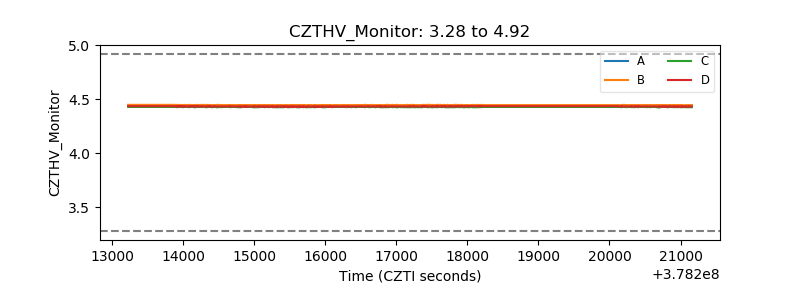 |
| D_VDD | 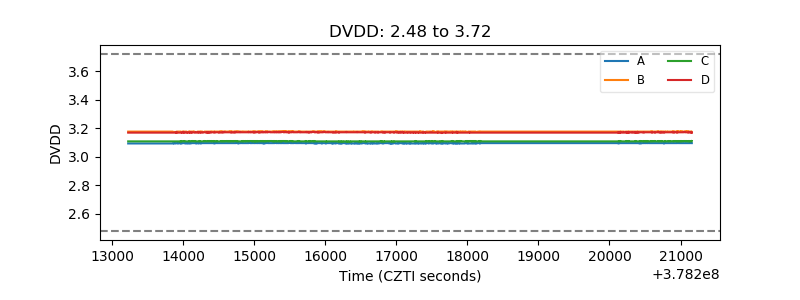 |
| Temperature 1 | 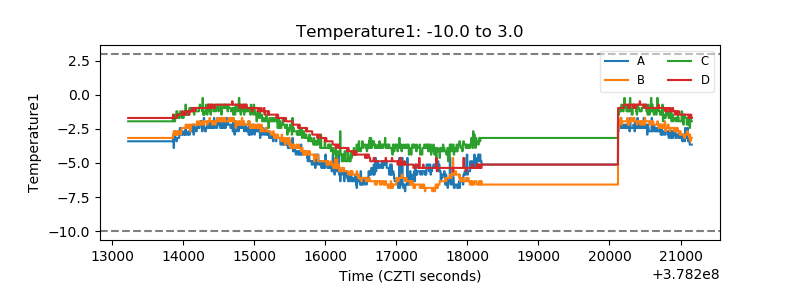 |
| Veto HV Monitor | 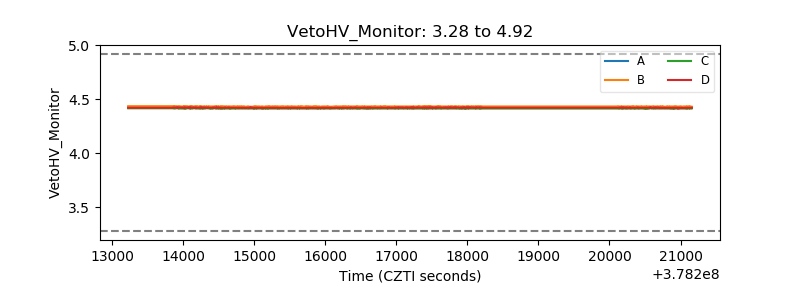 |
| Veto LLD | 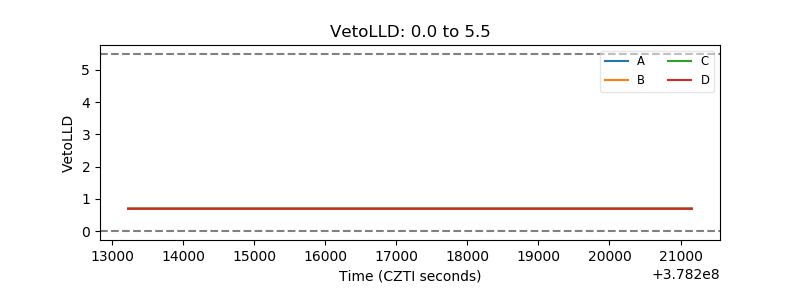 |
| Alpha Counter | 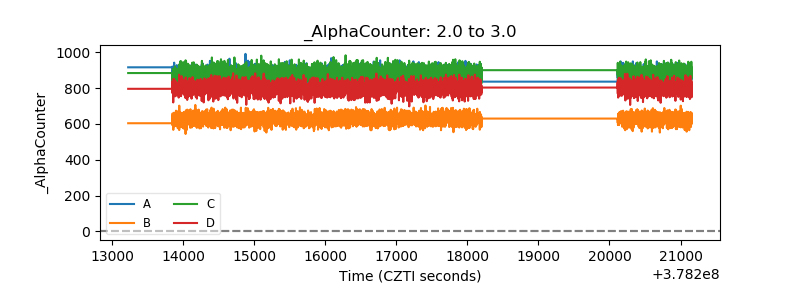 |
| _CPM_Rate | 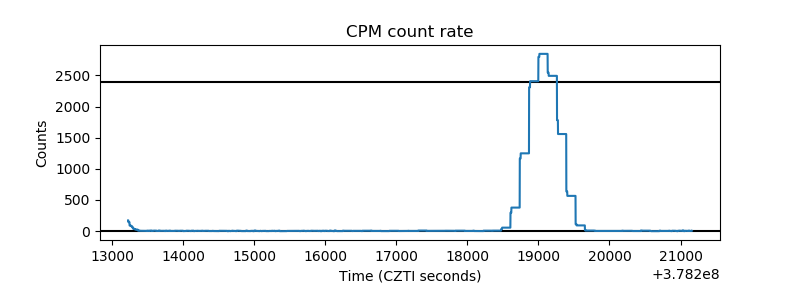 |
| CZT Counter | 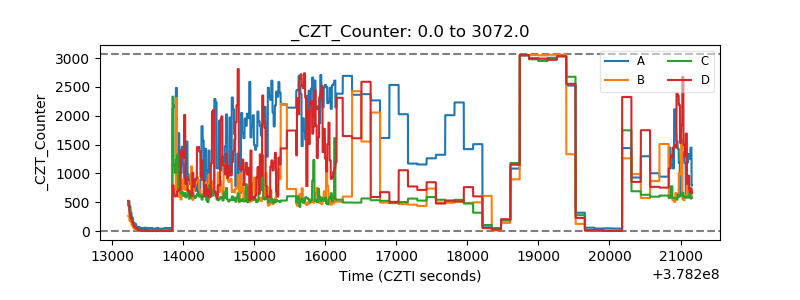 |
| +2.5 Volts monitor |  |
| +5 Volts monitor |  |
| _ROLL_ROT | 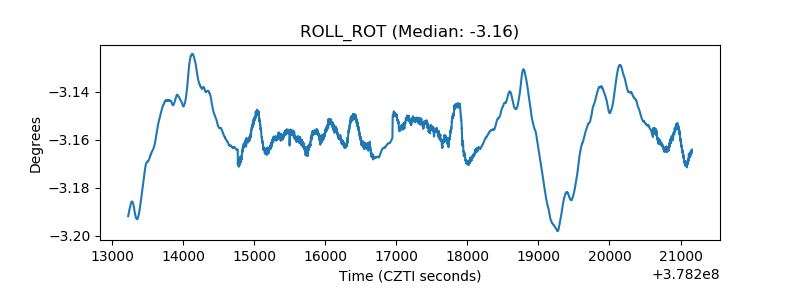 |
| _Roll_DEC | 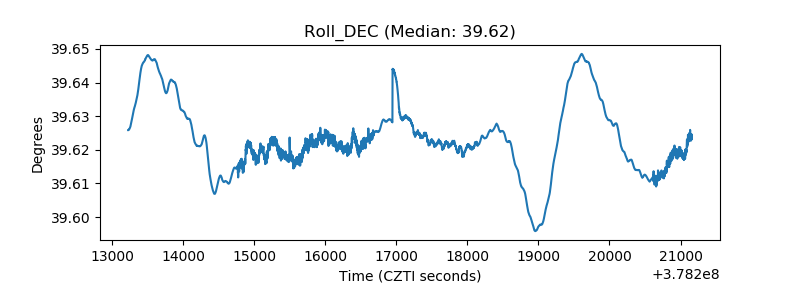 |
| _Roll_RA | 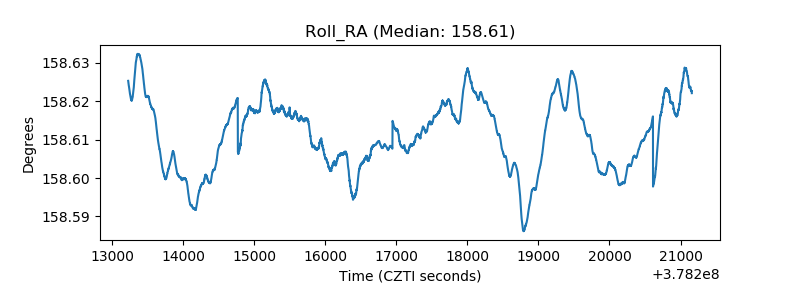 |
| Veto Counter | 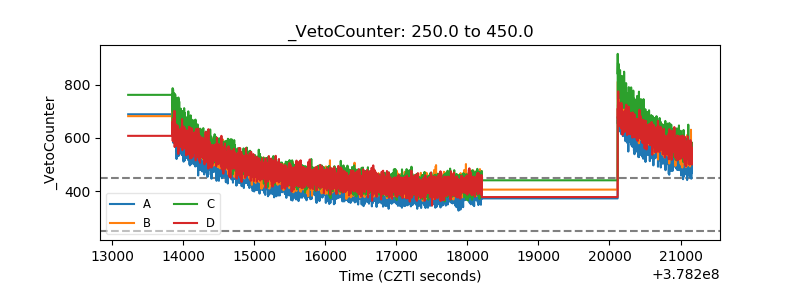 |