| Param | Original file | Final file |
|---|---|---|
| Filename | modeM0/AS1A11_086T01_9000004820_33770cztM0_level2.evt | modeM0/AS1A11_086T01_9000004820_33770cztM0_level2_quad_clean.evt |
| Size (bytes) | 729,213,120 | 62,046,720 |
| Size | 695.4 MB | 59.2 MB |
| Events in quadrant A | 7,223,359 | 366,194 |
| Events in quadrant B | 4,251,558 | 395,761 |
| Events in quadrant C | 3,353,060 | 400,267 |
| Events in quadrant D | 6,907,971 | 353,220 |
| Mode M9 | |||
|---|---|---|---|
| Quadrant | BADHDUFLAG | Total packets | Discarded packets |
| A | 0 | 20 | 0 |
| B | 0 | 20 | 0 |
| C | 0 | 20 | 0 |
| D | 0 | 20 | 0 |
| Mode SS | |||
|---|---|---|---|
| Quadrant | BADHDUFLAG | Total packets | Discarded packets |
| A | 0 | 106 | 0 |
| B | 0 | 106 | 0 |
| C | 0 | 106 | 0 |
| D | 0 | 106 | 0 |
| Mode M0 | |||
|---|---|---|---|
| Quadrant | BADHDUFLAG | Total packets | Discarded packets |
| A | 0 | 25088 | 2 |
| B | 0 | 16027 | 1 |
| C | 0 | 13420 | 1 |
| D | 0 | 24232 | 1 |
| Quadrant | Total seconds | Saturated seconds | Saturation percentage |
|---|---|---|---|
| A | 5178 | 1276 | 24.642719% |
| B | 5178 | 579 | 11.181924% |
| C | 5178 | 102 | 1.969873% |
| D | 5178 | 868 | 16.763229% |
Noise dominated data is calculated using 1-second bins in cleaned event files. If a bin has >2000 counts, and if more than 50% of those come from <1% of pixels, then it is considered to be noise-dominated and hence unusable.
| Quadrant | # 1 sec bins | Bins with >0 counts | Bins with >2000 counts | High rate bins dominated by noise | Noise dominated (total time) | Noise dominated (detector-on time) | Marked lightcurve |
|---|---|---|---|---|---|---|---|
| A | 7210 | 5179 | 1051 | 1051 | 14.58% | 20.29% | 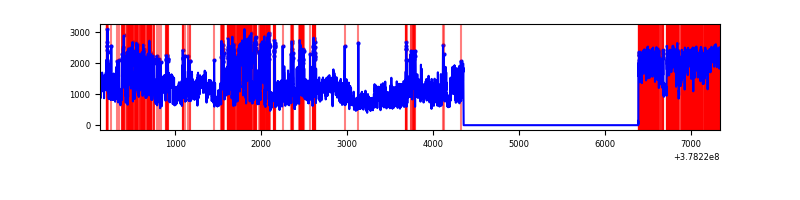 |
| B | 7210 | 5179 | 454 | 454 | 6.30% | 8.77% | 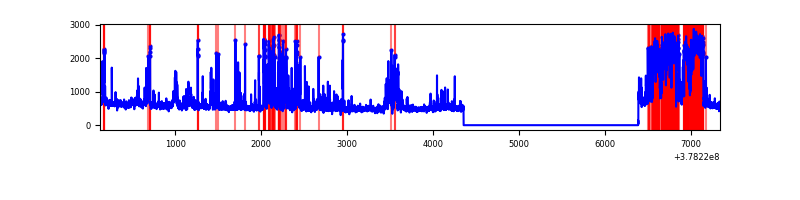 |
| C | 7210 | 5179 | 79 | 79 | 1.10% | 1.53% | 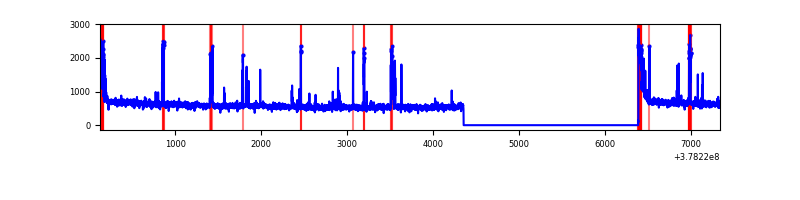 |
| D | 7210 | 5179 | 1040 | 1040 | 14.42% | 20.08% |  |
Top three noisy pixels from each quadrant. If the there are fewer than three noisy pixels in the level2.evt file, extra rows are filled as -1
| Pixel properties | Quadrant properties | ||||||
|---|---|---|---|---|---|---|---|
| Quadrant | DetID | PixID | Counts | Sigma | Mean | Median | Sigma |
| A | 15 | 169 | 3462249 | 26957.32 | 646 | 635 | 128.4 |
| A | 15 | 237 | 1243629 | 9679.82 | 646 | 635 | 128.4 |
| A | 13 | 6 | 15802 | 118.11 | 646 | 635 | 128.4 |
| B | 5 | 172 | 1493113 | 12082.78 | 663 | 647 | 123.5 |
| B | 0 | 189 | 36774 | 292.48 | 663 | 647 | 123.5 |
| B | 4 | 251 | 28034 | 221.72 | 663 | 647 | 123.5 |
| C | 15 | 214 | 225201 | 1444.95 | 685 | 693 | 155.4 |
| C | 9 | 187 | 204154 | 1309.49 | 685 | 693 | 155.4 |
| C | 0 | 10 | 136324 | 872.93 | 685 | 693 | 155.4 |
| D | 7 | 223 | 2260593 | 14110.95 | 661 | 643 | 160.2 |
| D | 8 | 195 | 943831 | 5889.19 | 661 | 643 | 160.2 |
| D | 2 | 250 | 501957 | 3130.16 | 661 | 643 | 160.2 |
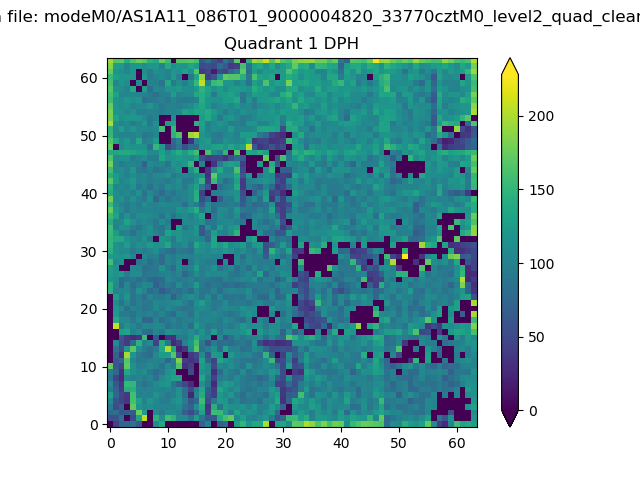
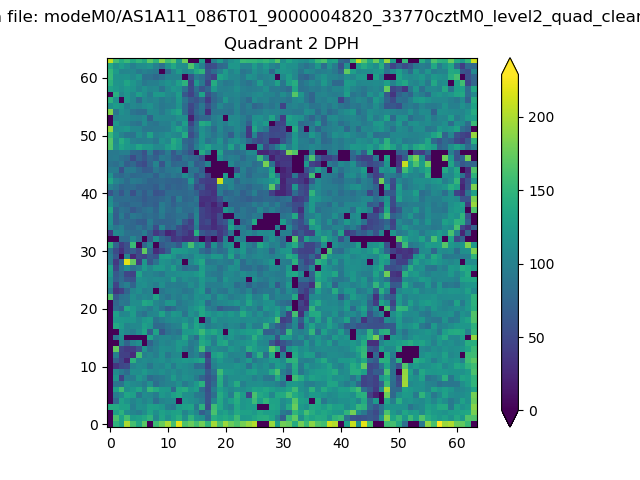
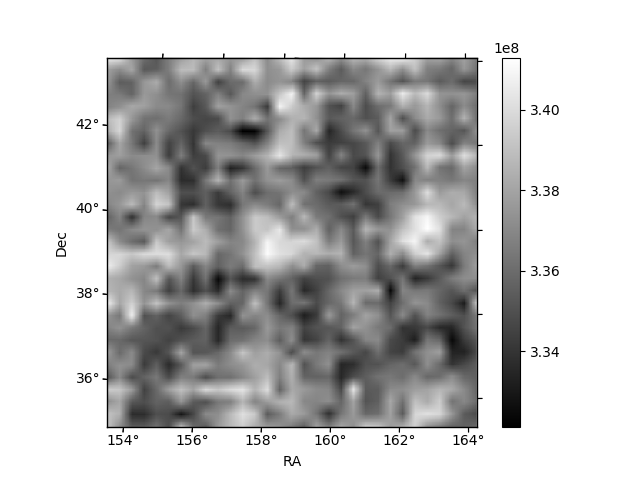
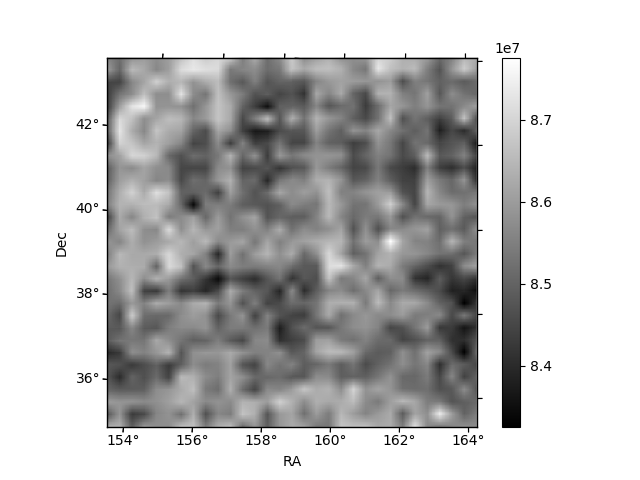
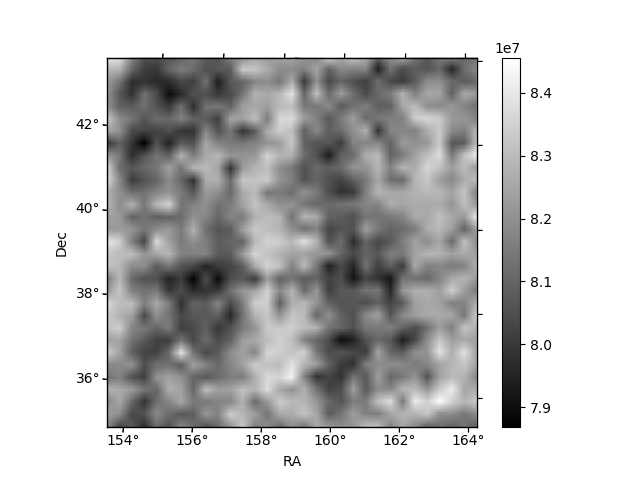
Histogram calculated using DETX and DETY for each event in the final _common_clean file
| Quadrant A | 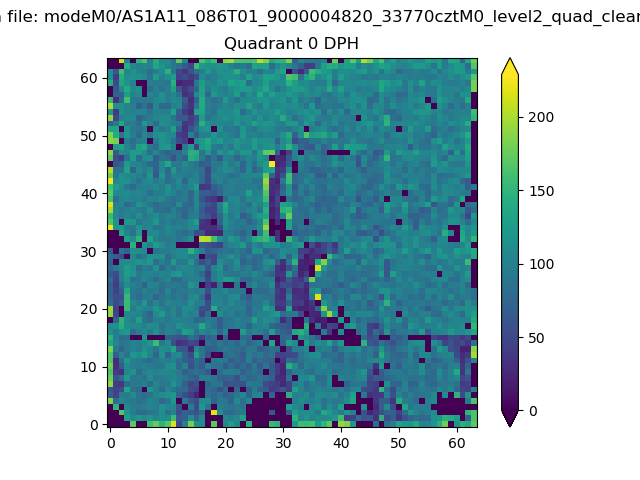 |
 |
Quadrant B |
|---|---|---|---|
| Quadrant D | 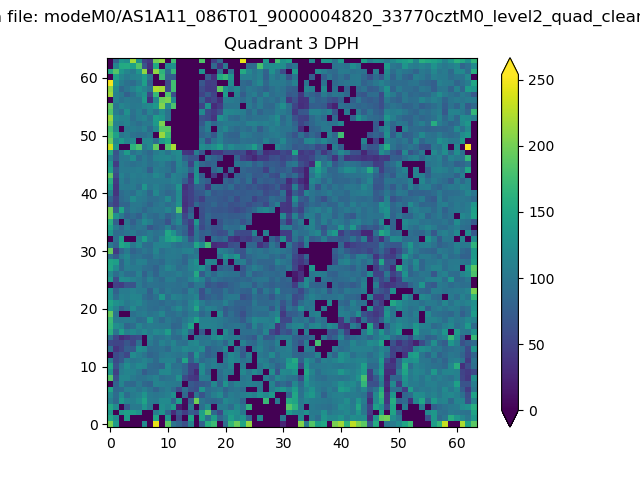 |
 |
Quadrant C |
| Plot type | Count rate plots | Images |
|---|---|---|
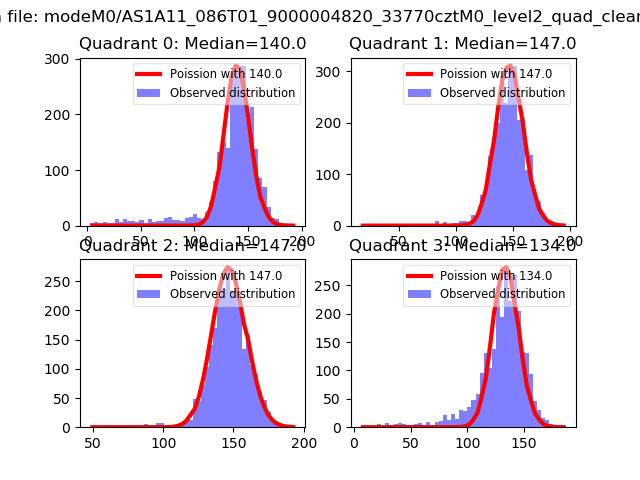
| Comparison with Poisson distribution Blue bars denote a histogram of data divided into 1 sec bins. Red curve is a Poisson curve with rate = median count rate of data. |
 |
 |
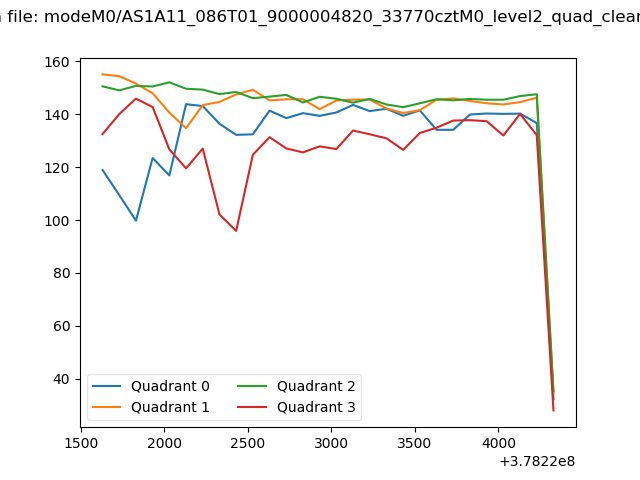
| Quadrant-wise count rates Data is divided into 100 sec bins |
 |
|
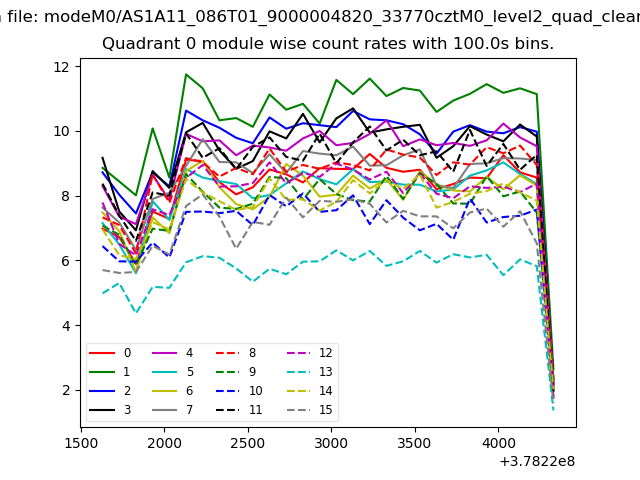
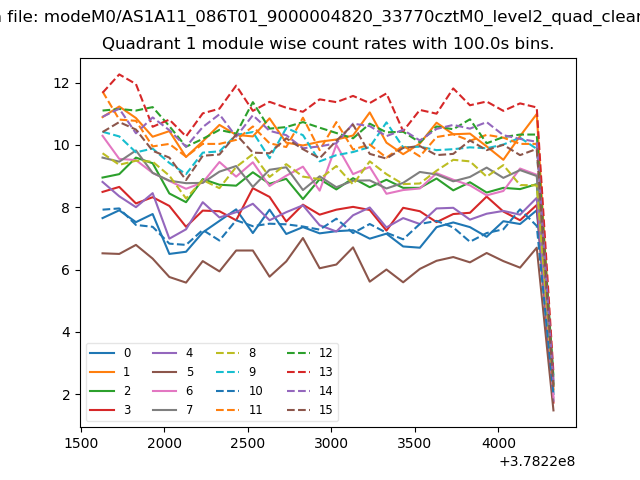
| Module-wise count rates for Quadrant A Data is divided into 100 sec bins |
 |
 |
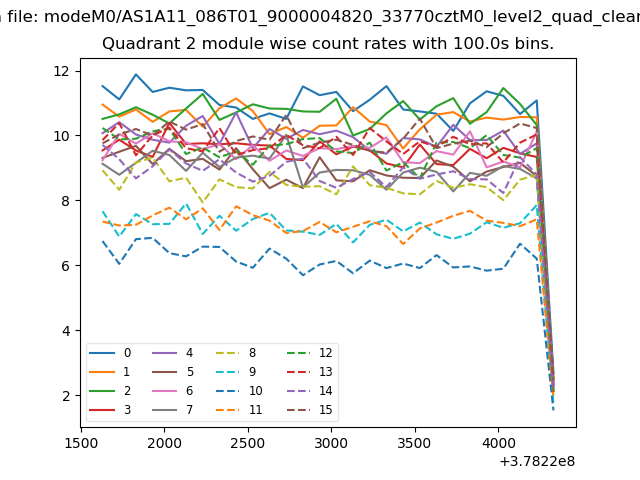
| Module-wise count rates for Quadrant B Data is divided into 100 sec bins |
 |
 |
| Module-wise count rates for Quadrant C Data is divided into 100 sec bins |
 |
 |
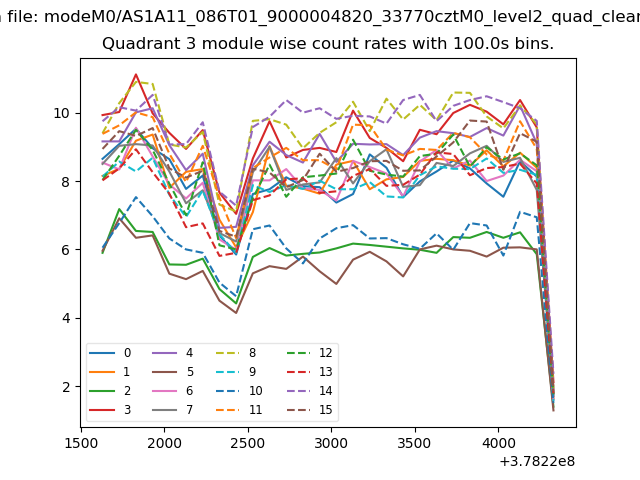
| Module-wise count rates for Quadrant D Data is divided into 100 sec bins |
 |
 |
| Parameter | Plot |
|---|---|
| CZT HV Monitor | 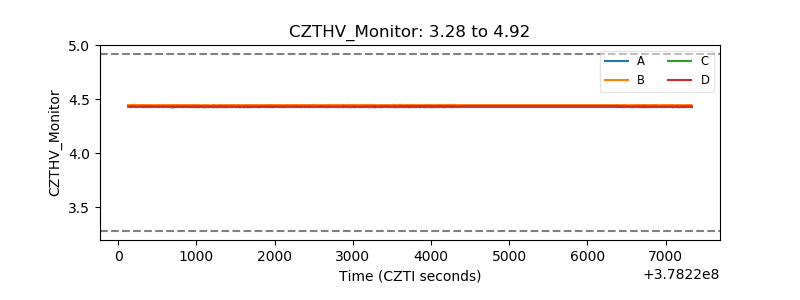 |
| D_VDD | 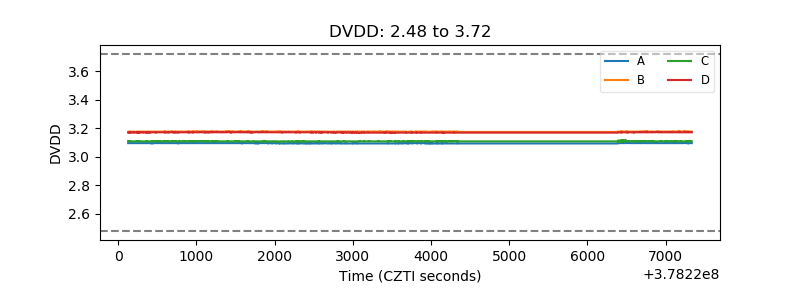 |
| Temperature 1 | 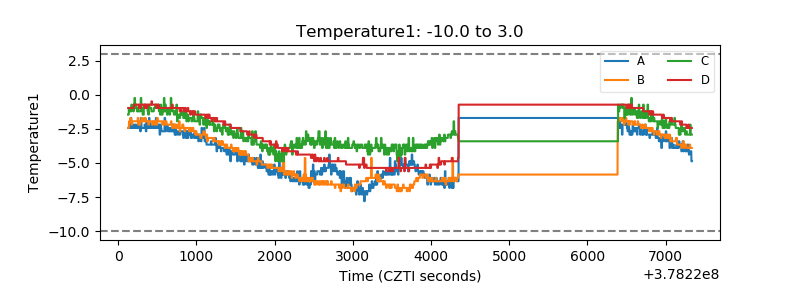 |
| Veto HV Monitor | 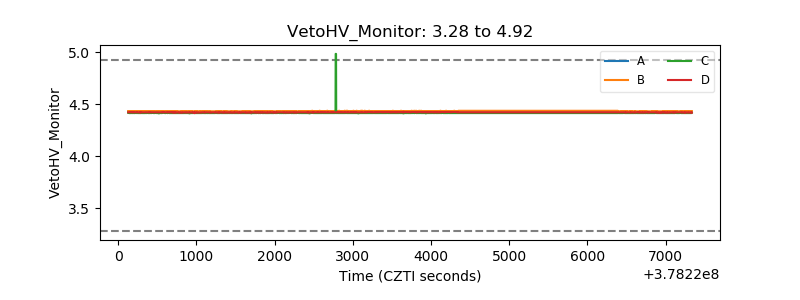 |
| Veto LLD | 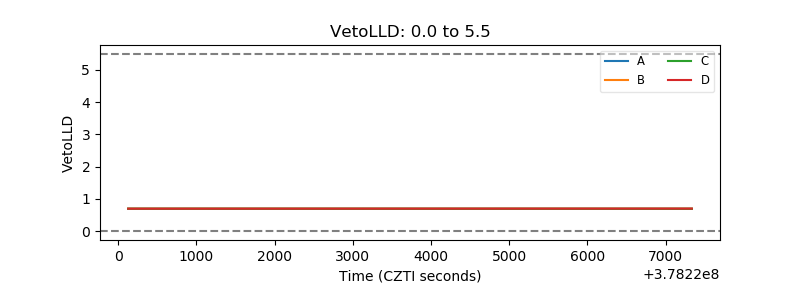 |
| Alpha Counter | 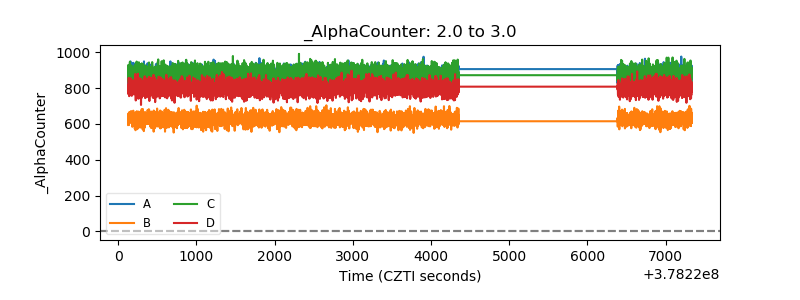 |
| _CPM_Rate | 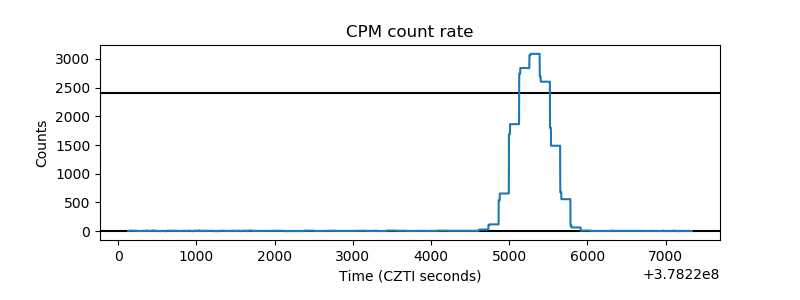 |
| CZT Counter | 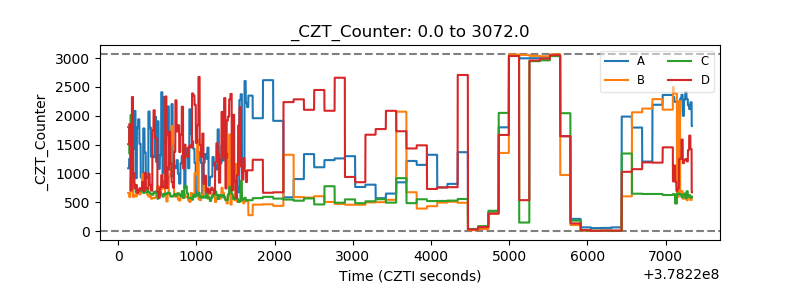 |
| +2.5 Volts monitor |  |
| +5 Volts monitor |  |
| _ROLL_ROT | 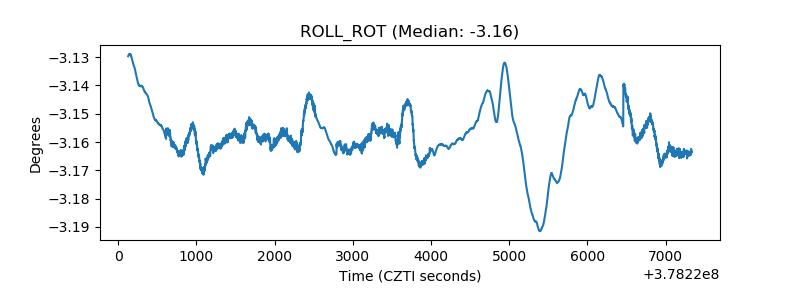 |
| _Roll_DEC | 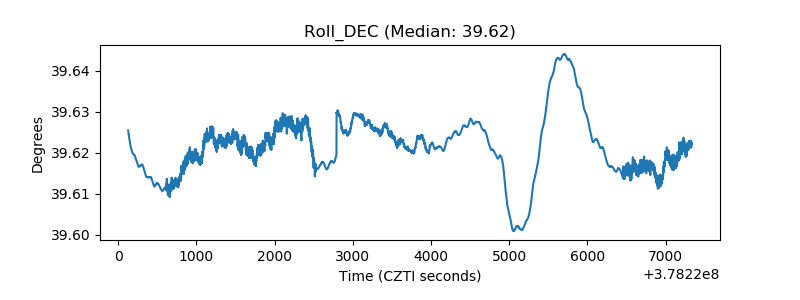 |
| _Roll_RA | 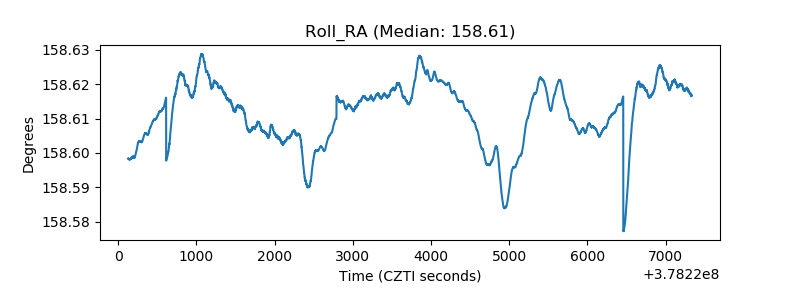 |
| Veto Counter | 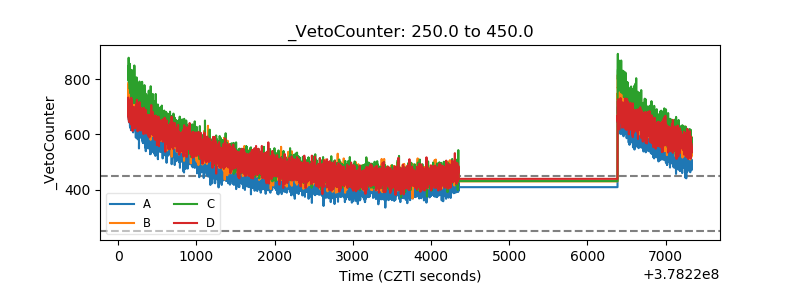 |