| Param | Original file | Final file |
|---|---|---|
| Filename | modeM0/AS1A11_086T01_9000004820_33771cztM0_level2.evt | modeM0/AS1A11_086T01_9000004820_33771cztM0_level2_quad_clean.evt |
| Size (bytes) | 750,934,080 | 71,366,400 |
| Size | 716.1 MB | 68.1 MB |
| Events in quadrant A | 9,728,295 | 377,503 |
| Events in quadrant B | 4,194,483 | 486,887 |
| Events in quadrant C | 3,725,179 | 486,080 |
| Events in quadrant D | 4,759,013 | 460,840 |
| Mode M9 | |||
|---|---|---|---|
| Quadrant | BADHDUFLAG | Total packets | Discarded packets |
| A | 0 | 28 | 0 |
| B | 0 | 28 | 0 |
| C | 0 | 28 | 0 |
| D | 0 | 29 | 0 |
| Mode SS | |||
|---|---|---|---|
| Quadrant | BADHDUFLAG | Total packets | Discarded packets |
| A | 0 | 102 | 0 |
| B | 0 | 102 | 0 |
| C | 0 | 102 | 0 |
| D | 0 | 102 | 0 |
| Mode M0 | |||
|---|---|---|---|
| Quadrant | BADHDUFLAG | Total packets | Discarded packets |
| A | 0 | 32340 | 3 |
| B | 0 | 15627 | 2 |
| C | 0 | 14642 | 2 |
| D | 0 | 17764 | 2 |
| Quadrant | Total seconds | Saturated seconds | Saturation percentage |
|---|---|---|---|
| A | 4976 | 2822 | 56.712219% |
| B | 4976 | 684 | 13.745981% |
| C | 4976 | 188 | 3.778135% |
| D | 4976 | 188 | 3.778135% |
Noise dominated data is calculated using 1-second bins in cleaned event files. If a bin has >2000 counts, and if more than 50% of those come from <1% of pixels, then it is considered to be noise-dominated and hence unusable.
| Quadrant | # 1 sec bins | Bins with >0 counts | Bins with >2000 counts | High rate bins dominated by noise | Noise dominated (total time) | Noise dominated (detector-on time) | Marked lightcurve |
|---|---|---|---|---|---|---|---|
| A | 7129 | 4977 | 2665 | 2665 | 37.38% | 53.55% | 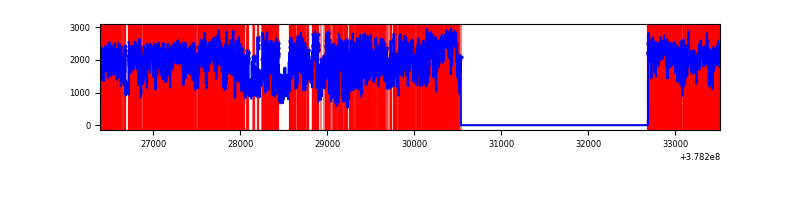 |
| B | 7129 | 4977 | 555 | 555 | 7.79% | 11.15% | 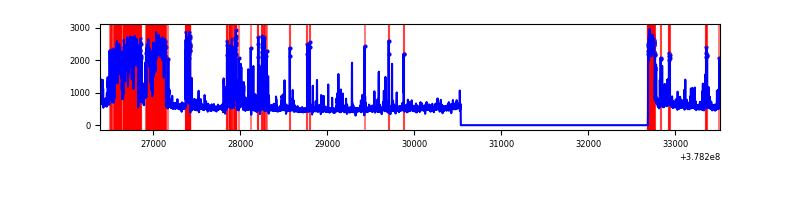 |
| C | 7129 | 4977 | 177 | 177 | 2.48% | 3.56% | 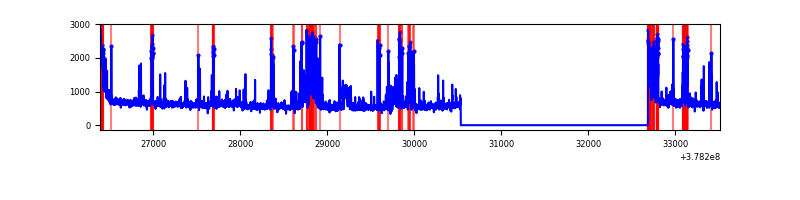 |
| D | 7129 | 4977 | 171 | 171 | 2.40% | 3.44% | 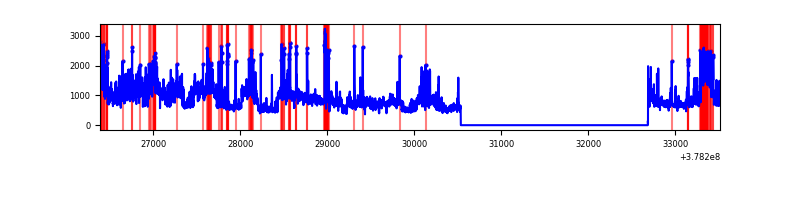 |
Top three noisy pixels from each quadrant. If the there are fewer than three noisy pixels in the level2.evt file, extra rows are filled as -1
| Pixel properties | Quadrant properties | ||||||
|---|---|---|---|---|---|---|---|
| Quadrant | DetID | PixID | Counts | Sigma | Mean | Median | Sigma |
| A | 15 | 169 | 5241453 | 48361.7 | 551 | 542 | 108.4 |
| A | 15 | 237 | 2340012 | 21587.99 | 551 | 542 | 108.4 |
| A | 13 | 6 | 9078 | 78.77 | 551 | 542 | 108.4 |
| B | 5 | 172 | 1453852 | 12630.6 | 619 | 607 | 115.1 |
| B | 5 | 200 | 90957 | 785.26 | 619 | 607 | 115.1 |
| B | 0 | 229 | 45131 | 386.97 | 619 | 607 | 115.1 |
| C | 0 | 239 | 408193 | 2773.29 | 647 | 657 | 147.0 |
| C | 9 | 187 | 274574 | 1864.01 | 647 | 657 | 147.0 |
| C | 15 | 214 | 216110 | 1466.16 | 647 | 657 | 147.0 |
| D | 8 | 195 | 1085250 | 6326.09 | 641 | 632 | 171.5 |
| D | 7 | 223 | 401449 | 2337.79 | 641 | 632 | 171.5 |
| D | 1 | 47 | 177977 | 1034.37 | 641 | 632 | 171.5 |
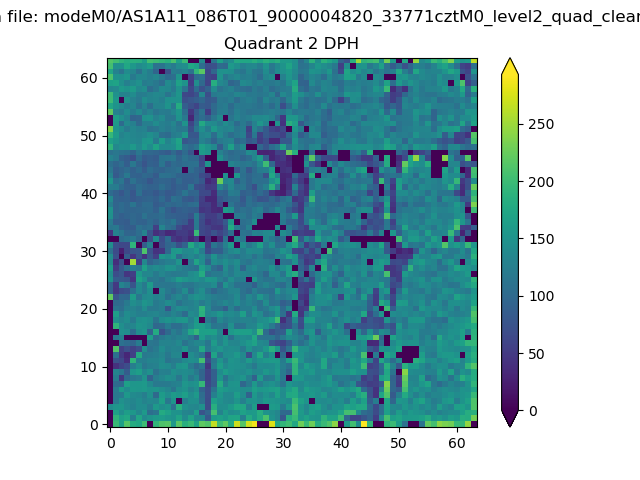
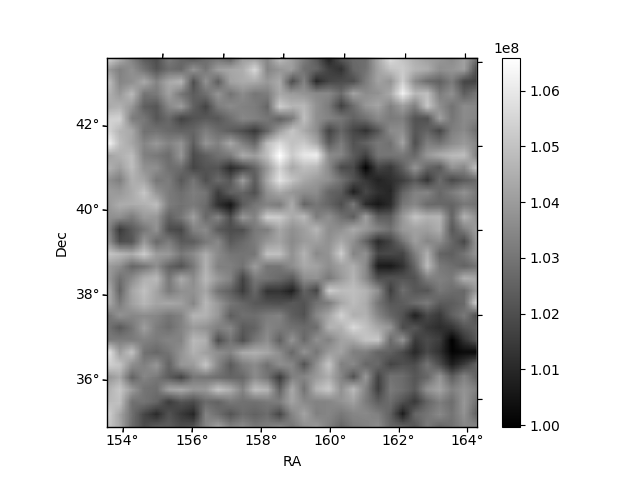
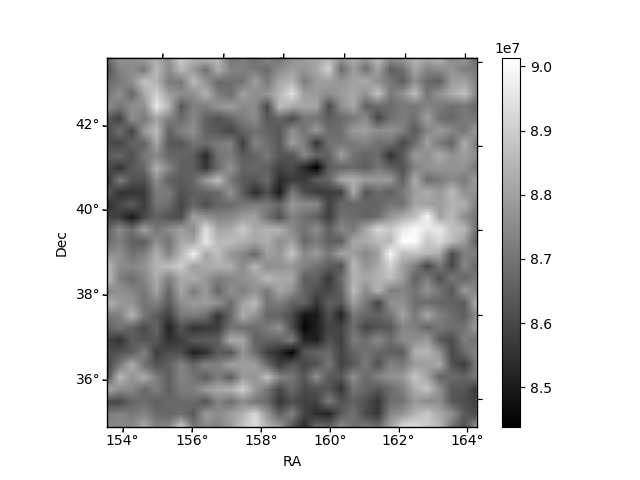
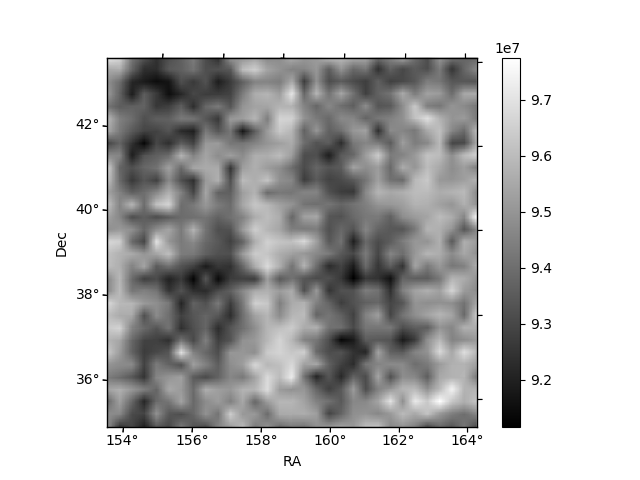
Histogram calculated using DETX and DETY for each event in the final _common_clean file
| Quadrant A | 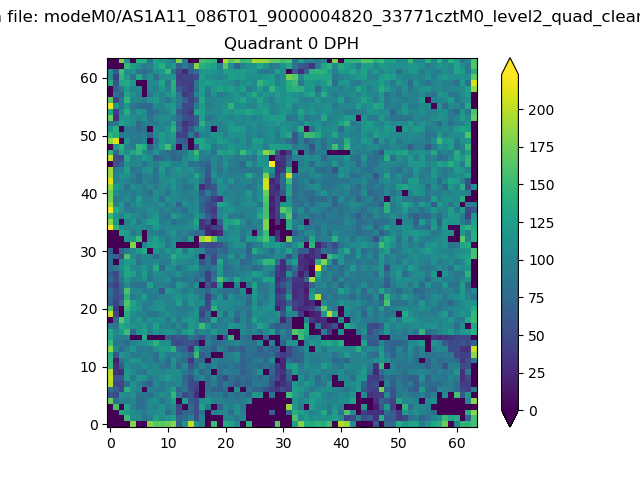 |
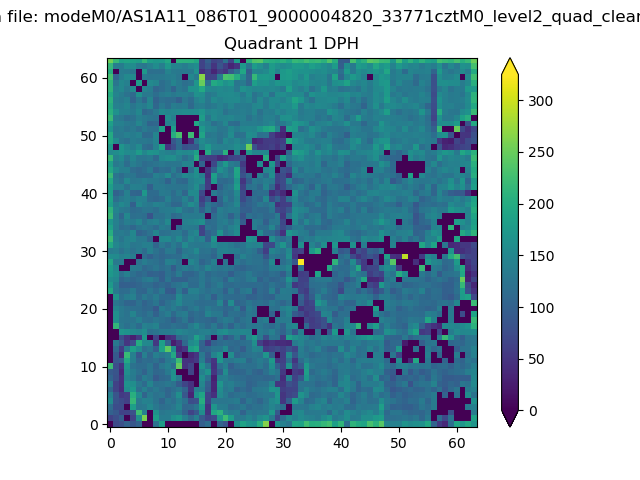 |
Quadrant B |
|---|---|---|---|
| Quadrant D | 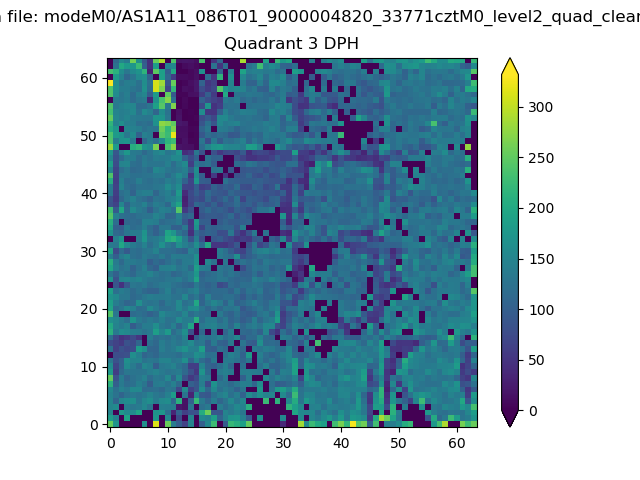 |
 |
Quadrant C |
| Plot type | Count rate plots | Images |
|---|---|---|
| Comparison with Poisson distribution Blue bars denote a histogram of data divided into 1 sec bins. Red curve is a Poisson curve with rate = median count rate of data. |
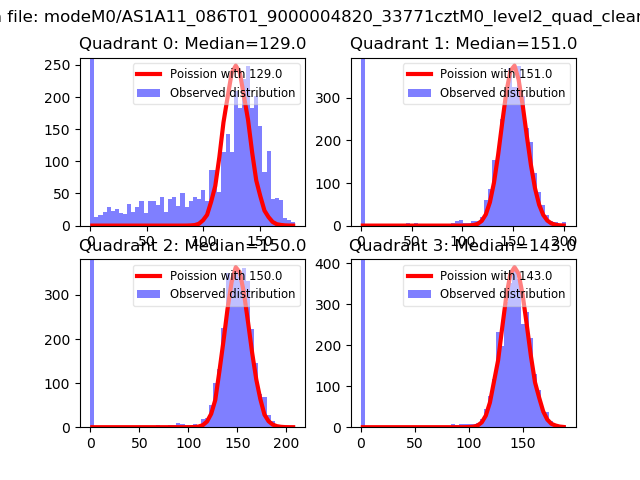 |
 |
| Quadrant-wise count rates Data is divided into 100 sec bins |
 |
|
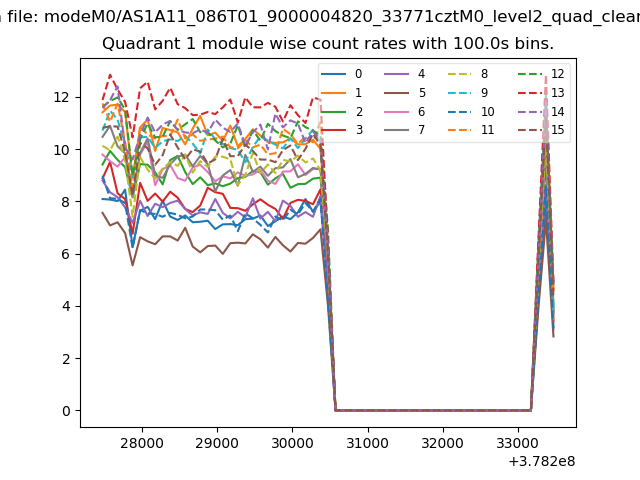
| Module-wise count rates for Quadrant A Data is divided into 100 sec bins |
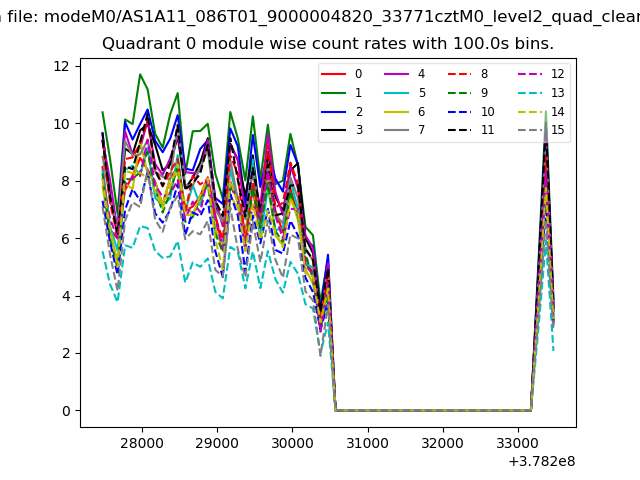 |
 |
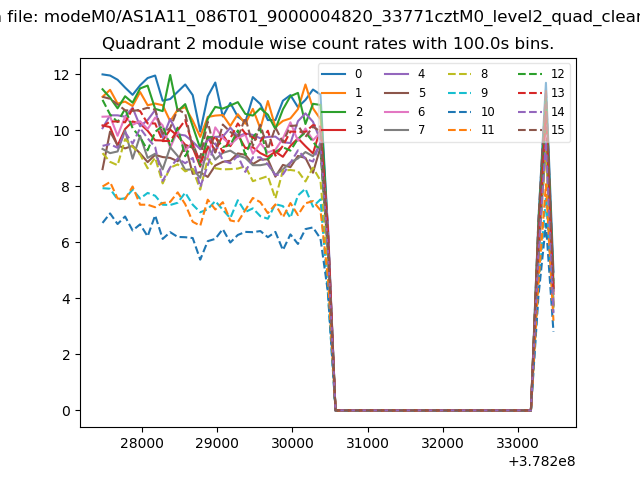
| Module-wise count rates for Quadrant B Data is divided into 100 sec bins |
 |
 |
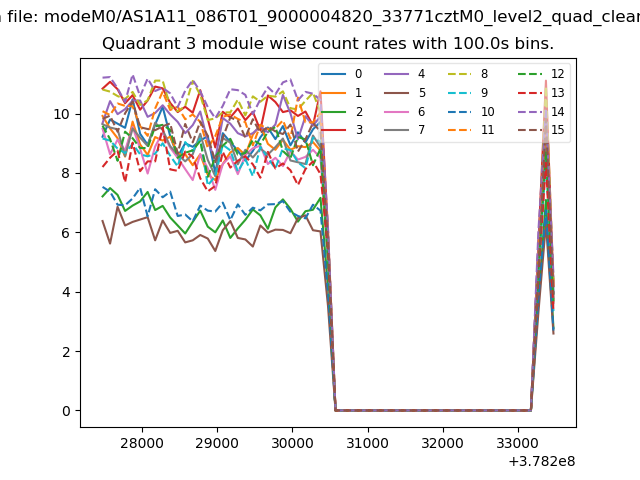
| Module-wise count rates for Quadrant C Data is divided into 100 sec bins |
 |
 |
| Module-wise count rates for Quadrant D Data is divided into 100 sec bins |
 |
 |
| Parameter | Plot |
|---|---|
| CZT HV Monitor | 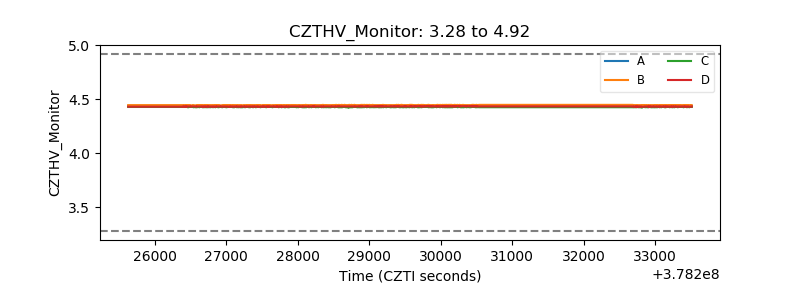 |
| D_VDD | 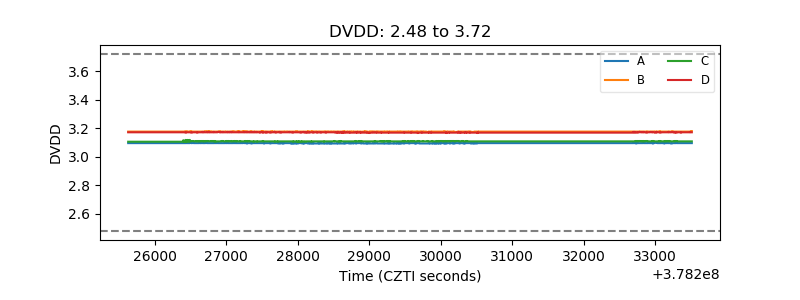 |
| Temperature 1 | 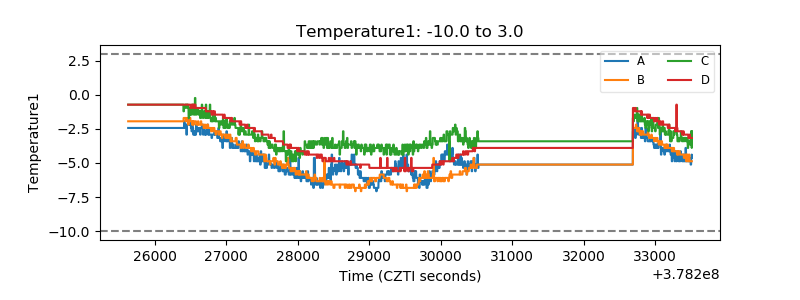 |
| Veto HV Monitor | 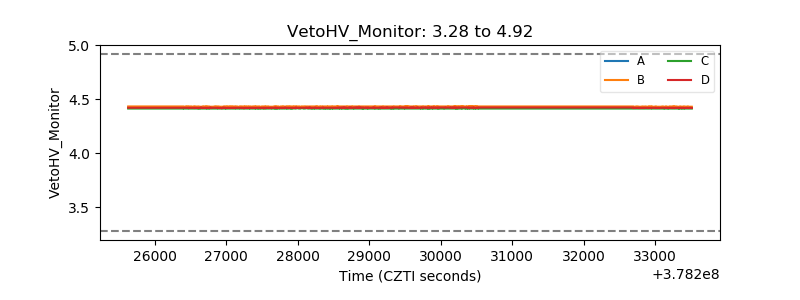 |
| Veto LLD | 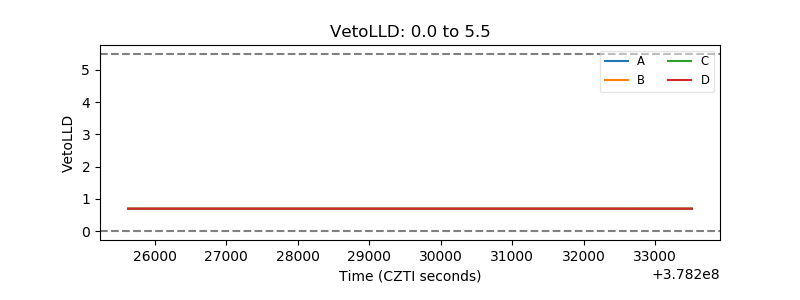 |
| Alpha Counter | 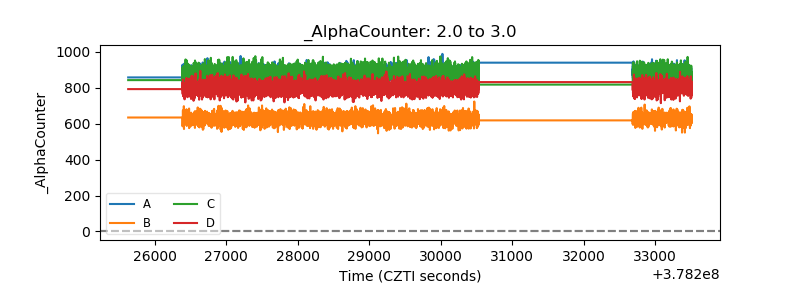 |
| _CPM_Rate |  |
| CZT Counter | 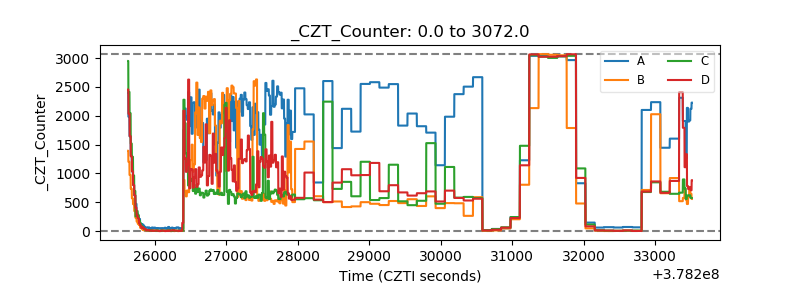 |
| +2.5 Volts monitor |  |
| +5 Volts monitor |  |
| _ROLL_ROT | 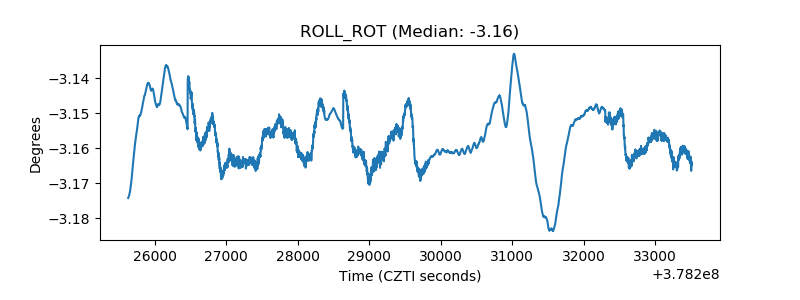 |
| _Roll_DEC | 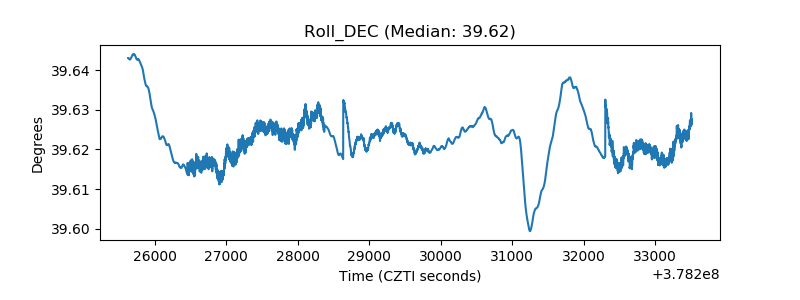 |
| _Roll_RA | 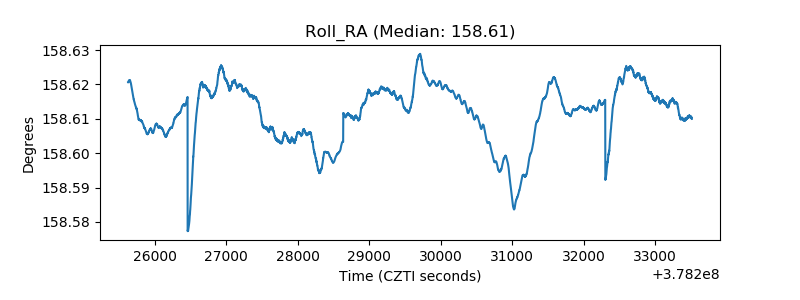 |
| Veto Counter | 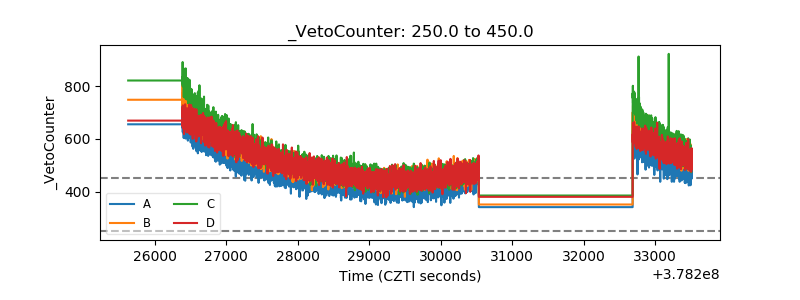 |