| Param | Original file | Final file |
|---|---|---|
| Filename | modeM0/AS1A11_086T01_9000004820_33773cztM0_level2.evt | modeM0/AS1A11_086T01_9000004820_33773cztM0_level2_quad_clean.evt |
| Size (bytes) | 548,858,880 | 90,478,080 |
| Size | 523.4 MB | 86.3 MB |
| Events in quadrant A | 4,648,446 | 583,860 |
| Events in quadrant B | 3,088,192 | 623,844 |
| Events in quadrant C | 3,123,966 | 624,878 |
| Events in quadrant D | 5,422,831 | 555,766 |
| Mode M9 | |||
|---|---|---|---|
| Quadrant | BADHDUFLAG | Total packets | Discarded packets |
| A | 0 | 39 | 0 |
| B | 0 | 39 | 0 |
| C | 0 | 39 | 0 |
| D | 0 | 40 | 0 |
| Mode SS | |||
|---|---|---|---|
| Quadrant | BADHDUFLAG | Total packets | Discarded packets |
| A | 0 | 100 | 0 |
| B | 0 | 100 | 0 |
| C | 0 | 100 | 0 |
| D | 0 | 100 | 0 |
| Mode M0 | |||
|---|---|---|---|
| Quadrant | BADHDUFLAG | Total packets | Discarded packets |
| A | 0 | 17265 | 3 |
| B | 0 | 12396 | 2 |
| C | 0 | 12595 | 2 |
| D | 0 | 19536 | 2 |
| Quadrant | Total seconds | Saturated seconds | Saturation percentage |
|---|---|---|---|
| A | 5018 | 567 | 11.299322% |
| B | 5018 | 131 | 2.610602% |
| C | 5018 | 87 | 1.733758% |
| D | 5018 | 635 | 12.654444% |
Noise dominated data is calculated using 1-second bins in cleaned event files. If a bin has >2000 counts, and if more than 50% of those come from <1% of pixels, then it is considered to be noise-dominated and hence unusable.
| Quadrant | # 1 sec bins | Bins with >0 counts | Bins with >2000 counts | High rate bins dominated by noise | Noise dominated (total time) | Noise dominated (detector-on time) | Marked lightcurve |
|---|---|---|---|---|---|---|---|
| A | 7052 | 5019 | 460 | 460 | 6.52% | 9.17% | 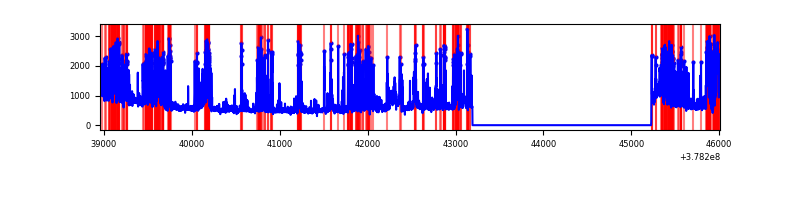 |
| B | 7052 | 5019 | 98 | 98 | 1.39% | 1.95% | 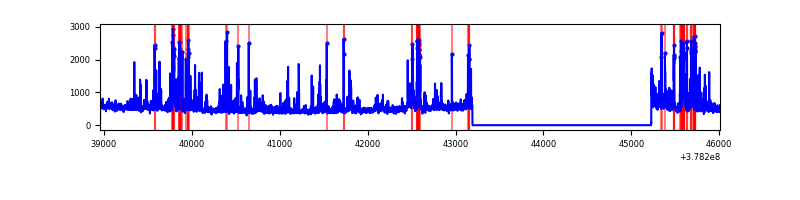 |
| C | 7052 | 5019 | 71 | 71 | 1.01% | 1.41% | 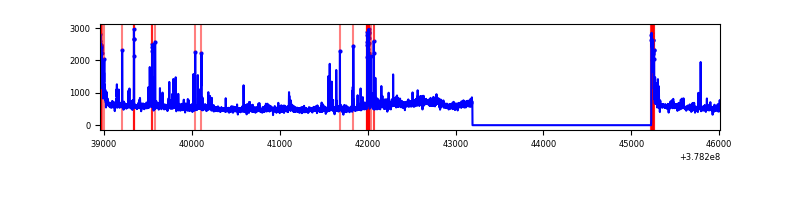 |
| D | 7052 | 5019 | 617 | 617 | 8.75% | 12.29% | 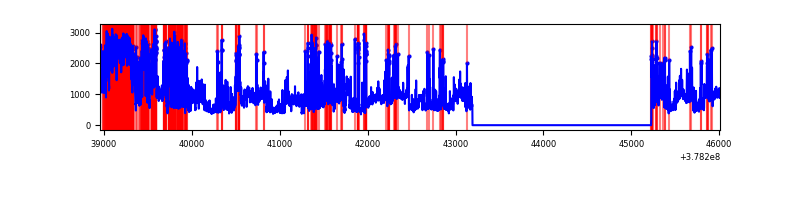 |
Top three noisy pixels from each quadrant. If the there are fewer than three noisy pixels in the level2.evt file, extra rows are filled as -1
| Pixel properties | Quadrant properties | ||||||
|---|---|---|---|---|---|---|---|
| Quadrant | DetID | PixID | Counts | Sigma | Mean | Median | Sigma |
| A | 15 | 237 | 1718501 | 14980.89 | 570 | 559 | 114.7 |
| A | 15 | 169 | 690162 | 6013.51 | 570 | 559 | 114.7 |
| A | 13 | 6 | 15523 | 130.49 | 570 | 559 | 114.7 |
| B | 5 | 172 | 507232 | 4438.48 | 598 | 584 | 114.1 |
| B | 4 | 81 | 49410 | 427.74 | 598 | 584 | 114.1 |
| B | 4 | 251 | 34703 | 298.9 | 598 | 584 | 114.1 |
| C | 15 | 214 | 219943 | 1632.31 | 590 | 597 | 134.4 |
| C | 9 | 187 | 198120 | 1469.91 | 590 | 597 | 134.4 |
| C | 3 | 233 | 197070 | 1462.09 | 590 | 597 | 134.4 |
| D | 8 | 195 | 1163293 | 7997.12 | 542 | 532 | 145.4 |
| D | 1 | 47 | 743210 | 5107.91 | 542 | 532 | 145.4 |
| D | 2 | 250 | 687721 | 4726.28 | 542 | 532 | 145.4 |
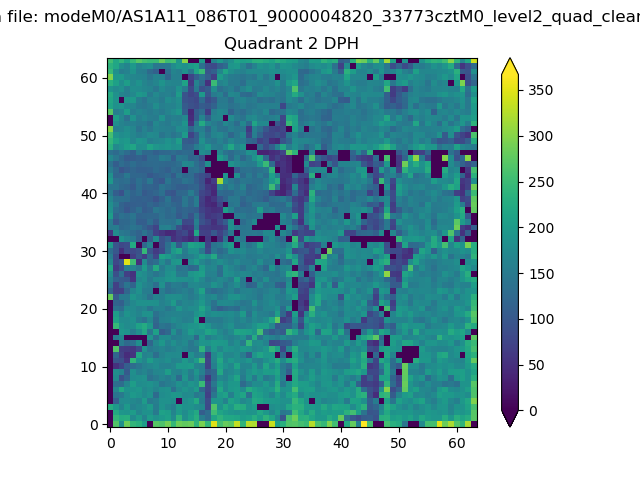
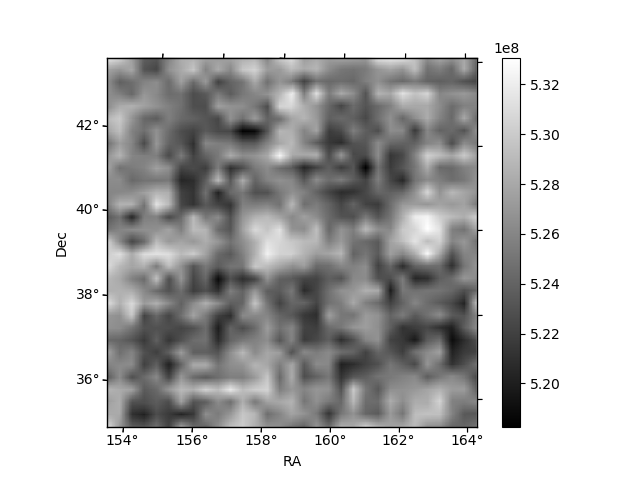
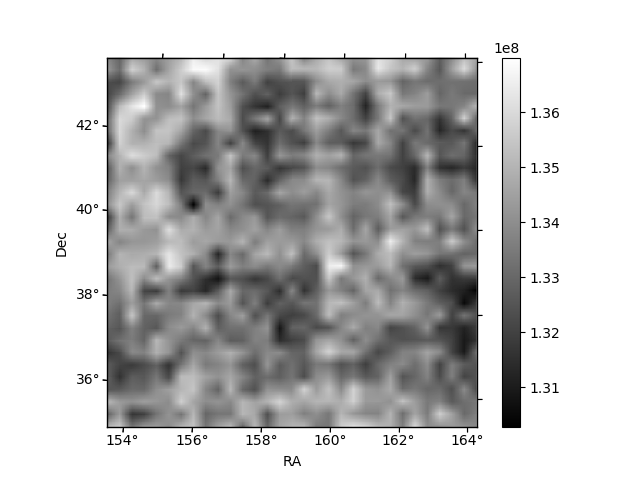
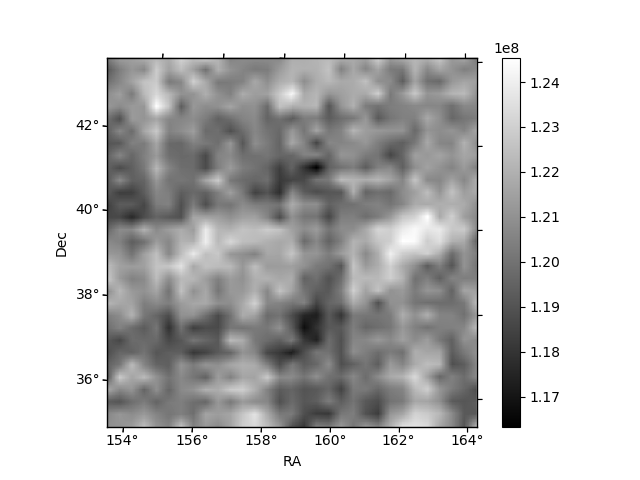
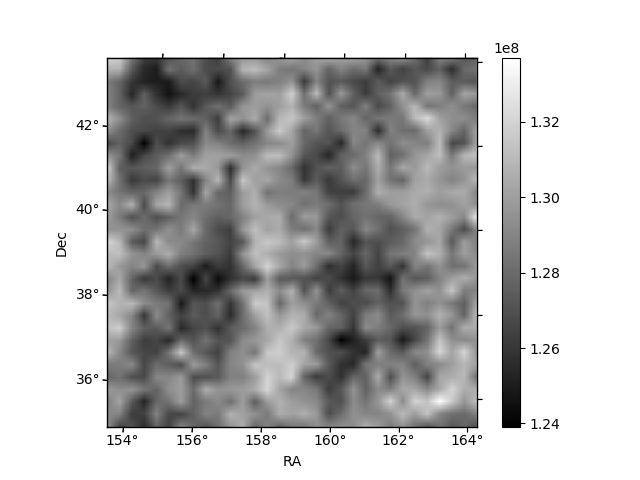
Histogram calculated using DETX and DETY for each event in the final _common_clean file
| Quadrant A | 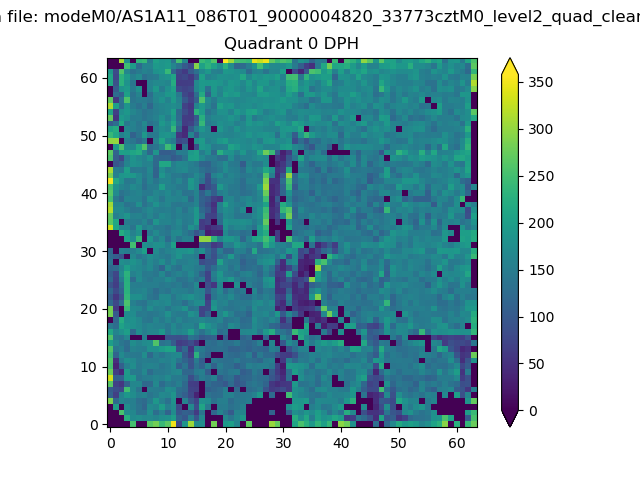 |
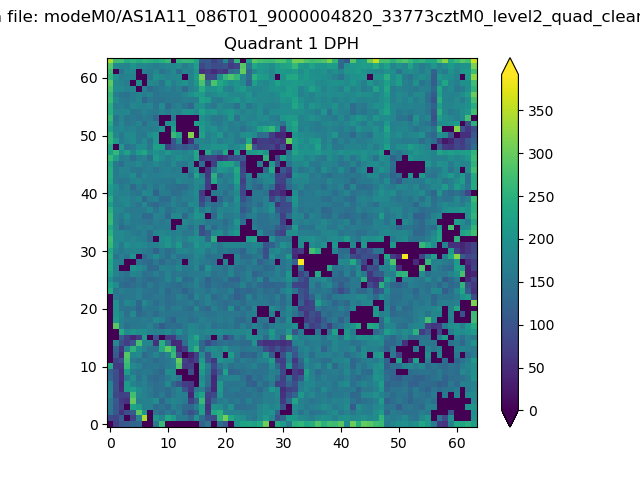 |
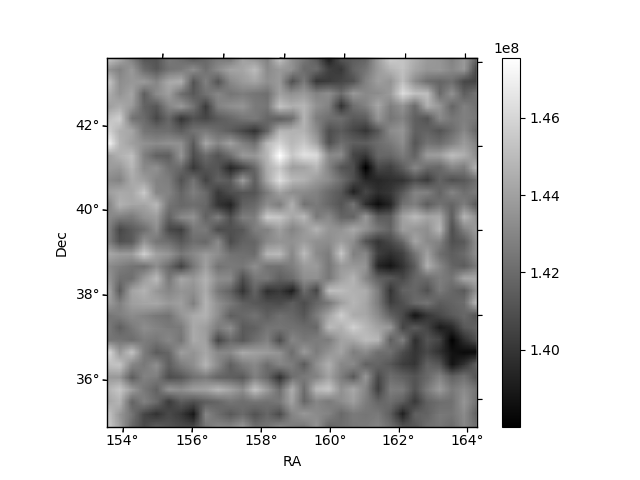
Quadrant B |
|---|---|---|---|
| Quadrant D | 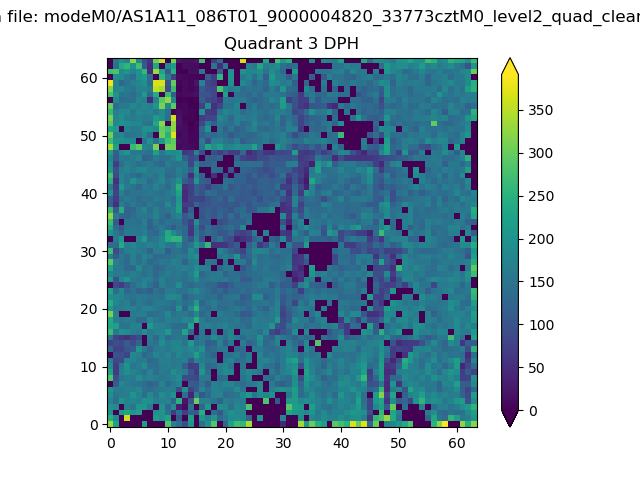 |
 |
Quadrant C |
| Plot type | Count rate plots | Images |
|---|---|---|
| Comparison with Poisson distribution Blue bars denote a histogram of data divided into 1 sec bins. Red curve is a Poisson curve with rate = median count rate of data. |
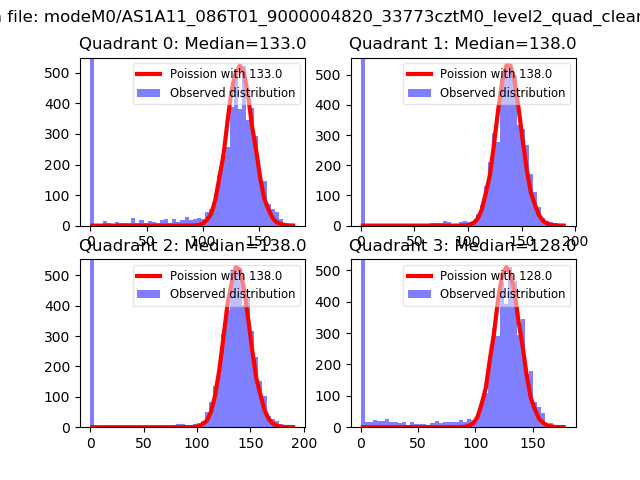 |
 |
| Quadrant-wise count rates Data is divided into 100 sec bins |
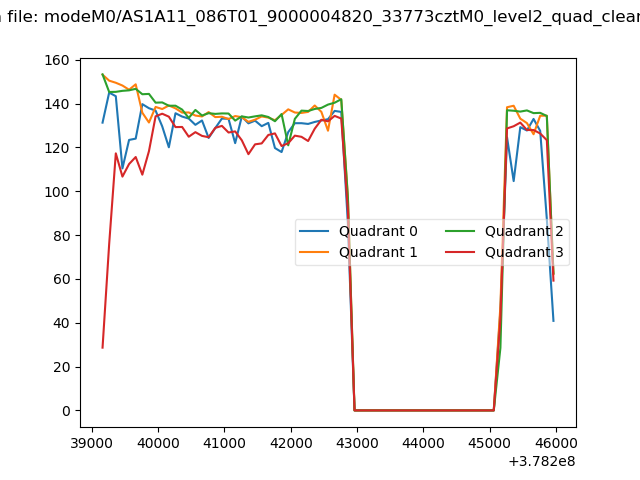 |
|
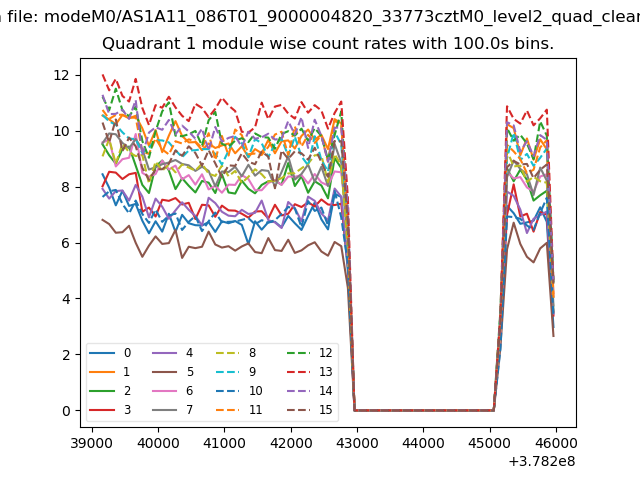
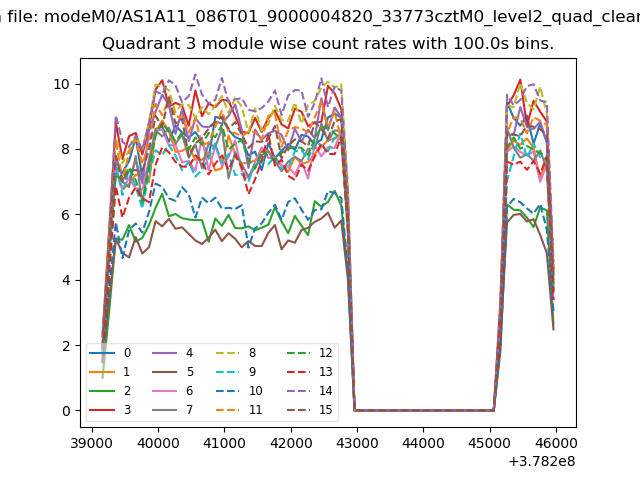
| Module-wise count rates for Quadrant A Data is divided into 100 sec bins |
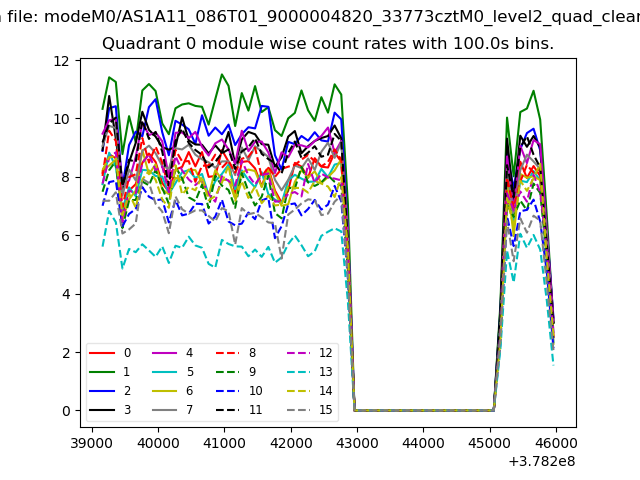 |
 |
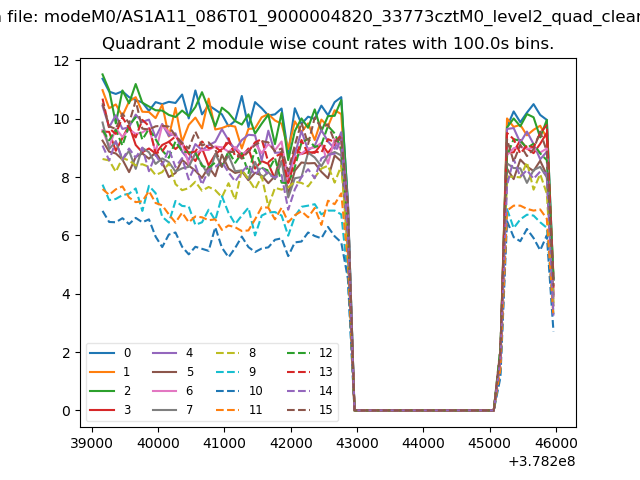
| Module-wise count rates for Quadrant B Data is divided into 100 sec bins |
 |
 |
| Module-wise count rates for Quadrant C Data is divided into 100 sec bins |
 |
 |
| Module-wise count rates for Quadrant D Data is divided into 100 sec bins |
 |
 |
| Parameter | Plot |
|---|---|
| CZT HV Monitor | 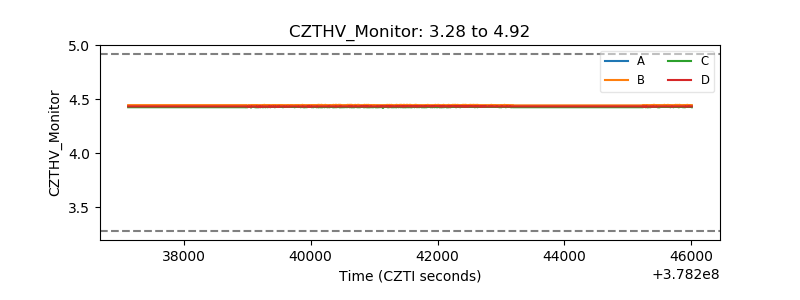 |
| D_VDD | 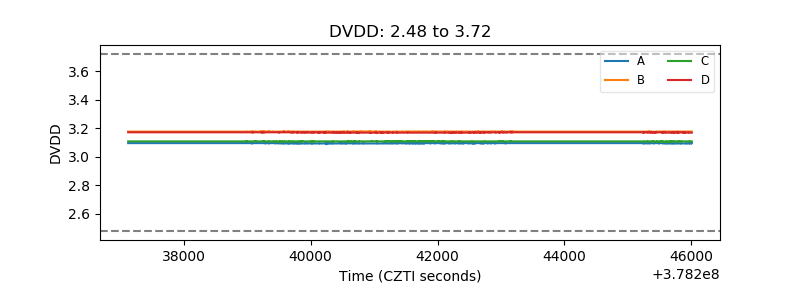 |
| Temperature 1 | 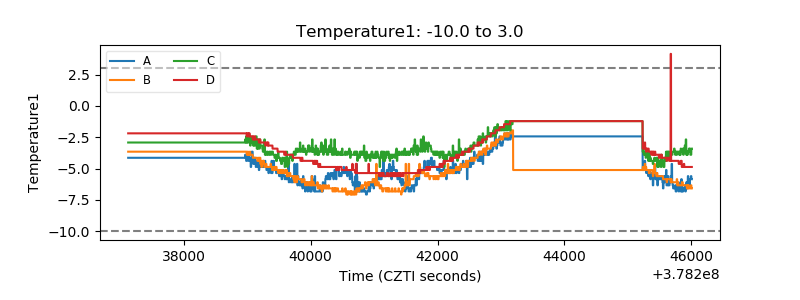 |
| Veto HV Monitor | 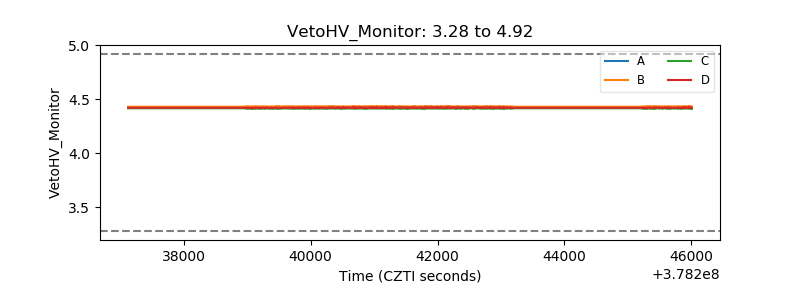 |
| Veto LLD | 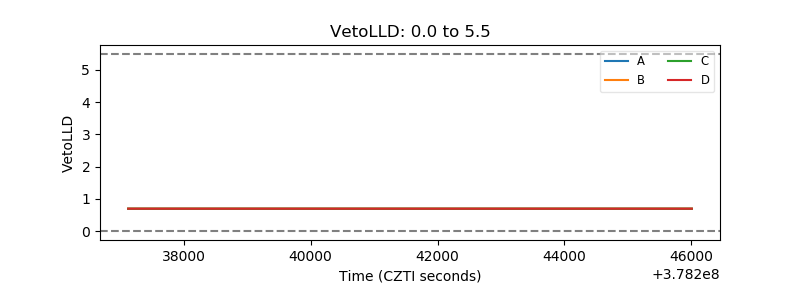 |
| Alpha Counter | 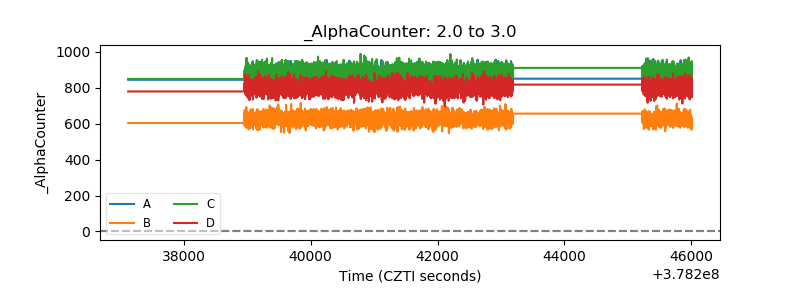 |
| _CPM_Rate | 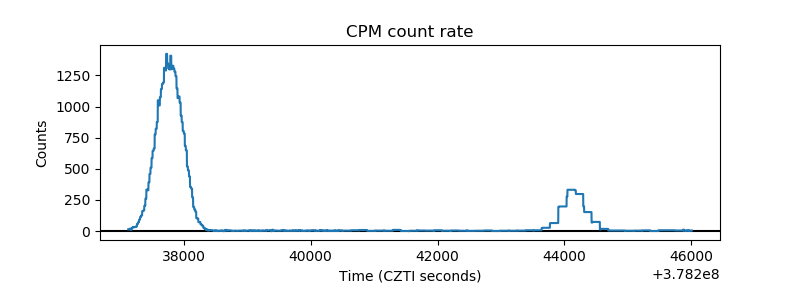 |
| CZT Counter |  |
| +2.5 Volts monitor |  |
| +5 Volts monitor |  |
| _ROLL_ROT | 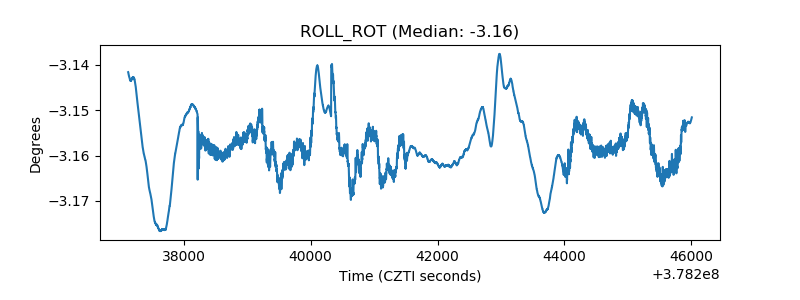 |
| _Roll_DEC | 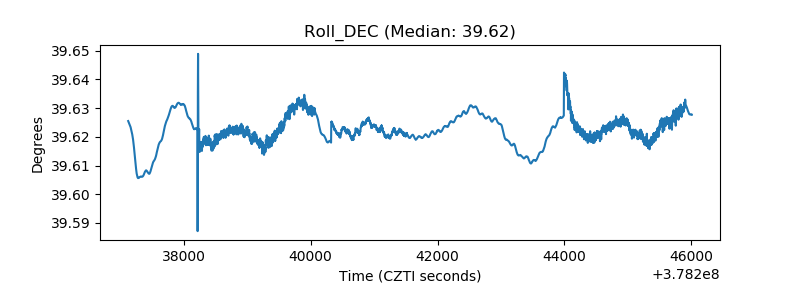 |
| _Roll_RA | 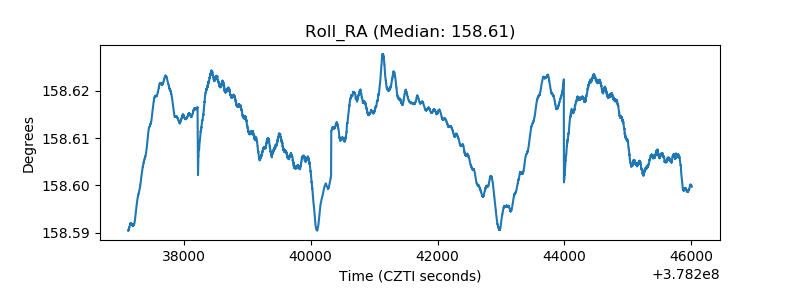 |
| Veto Counter | 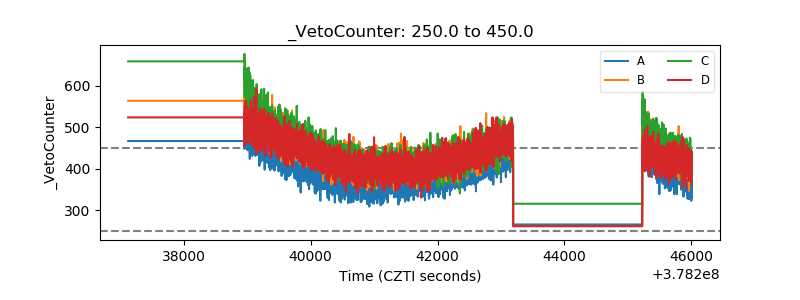 |