| Param | Original file | Final file |
|---|---|---|
| Filename | modeM0/AS1A11_086T01_9000004820_33775cztM0_level2.evt | modeM0/AS1A11_086T01_9000004820_33775cztM0_level2_quad_clean.evt |
| Size (bytes) | 546,082,560 | 76,976,640 |
| Size | 520.8 MB | 73.4 MB |
| Events in quadrant A | 5,073,421 | 473,158 |
| Events in quadrant B | 3,457,803 | 492,719 |
| Events in quadrant C | 2,961,507 | 499,491 |
| Events in quadrant D | 4,660,580 | 467,706 |
| Mode M9 | |||
|---|---|---|---|
| Quadrant | BADHDUFLAG | Total packets | Discarded packets |
| A | 0 | 26 | 0 |
| B | 0 | 26 | 0 |
| C | 0 | 26 | 0 |
| D | 0 | 27 | 0 |
| Mode SS | |||
|---|---|---|---|
| Quadrant | BADHDUFLAG | Total packets | Discarded packets |
| A | 0 | 116 | 0 |
| B | 0 | 116 | 0 |
| C | 0 | 116 | 0 |
| D | 0 | 116 | 0 |
| Mode M0 | |||
|---|---|---|---|
| Quadrant | BADHDUFLAG | Total packets | Discarded packets |
| A | 0 | 19054 | 3 |
| B | 0 | 14025 | 2 |
| C | 0 | 12220 | 2 |
| D | 0 | 17837 | 2 |
| Quadrant | Total seconds | Saturated seconds | Saturation percentage |
|---|---|---|---|
| A | 5687 | 484 | 8.510638% |
| B | 5687 | 193 | 3.393705% |
| C | 5687 | 33 | 0.580271% |
| D | 5687 | 223 | 3.921224% |
Noise dominated data is calculated using 1-second bins in cleaned event files. If a bin has >2000 counts, and if more than 50% of those come from <1% of pixels, then it is considered to be noise-dominated and hence unusable.
| Quadrant | # 1 sec bins | Bins with >0 counts | Bins with >2000 counts | High rate bins dominated by noise | Noise dominated (total time) | Noise dominated (detector-on time) | Marked lightcurve |
|---|---|---|---|---|---|---|---|
| A | 7088 | 5688 | 347 | 347 | 4.90% | 6.10% | 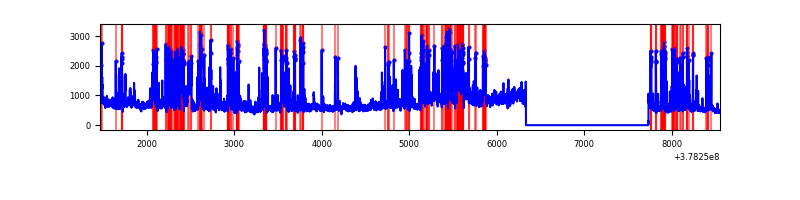 |
| B | 7088 | 5688 | 133 | 133 | 1.88% | 2.34% | 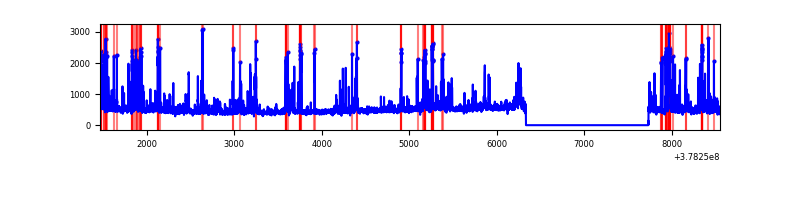 |
| C | 7088 | 5688 | 27 | 27 | 0.38% | 0.47% | 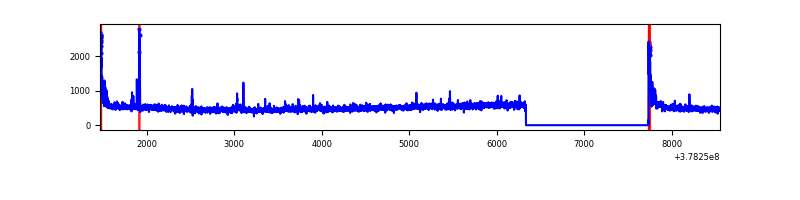 |
| D | 7088 | 5688 | 191 | 191 | 2.69% | 3.36% | 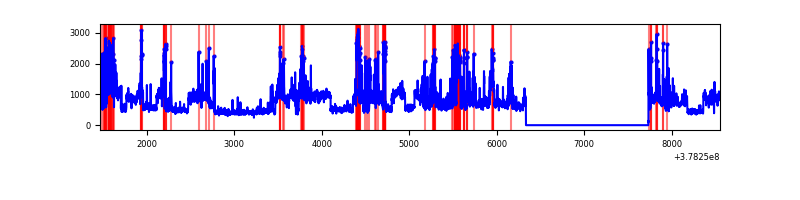 |
Top three noisy pixels from each quadrant. If the there are fewer than three noisy pixels in the level2.evt file, extra rows are filled as -1
| Pixel properties | Quadrant properties | ||||||
|---|---|---|---|---|---|---|---|
| Quadrant | DetID | PixID | Counts | Sigma | Mean | Median | Sigma |
| A | 15 | 237 | 1522437 | 11996.07 | 632 | 620 | 126.9 |
| A | 15 | 169 | 1077296 | 8487.14 | 632 | 620 | 126.9 |
| A | 13 | 6 | 14669 | 110.74 | 632 | 620 | 126.9 |
| B | 5 | 172 | 540436 | 4340.21 | 649 | 635 | 124.4 |
| B | 4 | 251 | 163778 | 1311.73 | 649 | 635 | 124.4 |
| B | 4 | 232 | 39220 | 310.24 | 649 | 635 | 124.4 |
| C | 15 | 214 | 249727 | 1680.3 | 642 | 649 | 148.2 |
| C | 0 | 10 | 99833 | 669.1 | 642 | 649 | 148.2 |
| C | 14 | 67 | 25695 | 168.96 | 642 | 649 | 148.2 |
| D | 8 | 195 | 1284560 | 8256.21 | 632 | 615 | 155.5 |
| D | 13 | 249 | 278583 | 1787.43 | 632 | 615 | 155.5 |
| D | 2 | 250 | 106582 | 681.4 | 632 | 615 | 155.5 |
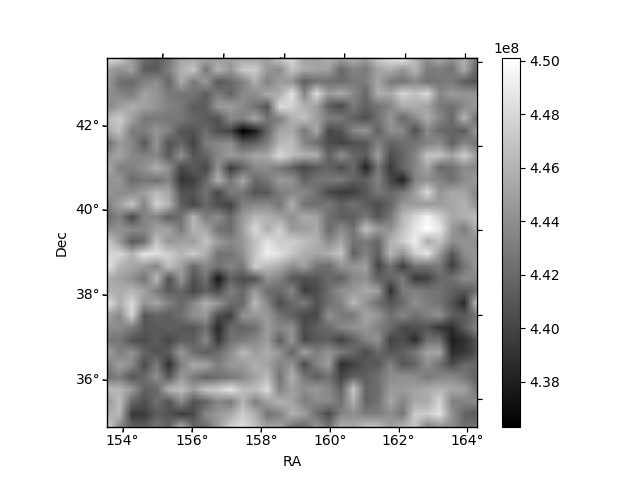
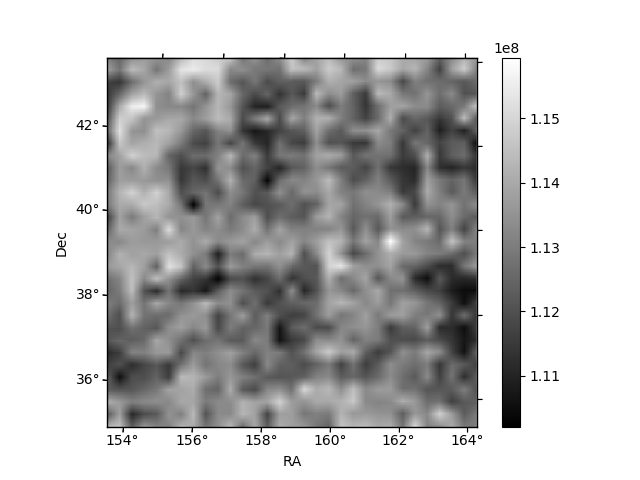
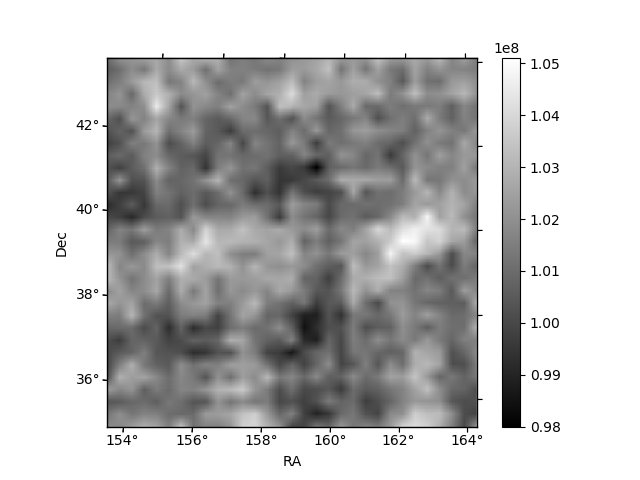
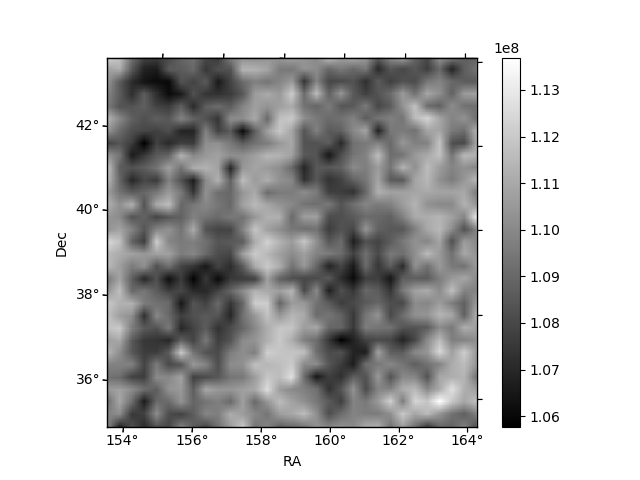
Histogram calculated using DETX and DETY for each event in the final _common_clean file
| Quadrant A | 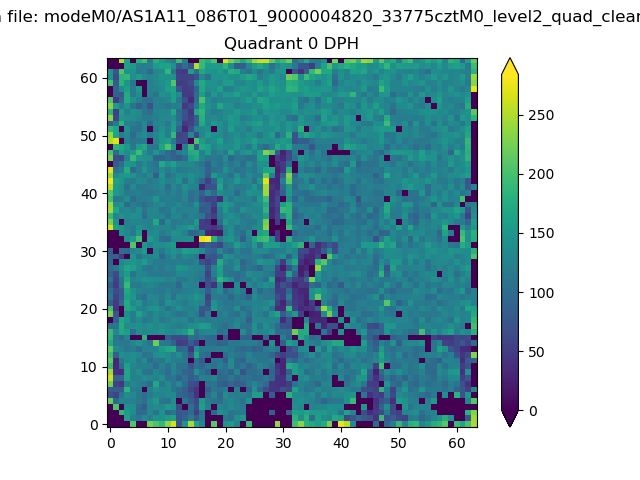 |
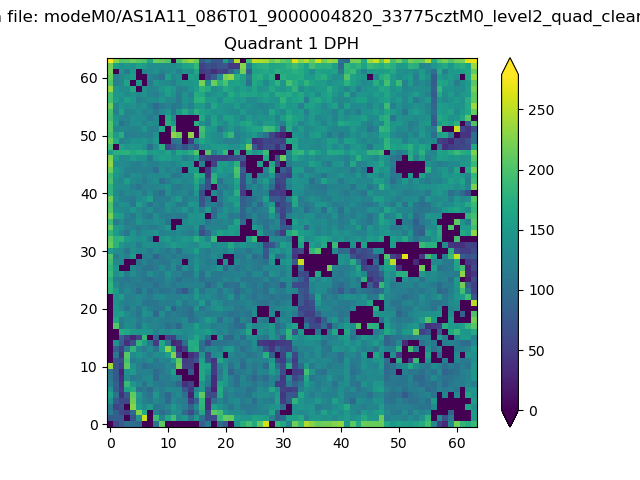 |
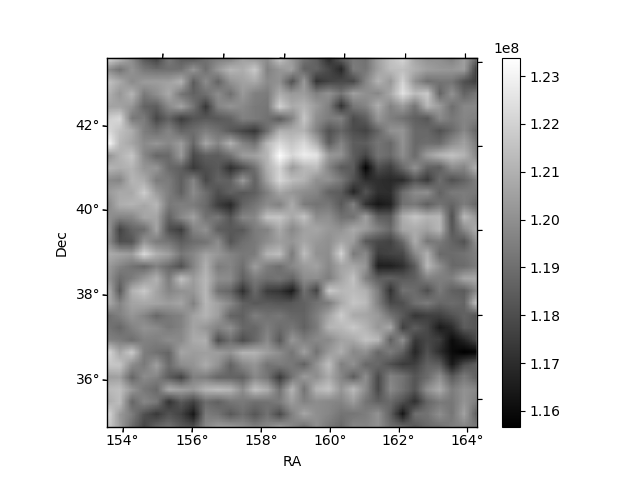
Quadrant B |
|---|---|---|---|
| Quadrant D | 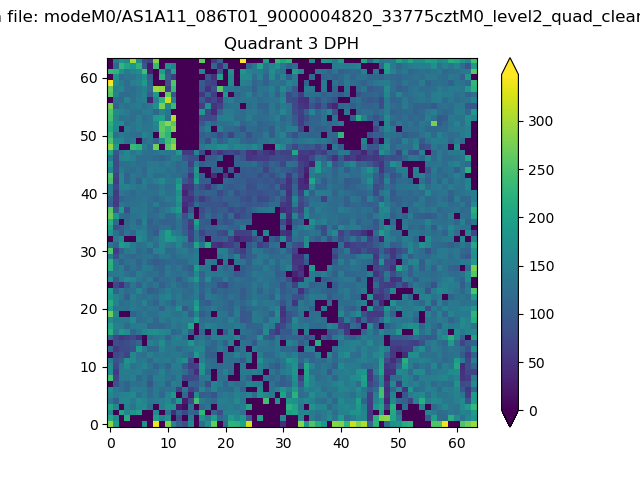 |
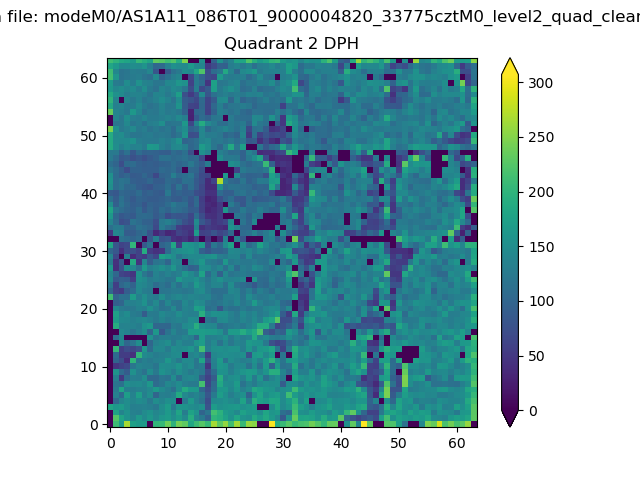 |
Quadrant C |
| Plot type | Count rate plots | Images |
|---|---|---|
| Comparison with Poisson distribution Blue bars denote a histogram of data divided into 1 sec bins. Red curve is a Poisson curve with rate = median count rate of data. |
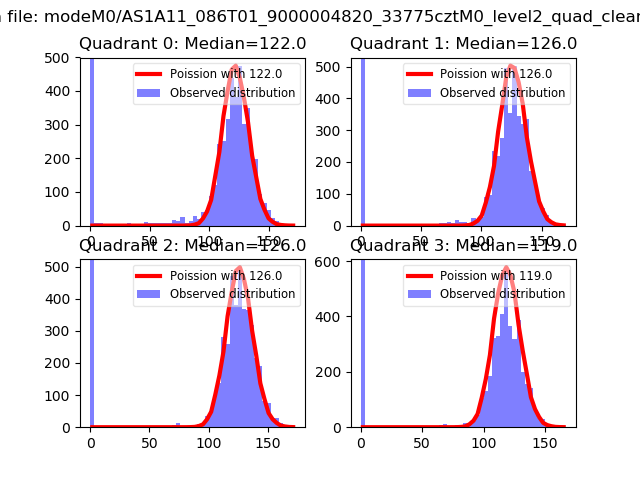 |
 |
| Quadrant-wise count rates Data is divided into 100 sec bins |
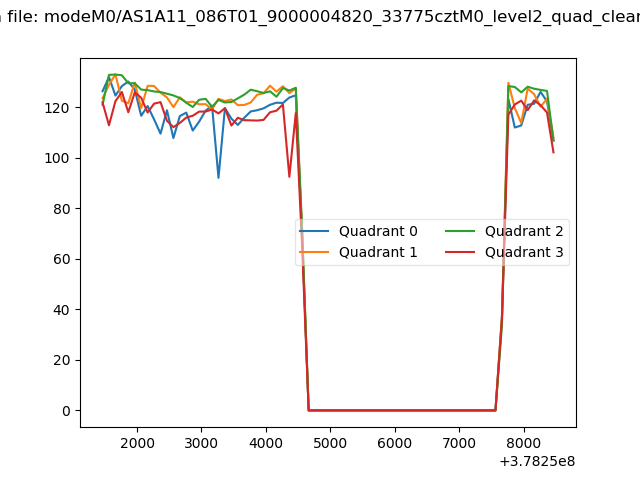 |
|
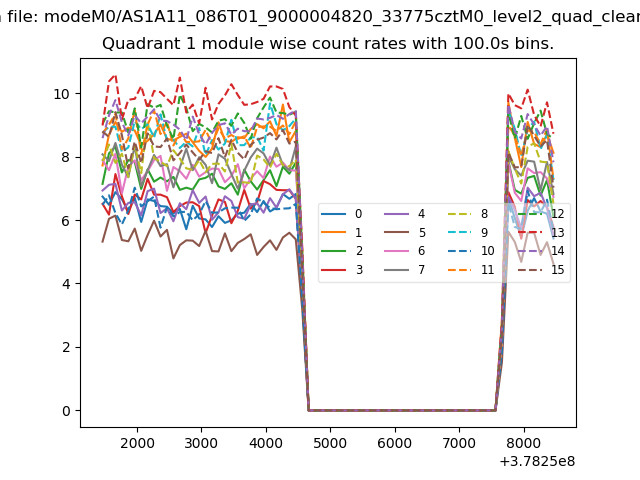
| Module-wise count rates for Quadrant A Data is divided into 100 sec bins |
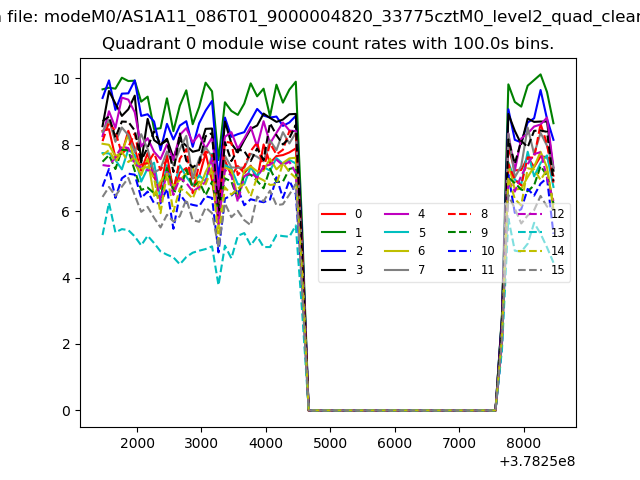 |
 |
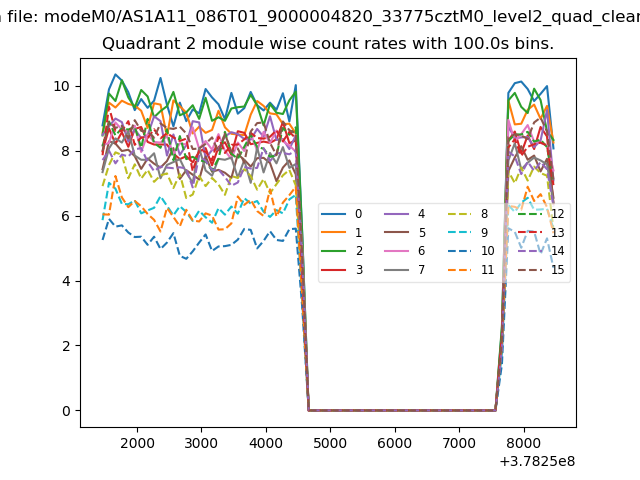
| Module-wise count rates for Quadrant B Data is divided into 100 sec bins |
 |
 |
| Module-wise count rates for Quadrant C Data is divided into 100 sec bins |
 |
 |
| Module-wise count rates for Quadrant D Data is divided into 100 sec bins |
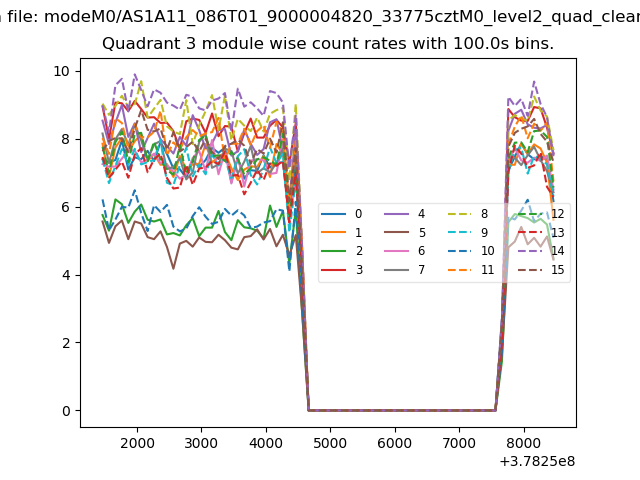 |
 |
| Parameter | Plot |
|---|---|
| CZT HV Monitor | 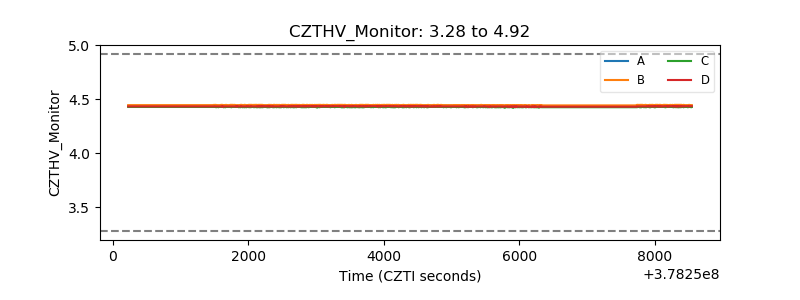 |
| D_VDD | 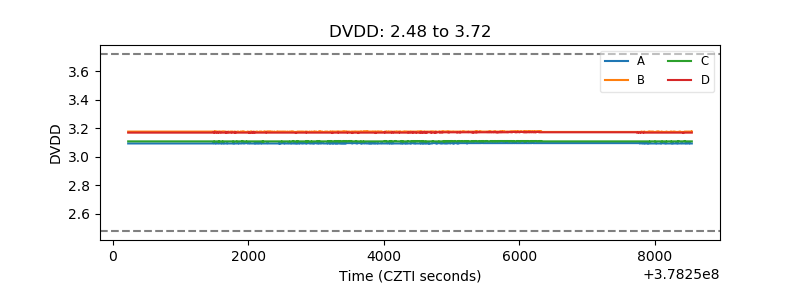 |
| Temperature 1 | 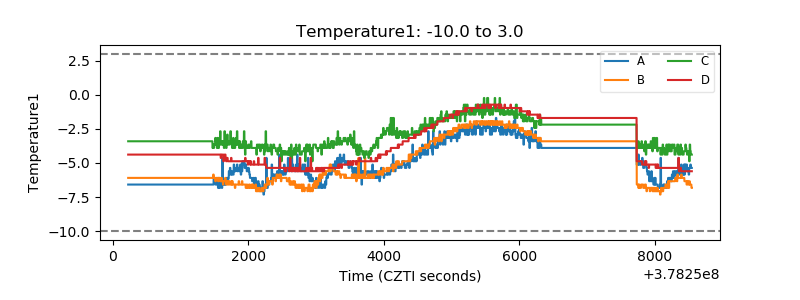 |
| Veto HV Monitor | 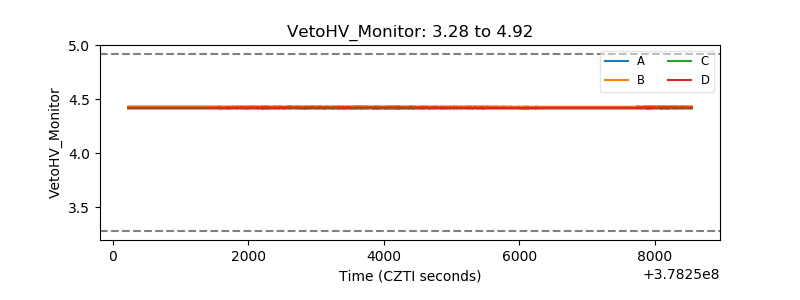 |
| Veto LLD | 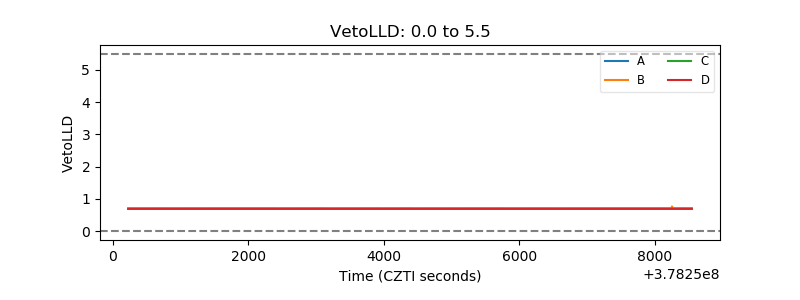 |
| Alpha Counter | 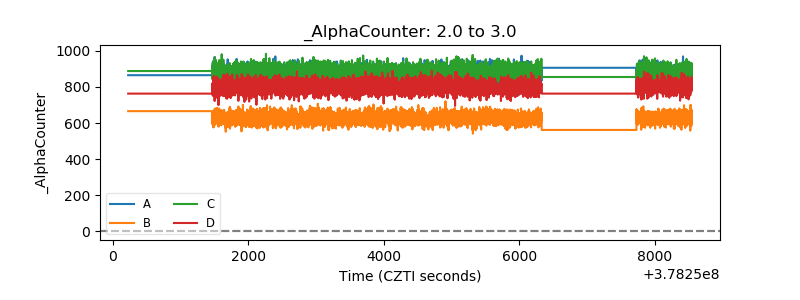 |
| _CPM_Rate | 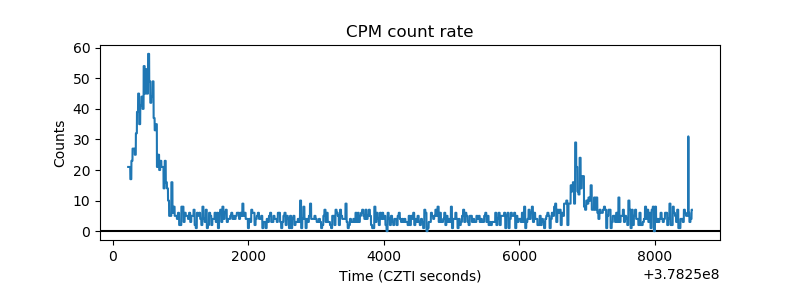 |
| CZT Counter | 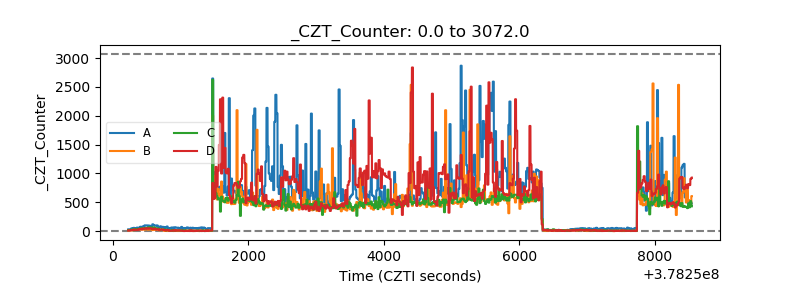 |
| +2.5 Volts monitor |  |
| +5 Volts monitor |  |
| _ROLL_ROT | 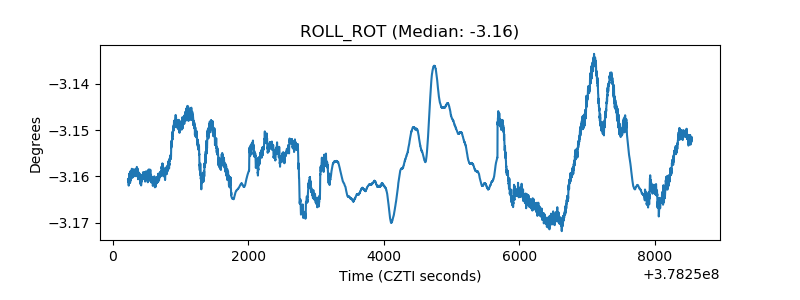 |
| _Roll_DEC | 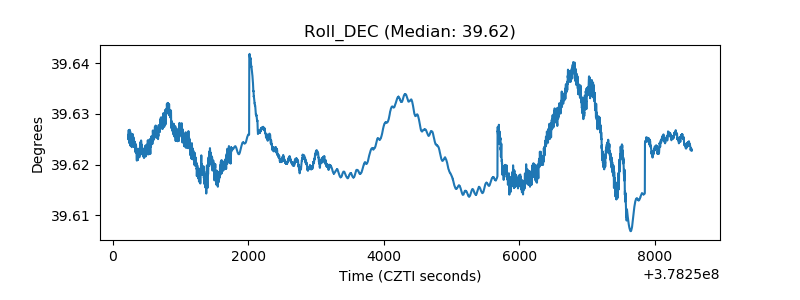 |
| _Roll_RA | 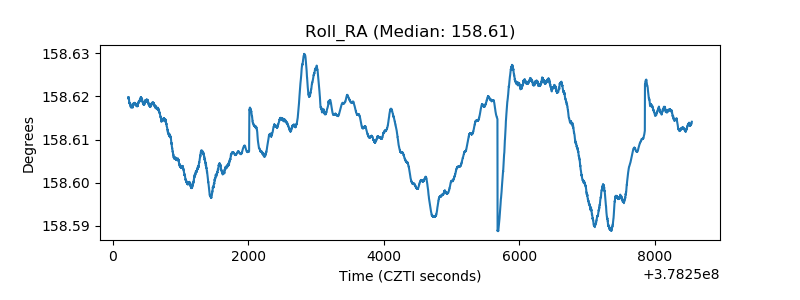 |
| Veto Counter | 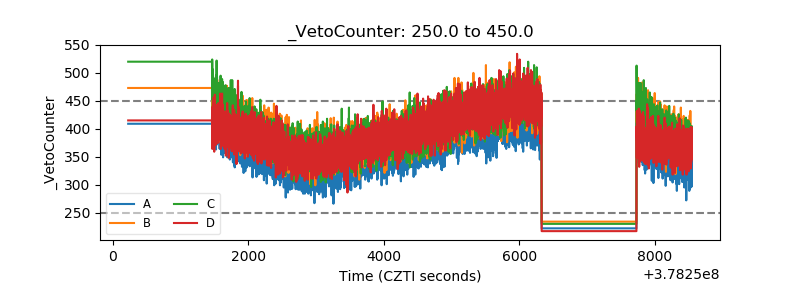 |