| Param | Original file | Final file |
|---|---|---|
| Filename | modeM0/AS1A11_086T01_9000004820_33776cztM0_level2.evt | modeM0/AS1A11_086T01_9000004820_33776cztM0_level2_quad_clean.evt |
| Size (bytes) | 507,346,560 | 70,511,040 |
| Size | 483.8 MB | 67.2 MB |
| Events in quadrant A | 4,151,182 | 423,861 |
| Events in quadrant B | 3,872,848 | 438,255 |
| Events in quadrant C | 3,026,195 | 450,928 |
| Events in quadrant D | 3,928,271 | 423,310 |
| Mode M9 | |||
|---|---|---|---|
| Quadrant | BADHDUFLAG | Total packets | Discarded packets |
| A | 0 | 27 | 9 |
| B | 0 | 26 | 10 |
| C | 0 | 27 | 11 |
| D | 0 | 27 | 9 |
| Mode SS | |||
|---|---|---|---|
| Quadrant | BADHDUFLAG | Total packets | Discarded packets |
| A | 0 | 123 | 5 |
| B | 0 | 123 | 11 |
| C | 0 | 124 | 12 |
| D | 0 | 124 | 8 |
| Mode M0 | |||
|---|---|---|---|
| Quadrant | BADHDUFLAG | Total packets | Discarded packets |
| A | 0 | 17621 | 1412 |
| B | 0 | 16635 | 1284 |
| C | 0 | 13446 | 846 |
| D | 0 | 16839 | 1224 |
| Quadrant | Total seconds | Saturated seconds | Saturation percentage |
|---|---|---|---|
| A | 5694 | 385 | 6.761503% |
| B | 5689 | 320 | 5.624890% |
| C | 5732 | 27 | 0.471040% |
| D | 5681 | 93 | 1.637036% |
Noise dominated data is calculated using 1-second bins in cleaned event files. If a bin has >2000 counts, and if more than 50% of those come from <1% of pixels, then it is considered to be noise-dominated and hence unusable.
| Quadrant | # 1 sec bins | Bins with >0 counts | Bins with >2000 counts | High rate bins dominated by noise | Noise dominated (total time) | Noise dominated (detector-on time) | Marked lightcurve |
|---|---|---|---|---|---|---|---|
| A | 7266 | 5878 | 259 | 259 | 3.56% | 4.41% | 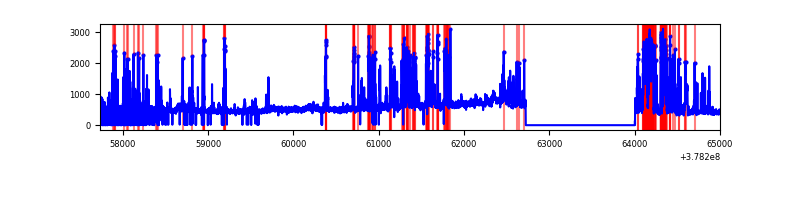 |
| B | 7266 | 5879 | 215 | 215 | 2.96% | 3.66% | 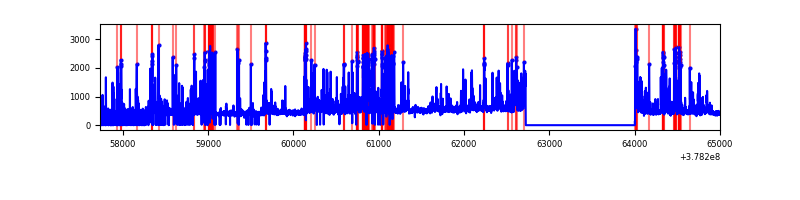 |
| C | 7266 | 5911 | 20 | 20 | 0.28% | 0.34% | 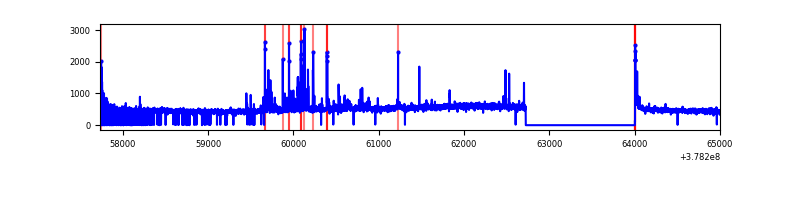 |
| D | 7266 | 5883 | 65 | 65 | 0.89% | 1.10% | 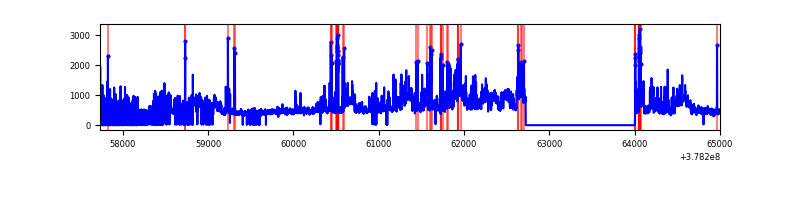 |
Top three noisy pixels from each quadrant. If the there are fewer than three noisy pixels in the level2.evt file, extra rows are filled as -1
| Pixel properties | Quadrant properties | ||||||
|---|---|---|---|---|---|---|---|
| Quadrant | DetID | PixID | Counts | Sigma | Mean | Median | Sigma |
| A | 15 | 237 | 1230687 | 9632.11 | 634 | 622 | 127.7 |
| A | 15 | 169 | 437958 | 3424.59 | 634 | 622 | 127.7 |
| A | 13 | 6 | 16047 | 120.79 | 634 | 622 | 127.7 |
| B | 5 | 172 | 895116 | 7207.71 | 639 | 621 | 124.1 |
| B | 0 | 190 | 87033 | 696.3 | 639 | 621 | 124.1 |
| B | 4 | 171 | 83507 | 667.88 | 639 | 621 | 124.1 |
| C | 15 | 214 | 248640 | 1676.63 | 641 | 647 | 147.9 |
| C | 9 | 187 | 76737 | 514.43 | 641 | 647 | 147.9 |
| C | 14 | 254 | 70153 | 469.92 | 641 | 647 | 147.9 |
| D | 8 | 195 | 883622 | 5702.57 | 633 | 616 | 154.8 |
| D | 2 | 250 | 144726 | 930.68 | 633 | 616 | 154.8 |
| D | 1 | 47 | 118659 | 762.34 | 633 | 616 | 154.8 |
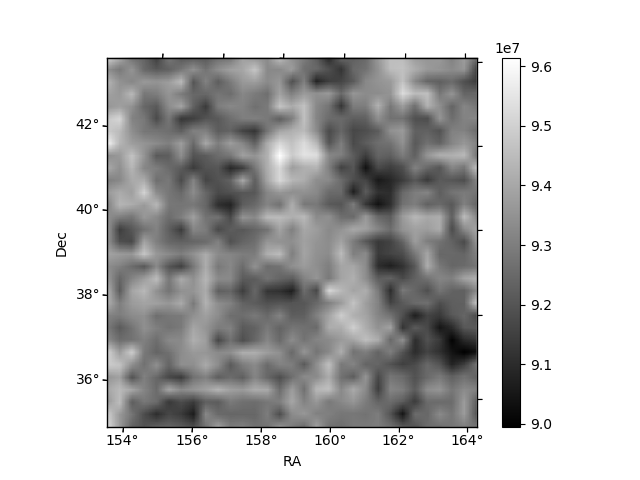
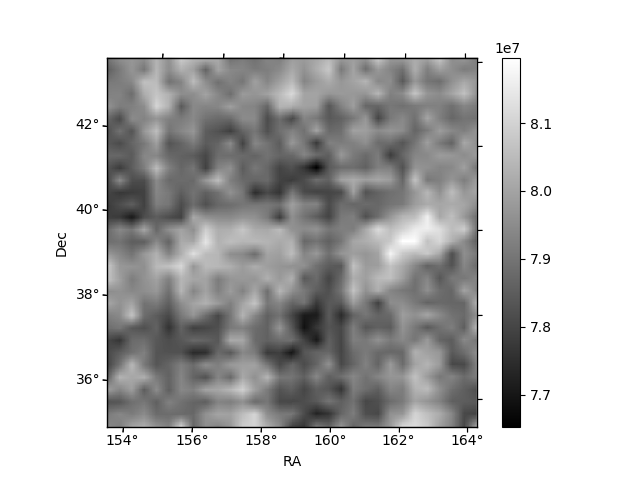
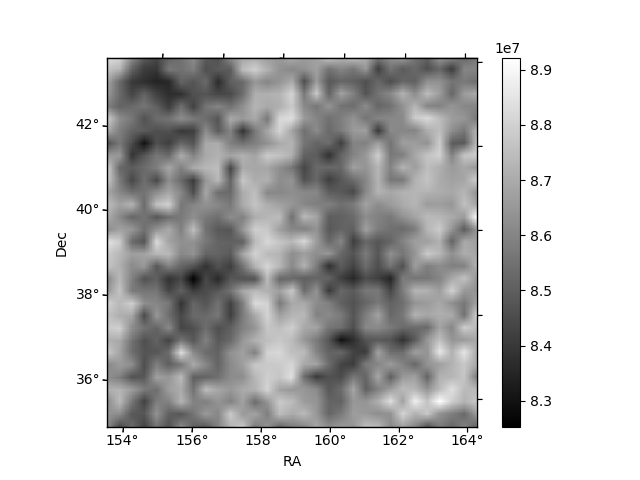
Histogram calculated using DETX and DETY for each event in the final _common_clean file
| Quadrant A | 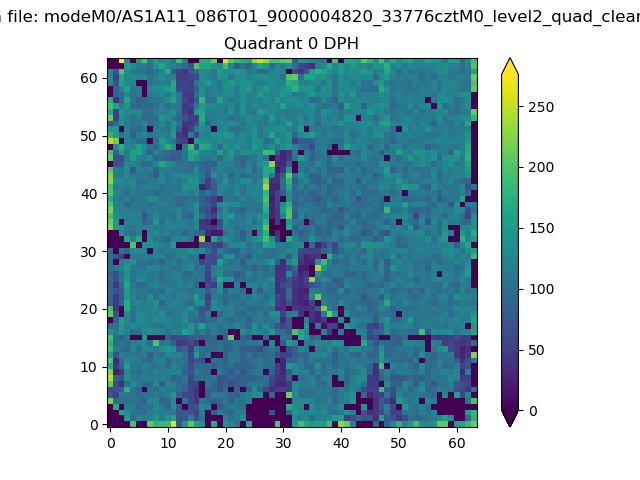 |
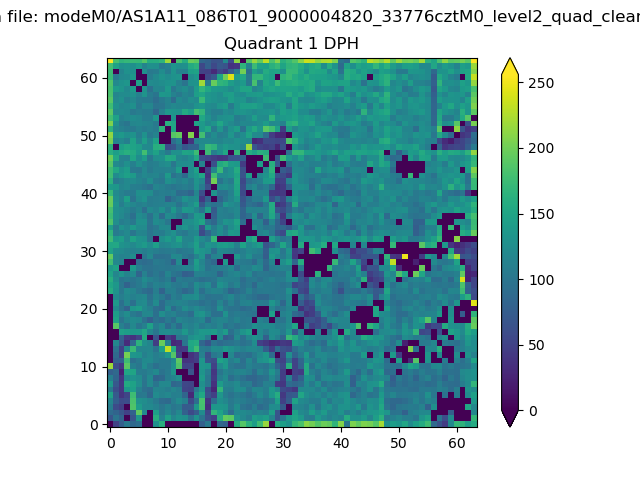 |
Quadrant B |
|---|---|---|---|
| Quadrant D |  |
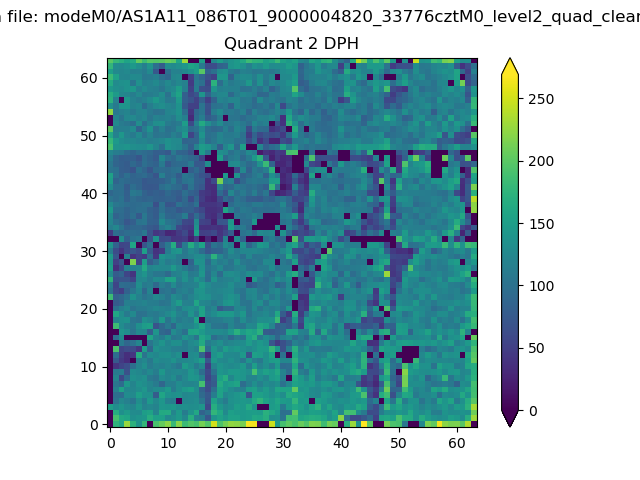 |
Quadrant C |
| Plot type | Count rate plots | Images |
|---|---|---|
| Comparison with Poisson distribution Blue bars denote a histogram of data divided into 1 sec bins. Red curve is a Poisson curve with rate = median count rate of data. |
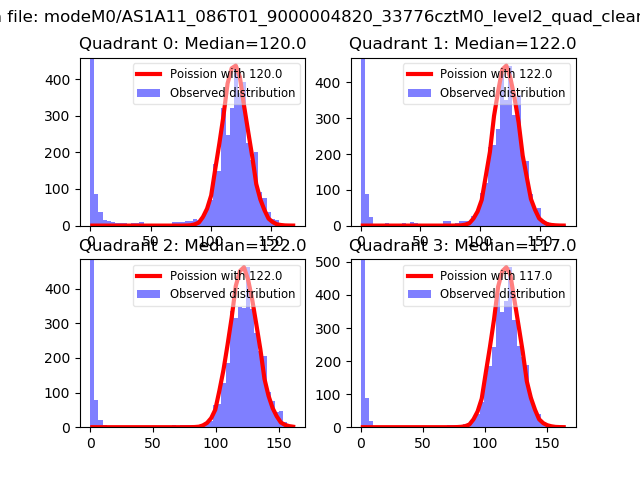 |
 |
| Quadrant-wise count rates Data is divided into 100 sec bins |
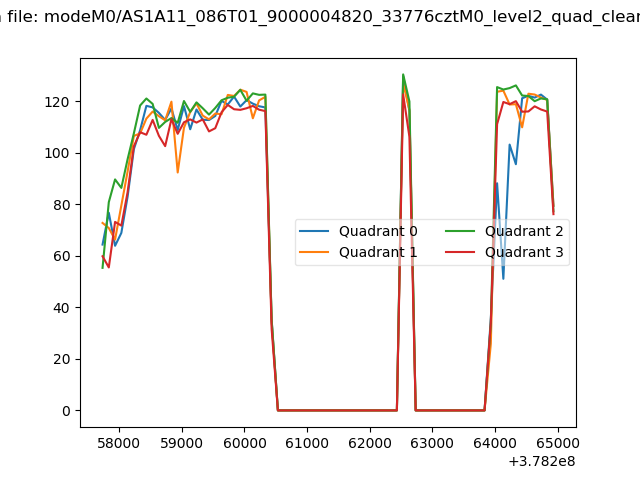 |
|
| Module-wise count rates for Quadrant A Data is divided into 100 sec bins |
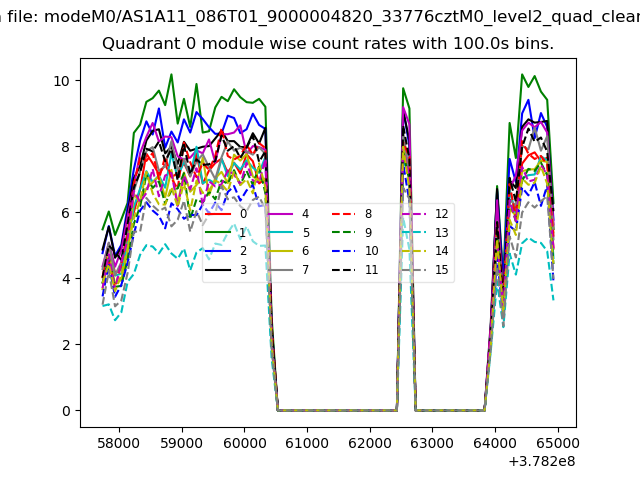 |
 |
| Module-wise count rates for Quadrant B Data is divided into 100 sec bins |
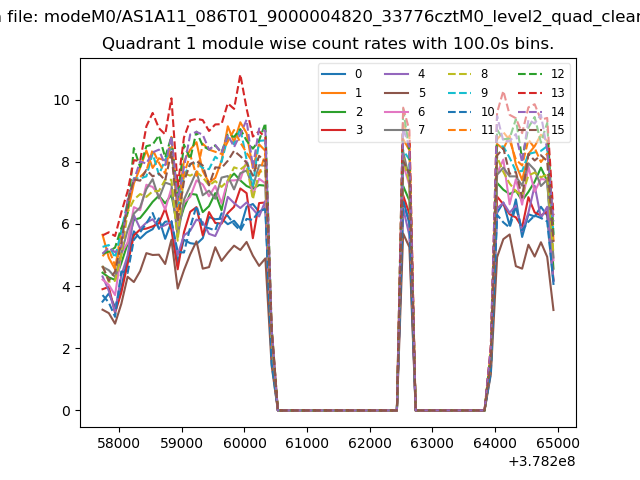 |
 |
| Module-wise count rates for Quadrant C Data is divided into 100 sec bins |
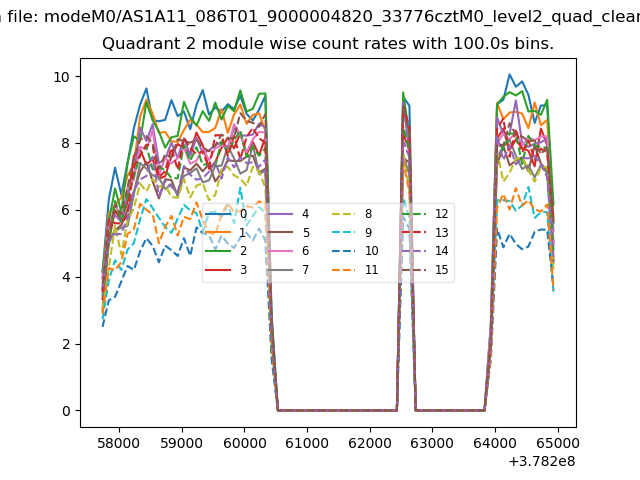 |
 |
| Module-wise count rates for Quadrant D Data is divided into 100 sec bins |
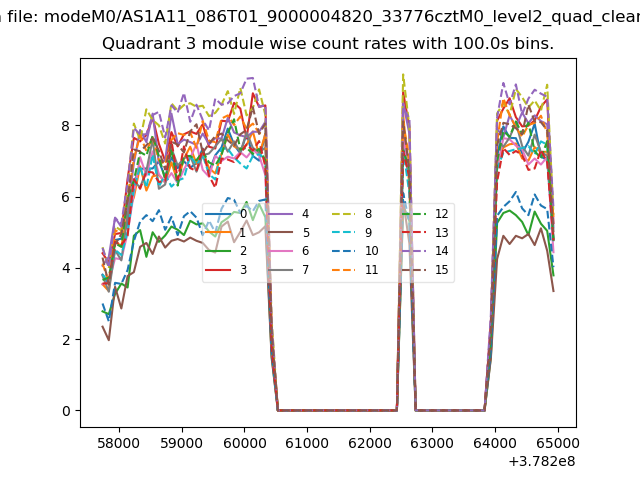 |
 |
| Parameter | Plot |
|---|---|
| CZT HV Monitor | 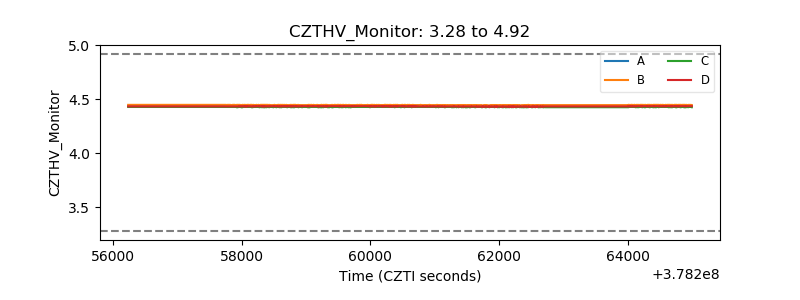 |
| D_VDD | 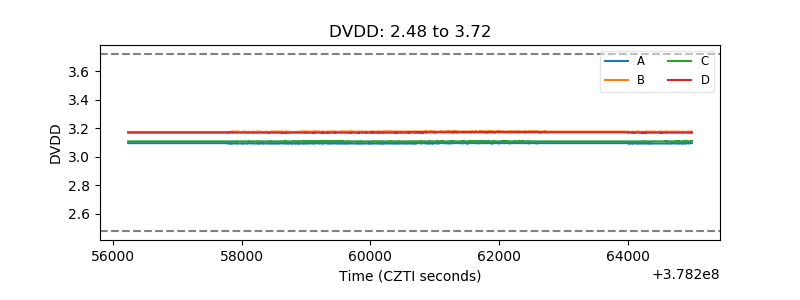 |
| Temperature 1 | 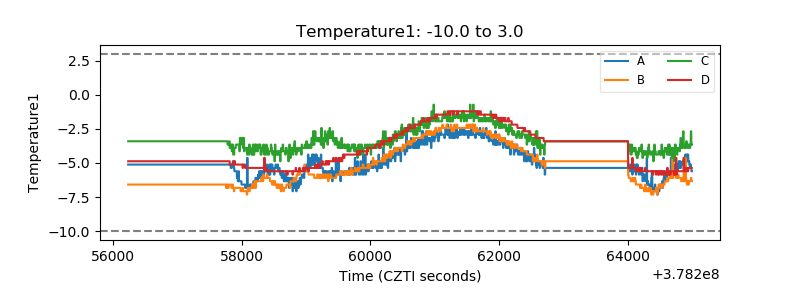 |
| Veto HV Monitor |  |
| Veto LLD | 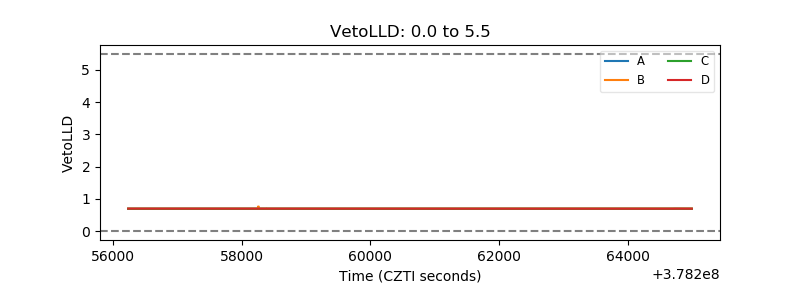 |
| Alpha Counter | 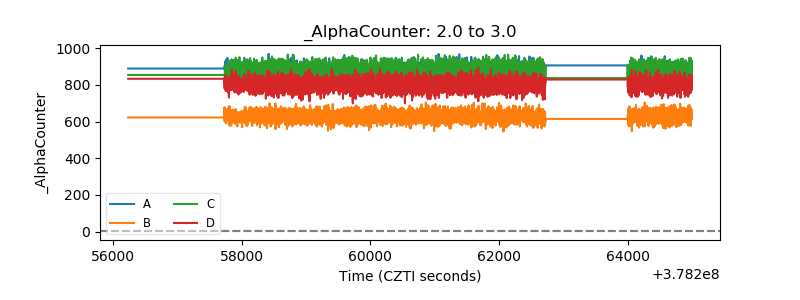 |
| _CPM_Rate | 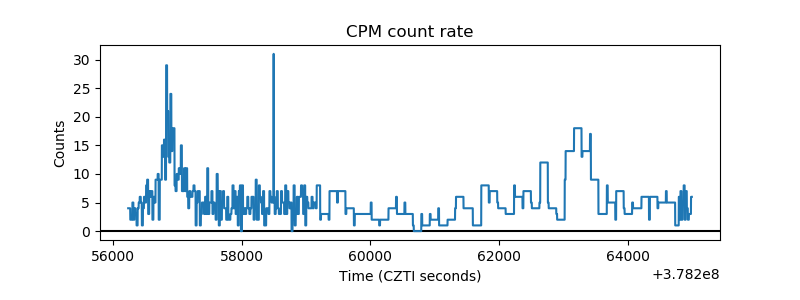 |
| CZT Counter |  |
| +2.5 Volts monitor | 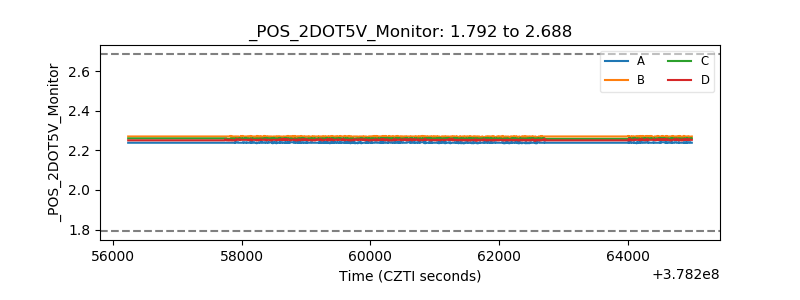 |
| +5 Volts monitor |  |
| _ROLL_ROT | 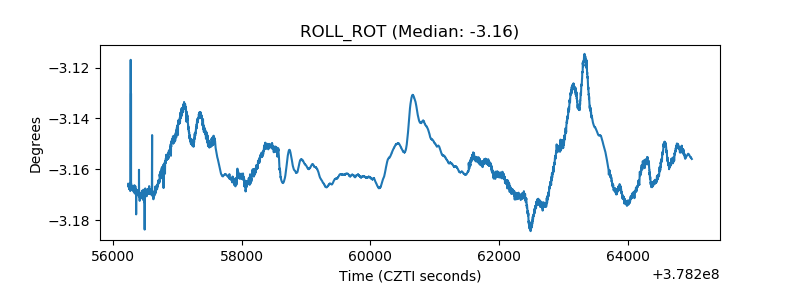 |
| _Roll_DEC | 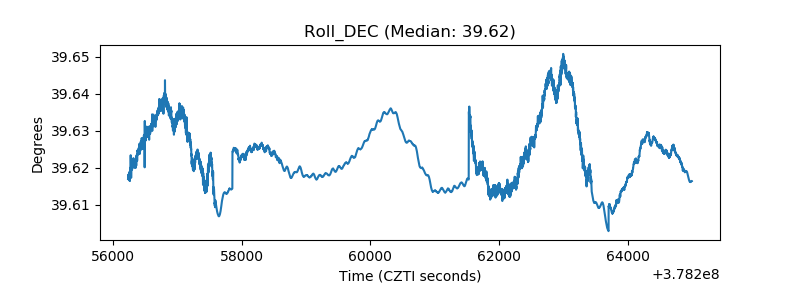 |
| _Roll_RA | 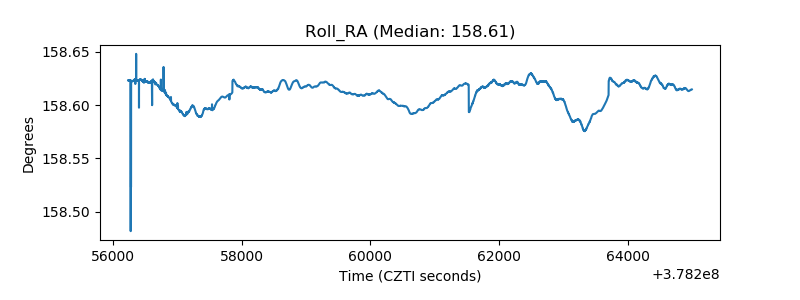 |
| Veto Counter | 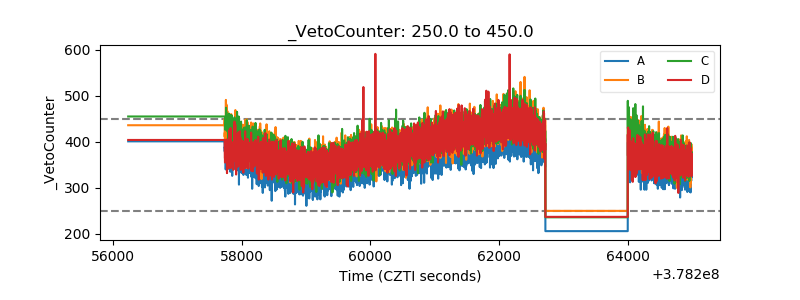 |