| Param | Original file | Final file |
|---|---|---|
| Filename | modeM0/AS1A11_086T01_9000004820_33779cztM0_level2.evt | modeM0/AS1A11_086T01_9000004820_33779cztM0_level2_quad_clean.evt |
| Size (bytes) | 1,719,817,920 | 187,669,440 |
| Size | 1.6 GB | 179.0 MB |
| Events in quadrant A | 14,484,486 | 1,120,921 |
| Events in quadrant B | 10,500,909 | 1,164,793 |
| Events in quadrant C | 10,043,425 | 1,194,819 |
| Events in quadrant D | 15,984,620 | 1,102,053 |
| Mode M9 | |||
|---|---|---|---|
| Quadrant | BADHDUFLAG | Total packets | Discarded packets |
| A | 0 | 55 | 0 |
| B | 0 | 55 | 0 |
| C | 0 | 55 | 0 |
| D | 0 | 55 | 0 |
| Mode SS | |||
|---|---|---|---|
| Quadrant | BADHDUFLAG | Total packets | Discarded packets |
| A | 0 | 326 | 0 |
| B | 0 | 326 | 0 |
| C | 0 | 326 | 0 |
| D | 0 | 326 | 0 |
| Mode M0 | |||
|---|---|---|---|
| Quadrant | BADHDUFLAG | Total packets | Discarded packets |
| A | 0 | 54243 | 5 |
| B | 0 | 41581 | 4 |
| C | 0 | 40113 | 4 |
| D | 0 | 58559 | 4 |
| Quadrant | Total seconds | Saturated seconds | Saturation percentage |
|---|---|---|---|
| A | 15952 | 2049 | 12.844784% |
| B | 15952 | 967 | 6.061936% |
| C | 15952 | 270 | 1.692578% |
| D | 15952 | 1386 | 8.688566% |
Noise dominated data is calculated using 1-second bins in cleaned event files. If a bin has >2000 counts, and if more than 50% of those come from <1% of pixels, then it is considered to be noise-dominated and hence unusable.
| Quadrant | # 1 sec bins | Bins with >0 counts | Bins with >2000 counts | High rate bins dominated by noise | Noise dominated (total time) | Noise dominated (detector-on time) | Marked lightcurve |
|---|---|---|---|---|---|---|---|
| A | 21413 | 15956 | 1459 | 1459 | 6.81% | 9.14% | 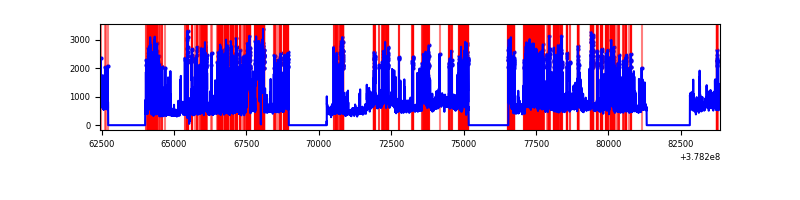 |
| B | 21413 | 15956 | 685 | 685 | 3.20% | 4.29% | 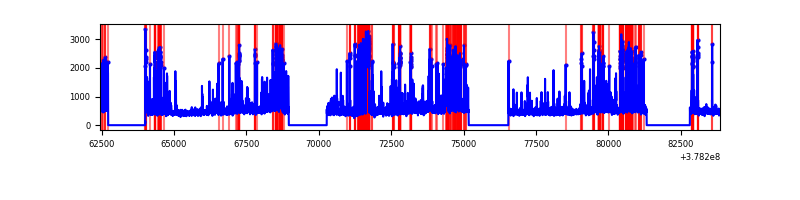 |
| C | 21413 | 15956 | 219 | 219 | 1.02% | 1.37% | 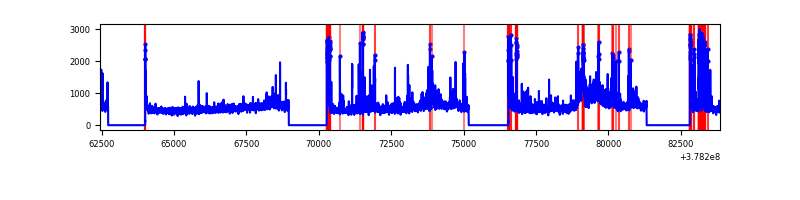 |
| D | 21413 | 15956 | 1342 | 1342 | 6.27% | 8.41% | 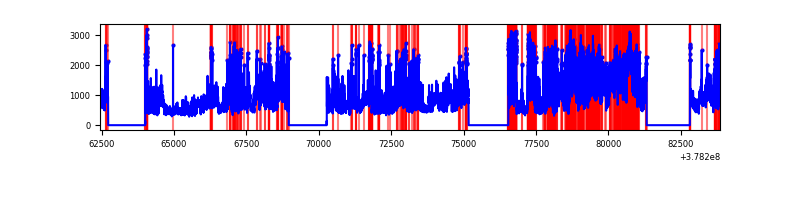 |
Top three noisy pixels from each quadrant. If the there are fewer than three noisy pixels in the level2.evt file, extra rows are filled as -1
| Pixel properties | Quadrant properties | ||||||
|---|---|---|---|---|---|---|---|
| Quadrant | DetID | PixID | Counts | Sigma | Mean | Median | Sigma |
| A | 15 | 237 | 5559077 | 15897.08 | 1760 | 1727 | 349.6 |
| A | 15 | 169 | 1990360 | 5688.59 | 1760 | 1727 | 349.6 |
| A | 9 | 191 | 41835 | 114.73 | 1760 | 1727 | 349.6 |
| B | 5 | 172 | 1803246 | 5207.61 | 1818 | 1770 | 345.9 |
| B | 4 | 251 | 669782 | 1931.05 | 1818 | 1770 | 345.9 |
| B | 0 | 190 | 232035 | 665.64 | 1818 | 1770 | 345.9 |
| C | 3 | 233 | 1496208 | 3600.94 | 1812 | 1828 | 415.0 |
| C | 15 | 214 | 692744 | 1664.87 | 1812 | 1828 | 415.0 |
| C | 0 | 10 | 356622 | 854.93 | 1812 | 1828 | 415.0 |
| D | 12 | 235 | 3751583 | 8672.85 | 1783 | 1730 | 432.4 |
| D | 8 | 195 | 2940765 | 6797.55 | 1783 | 1730 | 432.4 |
| D | 1 | 47 | 850566 | 1963.23 | 1783 | 1730 | 432.4 |
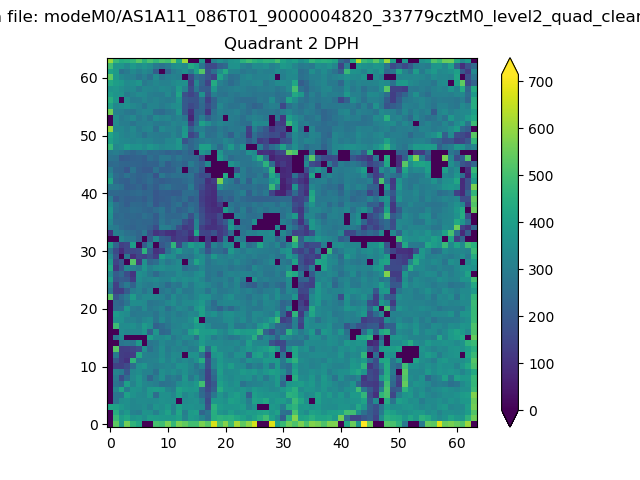
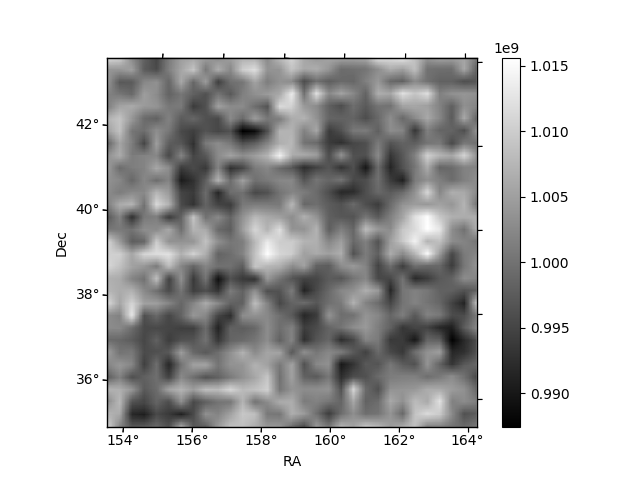
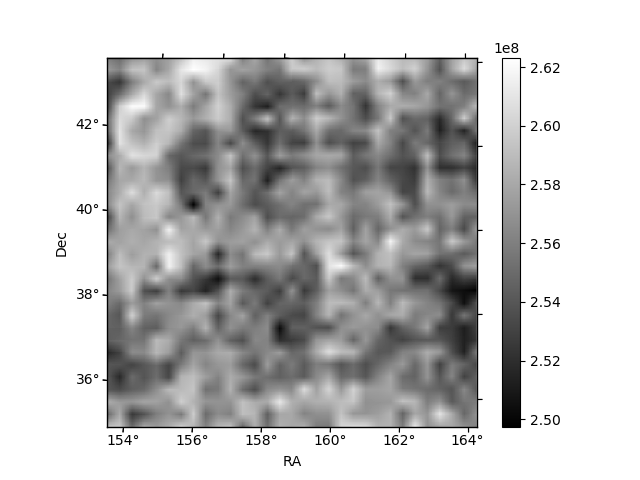
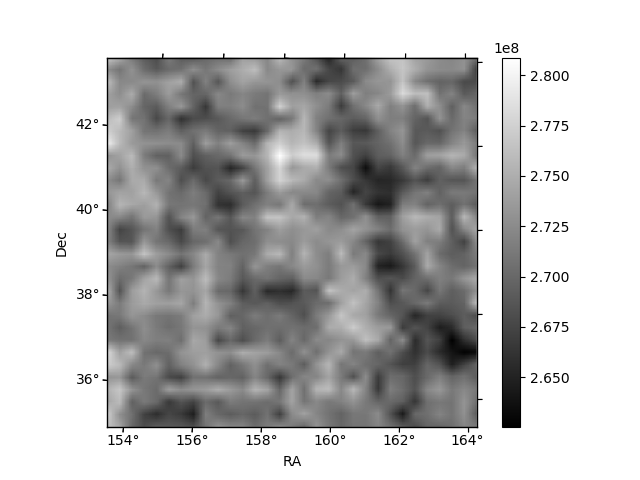
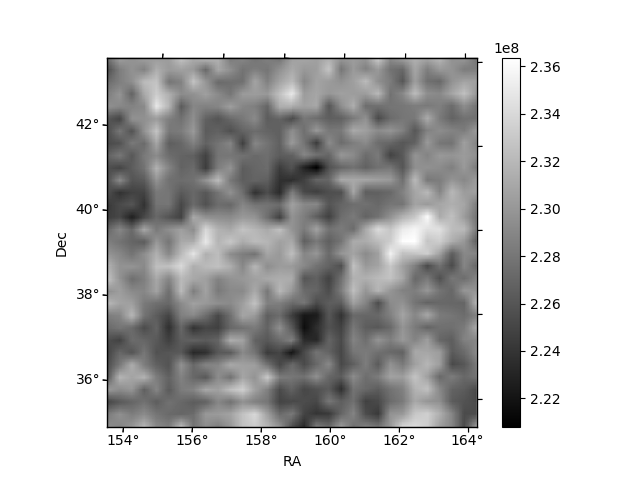
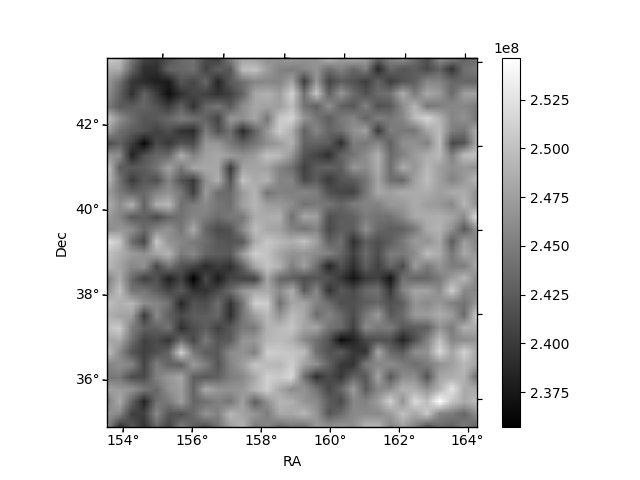
Histogram calculated using DETX and DETY for each event in the final _common_clean file
| Quadrant A | 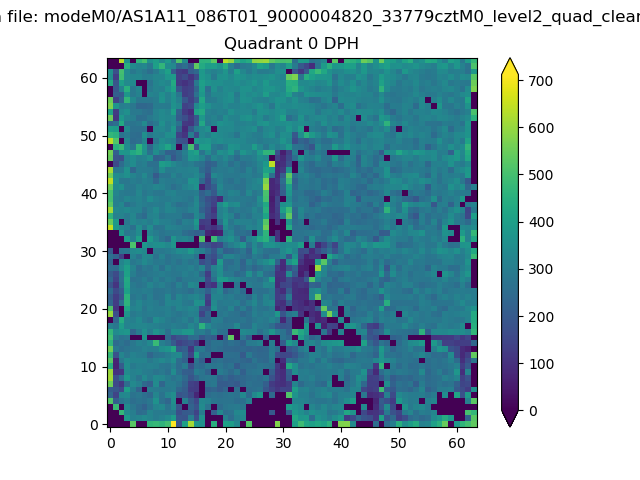 |
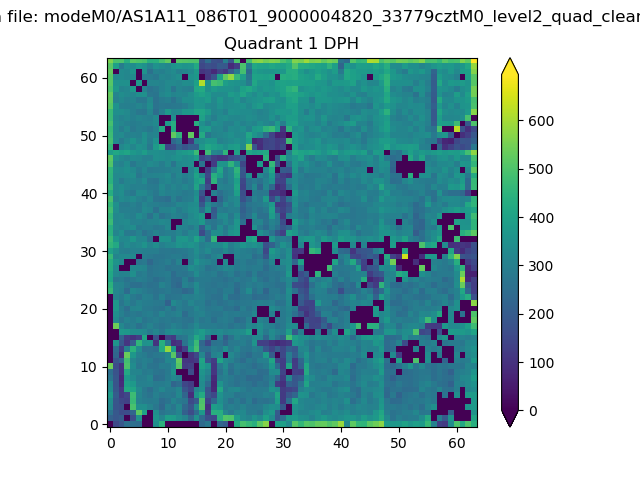 |
Quadrant B |
|---|---|---|---|
| Quadrant D | 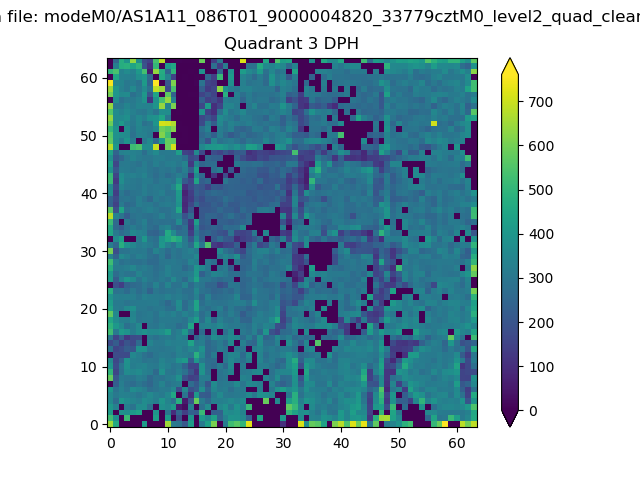 |
 |
Quadrant C |
| Plot type | Count rate plots | Images |
|---|---|---|
| Comparison with Poisson distribution Blue bars denote a histogram of data divided into 1 sec bins. Red curve is a Poisson curve with rate = median count rate of data. |
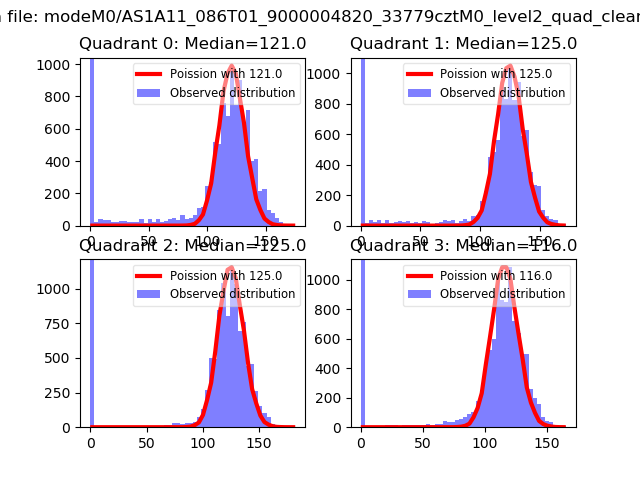 |
 |
| Quadrant-wise count rates Data is divided into 100 sec bins |
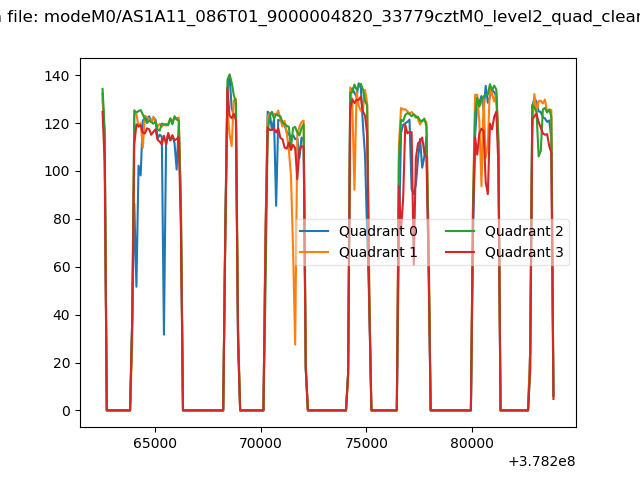 |
|
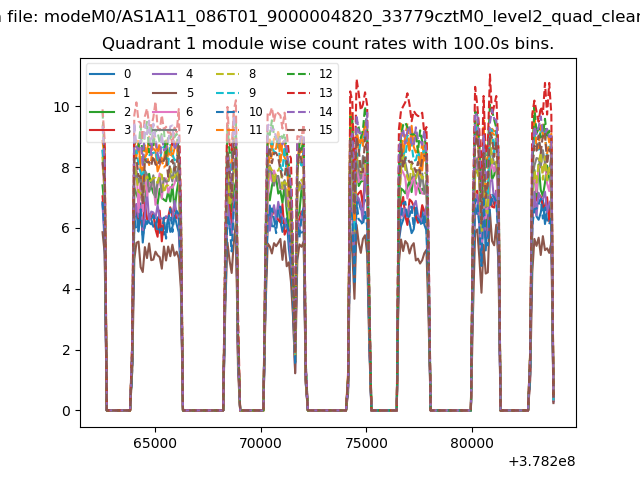
| Module-wise count rates for Quadrant A Data is divided into 100 sec bins |
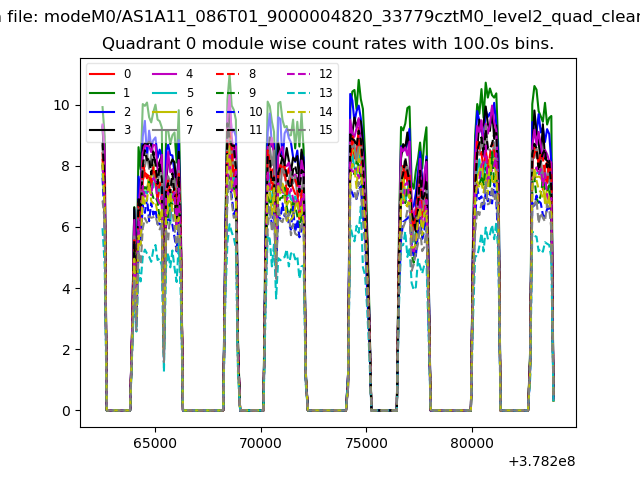 |
 |
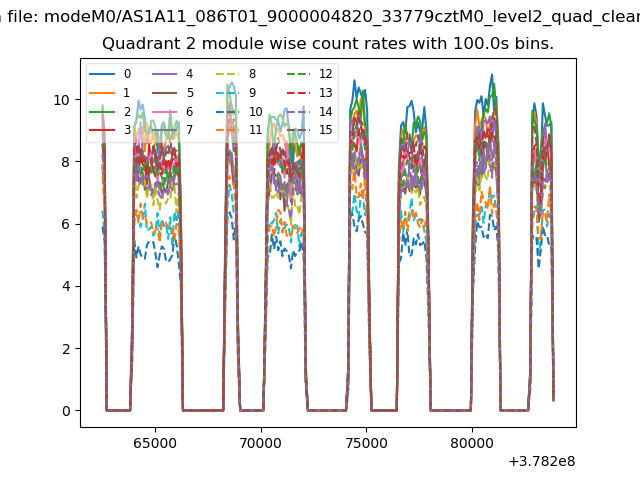
| Module-wise count rates for Quadrant B Data is divided into 100 sec bins |
 |
 |
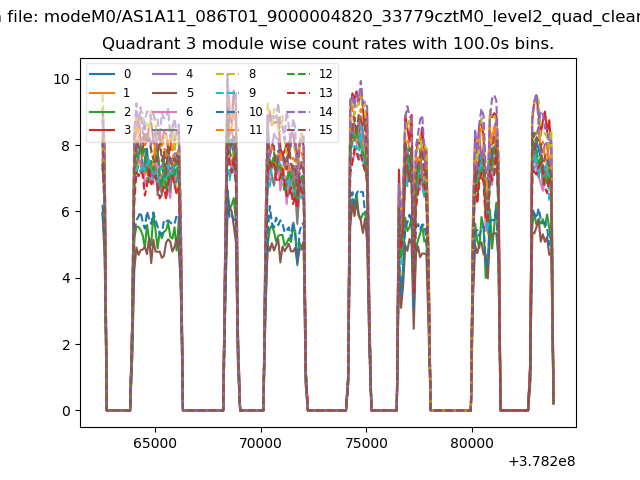
| Module-wise count rates for Quadrant C Data is divided into 100 sec bins |
 |
 |
| Module-wise count rates for Quadrant D Data is divided into 100 sec bins |
 |
 |
| Parameter | Plot |
|---|---|
| CZT HV Monitor | 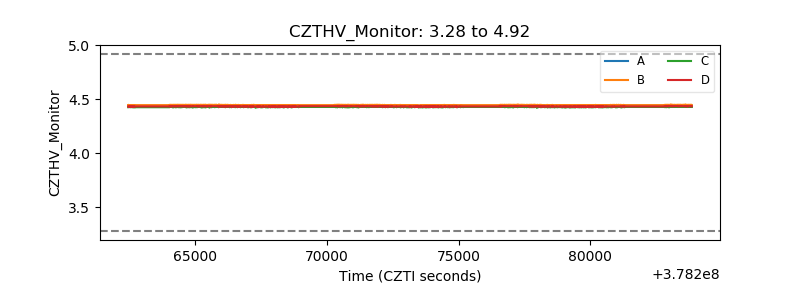 |
| D_VDD | 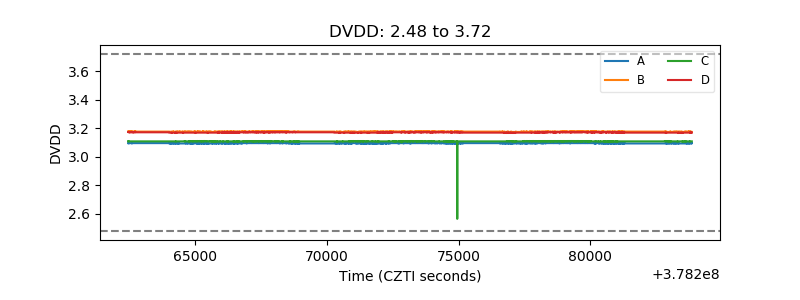 |
| Temperature 1 | 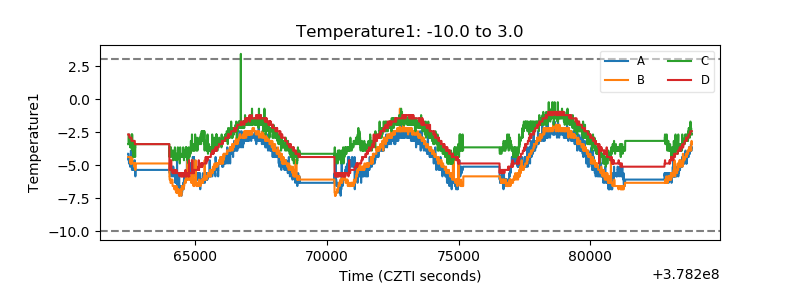 |
| Veto HV Monitor | 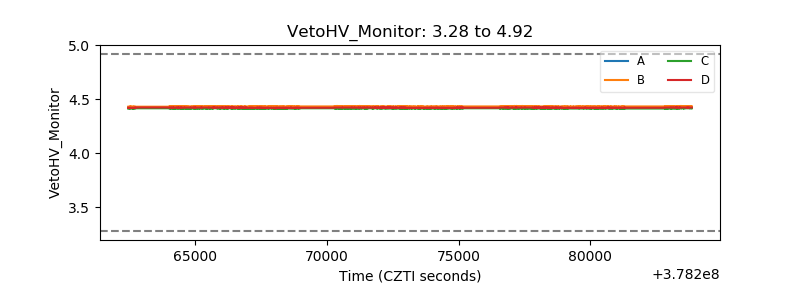 |
| Veto LLD | 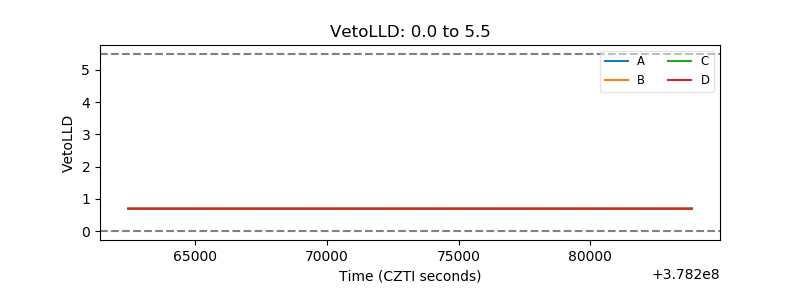 |
| Alpha Counter | 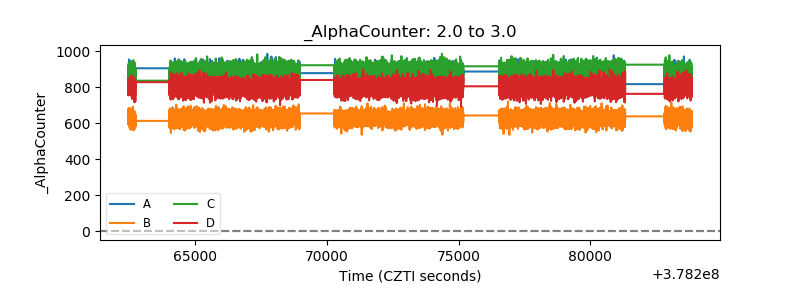 |
| _CPM_Rate | 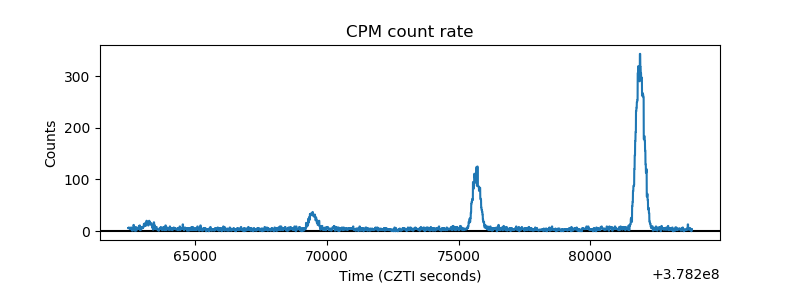 |
| CZT Counter | 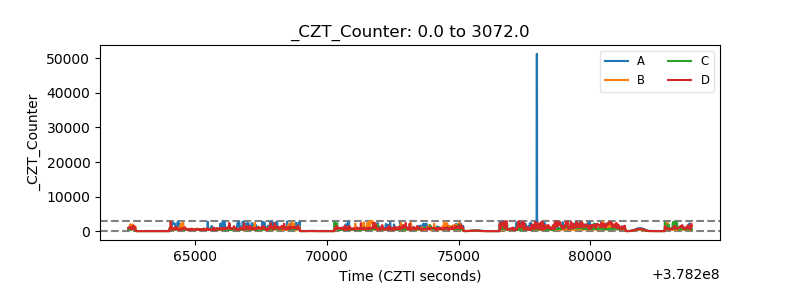 |
| +2.5 Volts monitor | 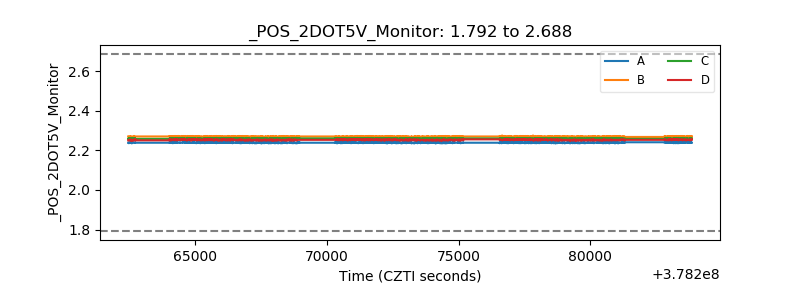 |
| +5 Volts monitor |  |
| _ROLL_ROT | 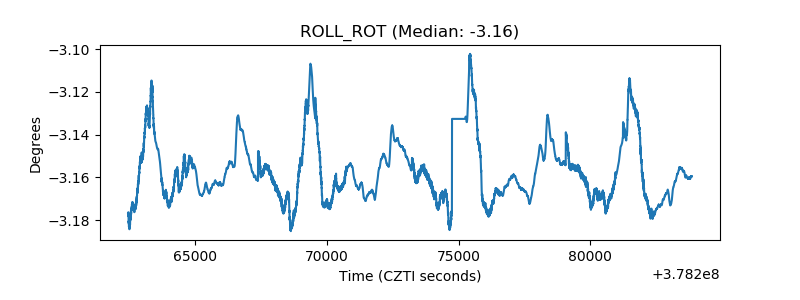 |
| _Roll_DEC | 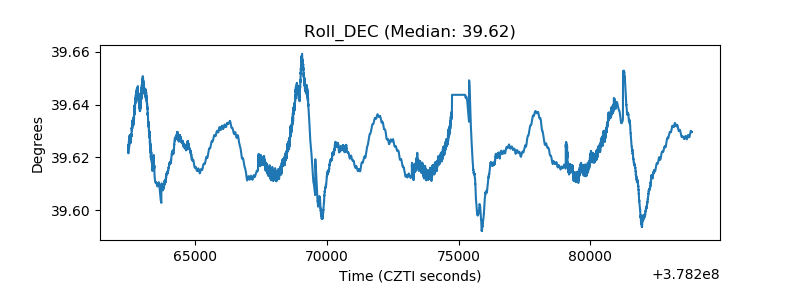 |
| _Roll_RA | 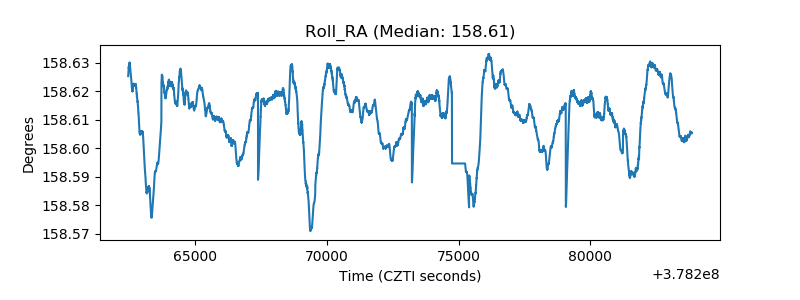 |
| Veto Counter | 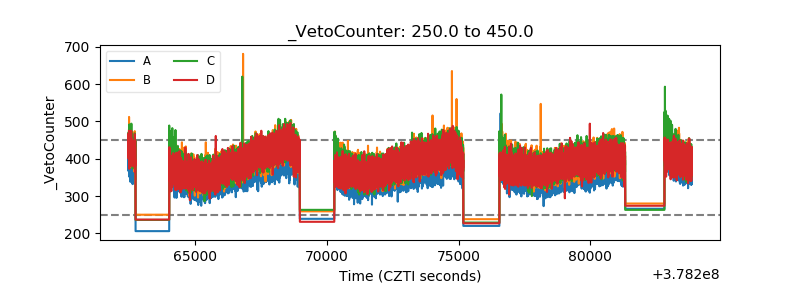 |