| Param | Original file | Final file |
|---|---|---|
| Filename | modeM0/AS1A11_086T01_9000004820_33780cztM0_level2.evt | modeM0/AS1A11_086T01_9000004820_33780cztM0_level2_quad_clean.evt |
| Size (bytes) | 688,956,480 | 59,083,200 |
| Size | 657.0 MB | 56.3 MB |
| Events in quadrant A | 5,982,429 | 348,191 |
| Events in quadrant B | 2,983,100 | 375,002 |
| Events in quadrant C | 3,240,075 | 370,861 |
| Events in quadrant D | 8,307,338 | 328,008 |
| Mode M9 | |||
|---|---|---|---|
| Quadrant | BADHDUFLAG | Total packets | Discarded packets |
| A | 0 | 16 | 0 |
| B | 0 | 16 | 0 |
| C | 0 | 16 | 0 |
| D | 0 | 16 | 0 |
| Mode SS | |||
|---|---|---|---|
| Quadrant | BADHDUFLAG | Total packets | Discarded packets |
| A | 0 | 106 | 0 |
| B | 0 | 106 | 0 |
| C | 0 | 106 | 0 |
| D | 0 | 106 | 0 |
| Mode M0 | |||
|---|---|---|---|
| Quadrant | BADHDUFLAG | Total packets | Discarded packets |
| A | 0 | 21481 | 2 |
| B | 0 | 12118 | 1 |
| C | 0 | 12586 | 1 |
| D | 0 | 28327 | 1 |
| Quadrant | Total seconds | Saturated seconds | Saturation percentage |
|---|---|---|---|
| A | 5234 | 701 | 13.393198% |
| B | 5234 | 90 | 1.719526% |
| C | 5234 | 140 | 2.674818% |
| D | 5234 | 1112 | 21.245701% |
Noise dominated data is calculated using 1-second bins in cleaned event files. If a bin has >2000 counts, and if more than 50% of those come from <1% of pixels, then it is considered to be noise-dominated and hence unusable.
| Quadrant | # 1 sec bins | Bins with >0 counts | Bins with >2000 counts | High rate bins dominated by noise | Noise dominated (total time) | Noise dominated (detector-on time) | Marked lightcurve |
|---|---|---|---|---|---|---|---|
| A | 6847 | 5235 | 502 | 502 | 7.33% | 9.59% | 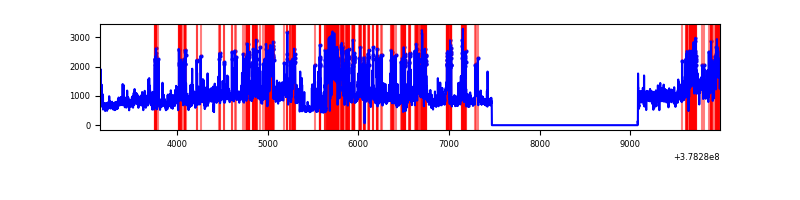 |
| B | 6847 | 5235 | 51 | 51 | 0.74% | 0.97% | 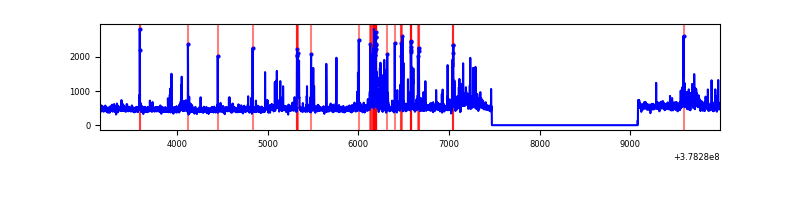 |
| C | 6847 | 5235 | 134 | 134 | 1.96% | 2.56% | 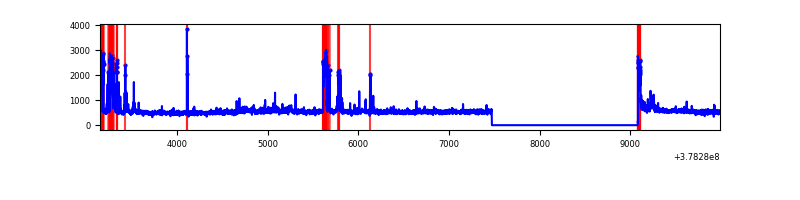 |
| D | 6847 | 5235 | 1212 | 1212 | 17.70% | 23.15% | 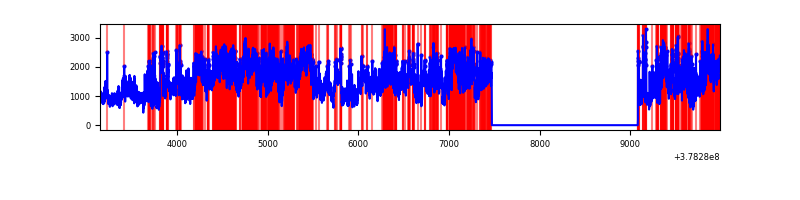 |
Top three noisy pixels from each quadrant. If the there are fewer than three noisy pixels in the level2.evt file, extra rows are filled as -1
| Pixel properties | Quadrant properties | ||||||
|---|---|---|---|---|---|---|---|
| Quadrant | DetID | PixID | Counts | Sigma | Mean | Median | Sigma |
| A | 15 | 169 | 1996585 | 16954.57 | 586 | 575 | 117.7 |
| A | 15 | 237 | 1691923 | 14366.7 | 586 | 575 | 117.7 |
| A | 13 | 6 | 10915 | 87.83 | 586 | 575 | 117.7 |
| B | 5 | 172 | 270172 | 2268.04 | 618 | 603 | 118.9 |
| B | 0 | 190 | 52453 | 436.25 | 618 | 603 | 118.9 |
| B | 0 | 197 | 52395 | 435.76 | 618 | 603 | 118.9 |
| C | 3 | 233 | 551172 | 3978.95 | 601 | 607 | 138.4 |
| C | 15 | 214 | 225128 | 1622.62 | 601 | 607 | 138.4 |
| C | 0 | 10 | 61043 | 436.77 | 601 | 607 | 138.4 |
| D | 12 | 235 | 4017839 | 27985.84 | 579 | 562 | 143.5 |
| D | 8 | 195 | 1334520 | 9292.85 | 579 | 562 | 143.5 |
| D | 2 | 250 | 232718 | 1617.28 | 579 | 562 | 143.5 |
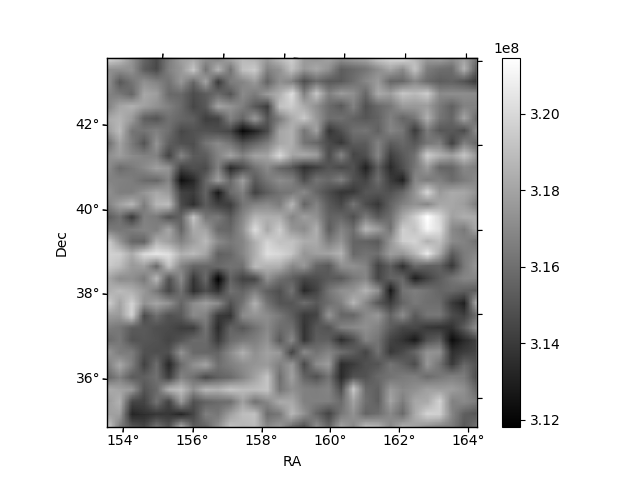
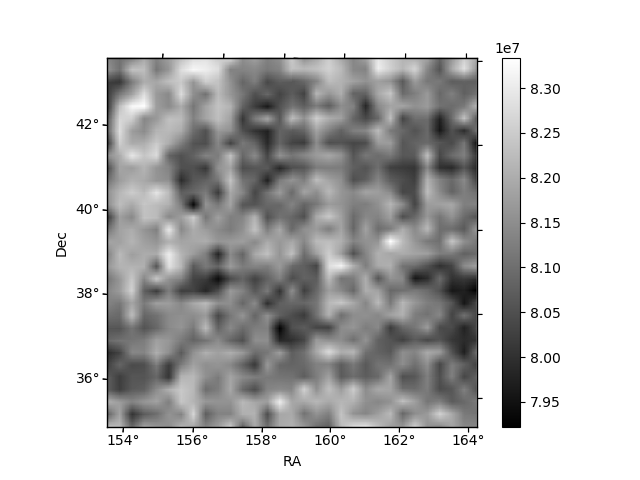
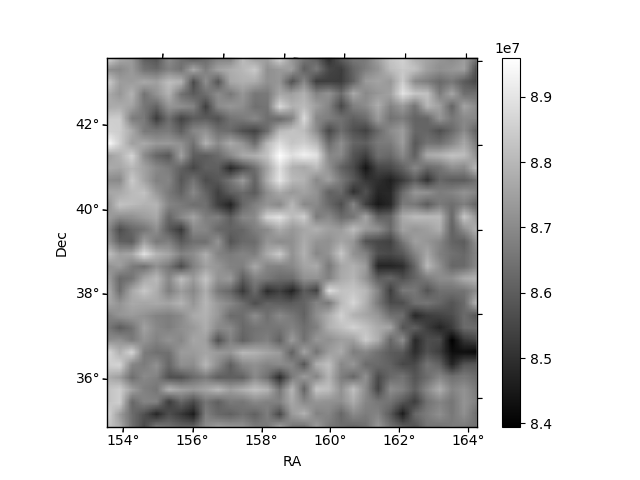
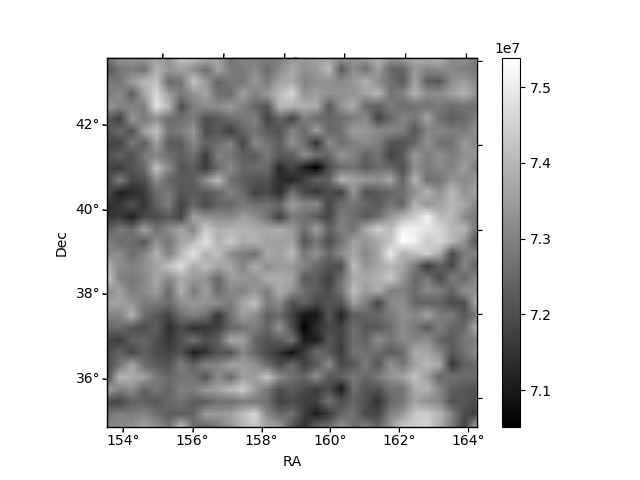
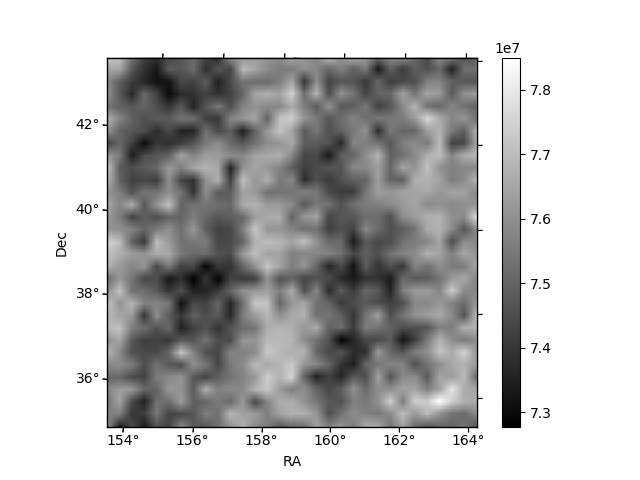
Histogram calculated using DETX and DETY for each event in the final _common_clean file
| Quadrant A | 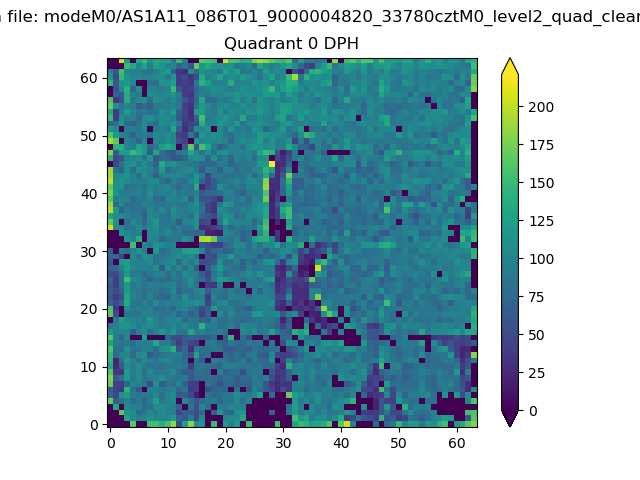 |
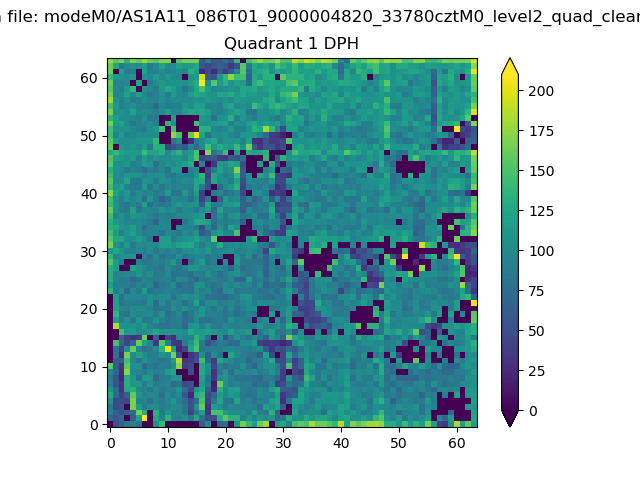 |
Quadrant B |
|---|---|---|---|
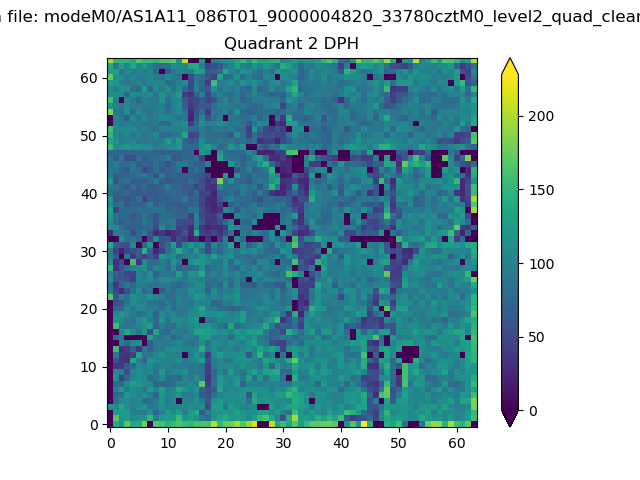
| Quadrant D | 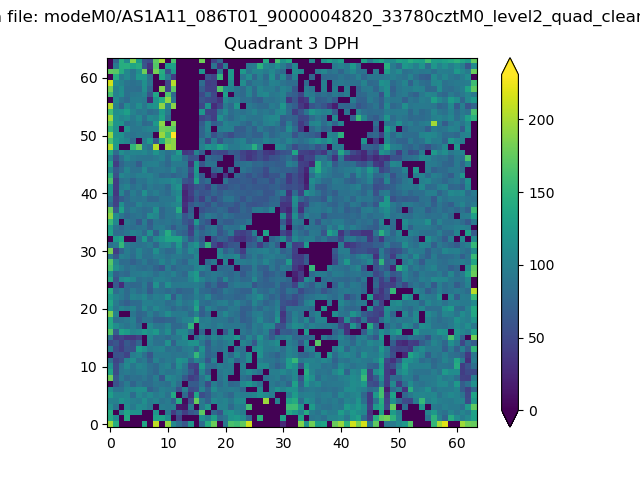 |
 |
Quadrant C |
| Plot type | Count rate plots | Images |
|---|---|---|
| Comparison with Poisson distribution Blue bars denote a histogram of data divided into 1 sec bins. Red curve is a Poisson curve with rate = median count rate of data. |
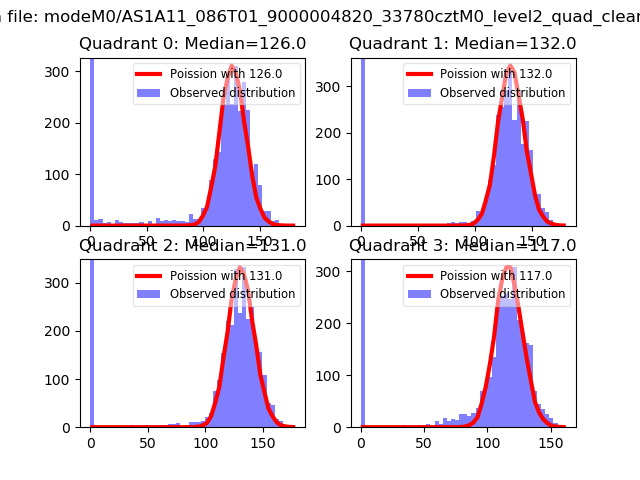 |
 |
| Quadrant-wise count rates Data is divided into 100 sec bins |
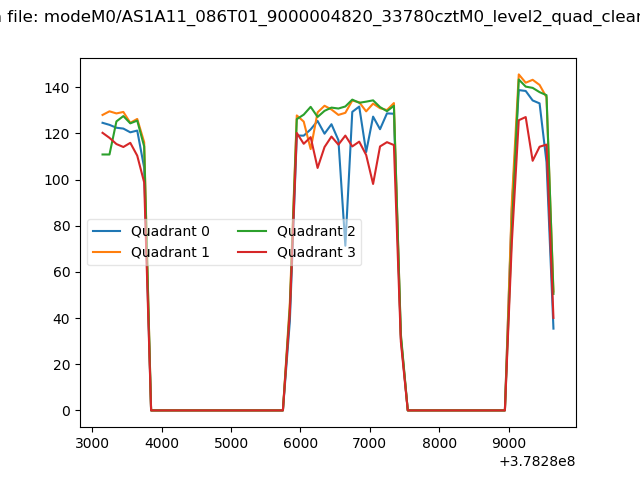 |
|
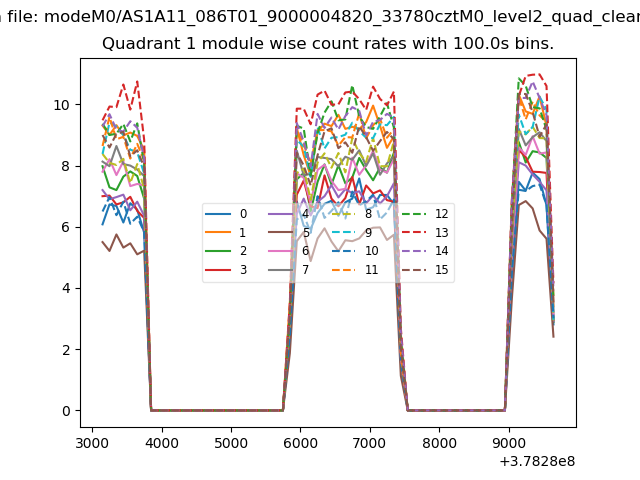
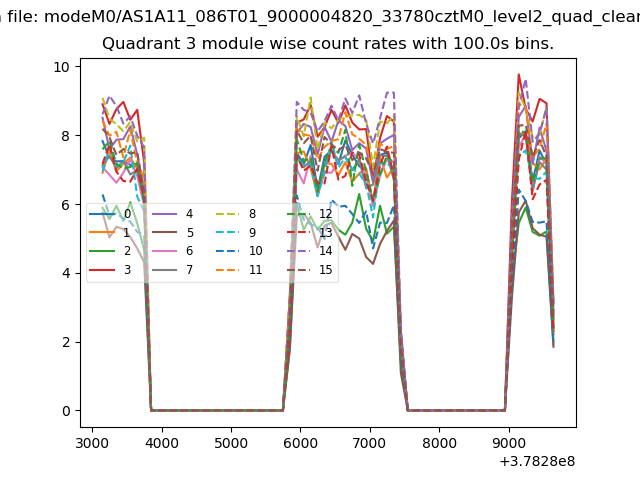
| Module-wise count rates for Quadrant A Data is divided into 100 sec bins |
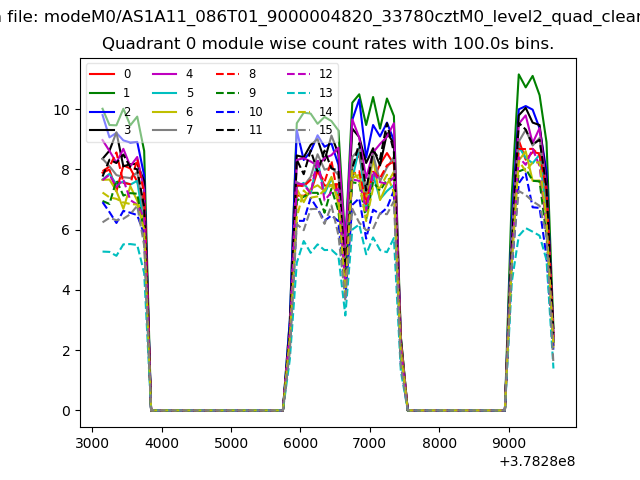 |
 |
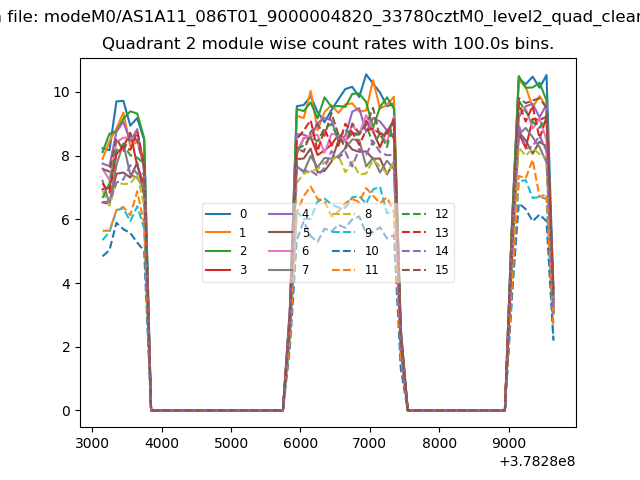
| Module-wise count rates for Quadrant B Data is divided into 100 sec bins |
 |
 |
| Module-wise count rates for Quadrant C Data is divided into 100 sec bins |
 |
 |
| Module-wise count rates for Quadrant D Data is divided into 100 sec bins |
 |
 |
| Parameter | Plot |
|---|---|
| CZT HV Monitor | 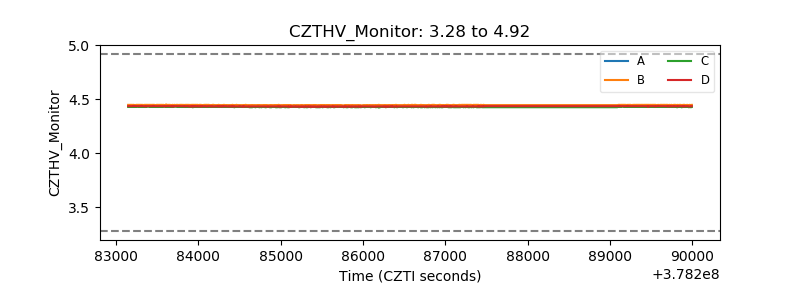 |
| D_VDD | 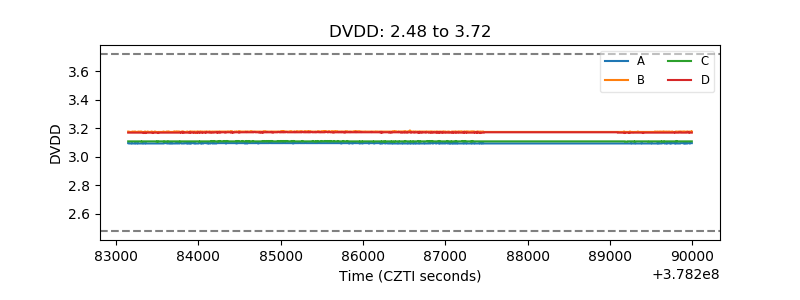 |
| Temperature 1 |  |
| Veto HV Monitor | 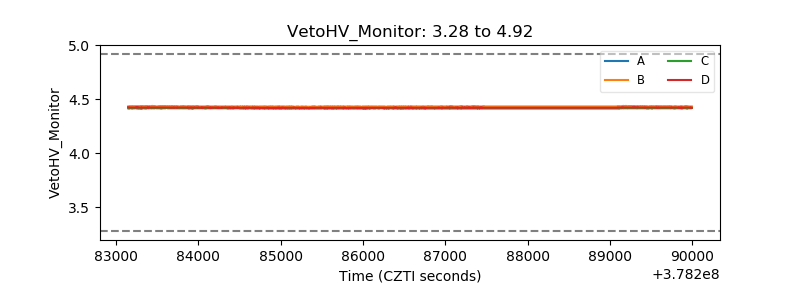 |
| Veto LLD |  |
| Alpha Counter | 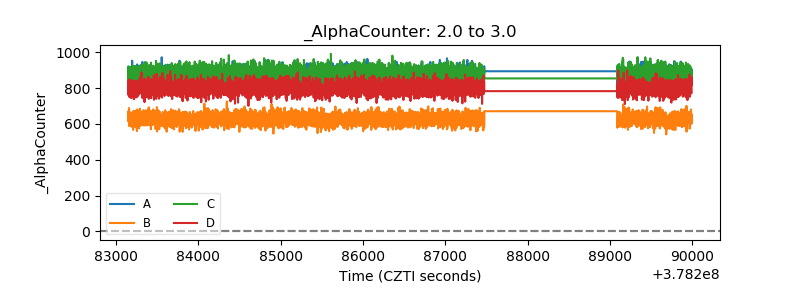 |
| _CPM_Rate | 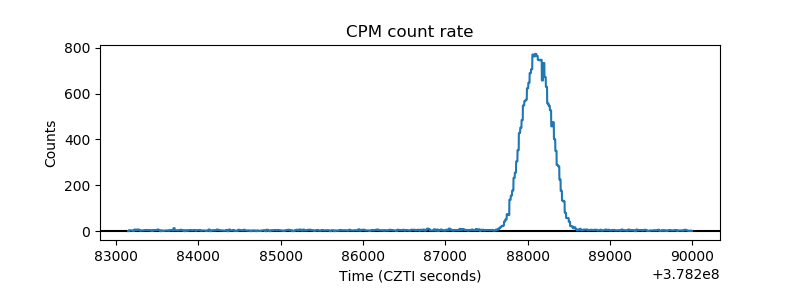 |
| CZT Counter | 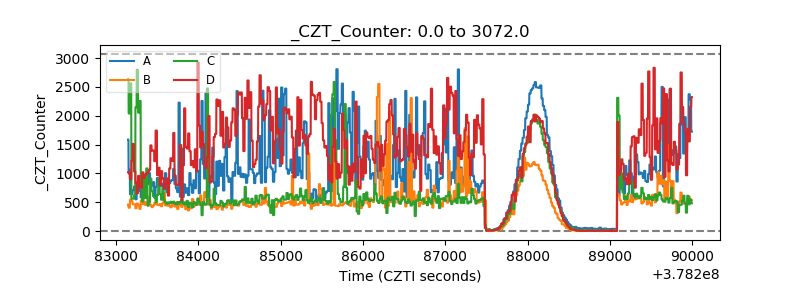 |
| +2.5 Volts monitor |  |
| +5 Volts monitor |  |
| _ROLL_ROT | 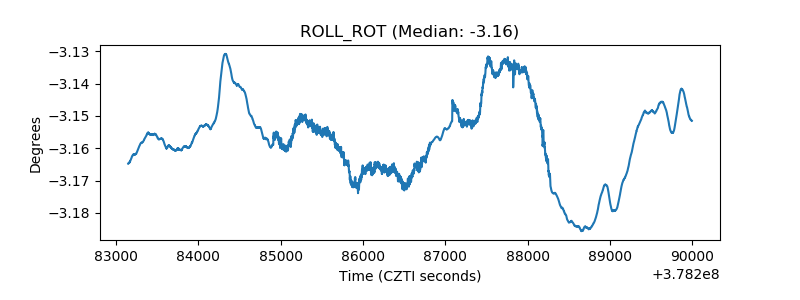 |
| _Roll_DEC | 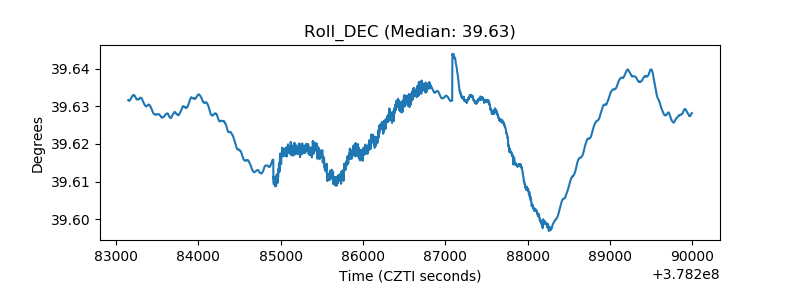 |
| _Roll_RA | 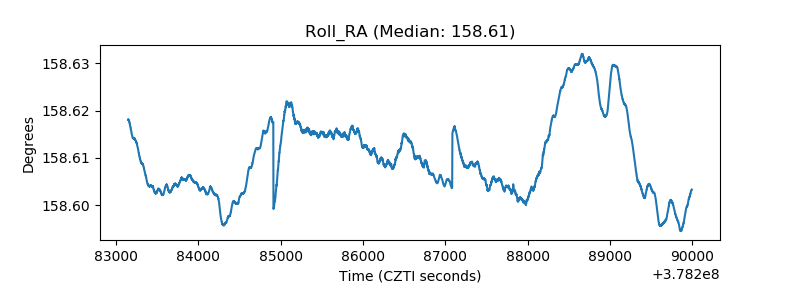 |
| Veto Counter | 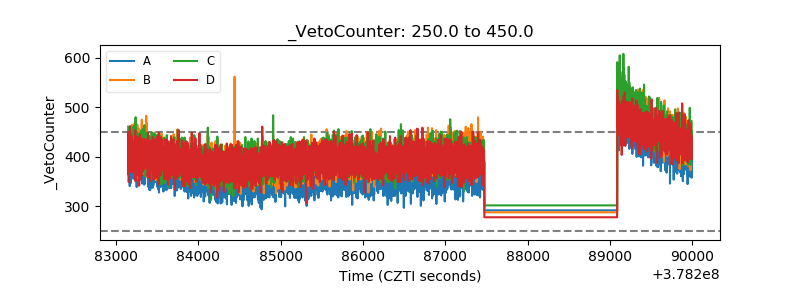 |