| Param | Original file | Final file |
|---|---|---|
| Filename | modeM0/AS1A11_086T01_9000004820_33782cztM0_level2.evt | modeM0/AS1A11_086T01_9000004820_33782cztM0_level2_quad_clean.evt |
| Size (bytes) | 859,429,440 | 56,036,160 |
| Size | 819.6 MB | 53.4 MB |
| Events in quadrant A | 7,003,928 | 333,852 |
| Events in quadrant B | 3,680,984 | 358,376 |
| Events in quadrant C | 3,262,232 | 354,242 |
| Events in quadrant D | 11,707,047 | 260,110 |
| Mode M9 | |||
|---|---|---|---|
| Quadrant | BADHDUFLAG | Total packets | Discarded packets |
| A | 0 | 21 | 0 |
| B | 0 | 21 | 0 |
| C | 0 | 21 | 0 |
| D | 0 | 22 | 0 |
| Mode SS | |||
|---|---|---|---|
| Quadrant | BADHDUFLAG | Total packets | Discarded packets |
| A | 0 | 112 | 0 |
| B | 0 | 112 | 0 |
| C | 0 | 112 | 0 |
| D | 0 | 112 | 0 |
| Mode M0 | |||
|---|---|---|---|
| Quadrant | BADHDUFLAG | Total packets | Discarded packets |
| A | 0 | 24743 | 3 |
| B | 0 | 14379 | 2 |
| C | 0 | 12902 | 2 |
| D | 0 | 38608 | 2 |
| Quadrant | Total seconds | Saturated seconds | Saturation percentage |
|---|---|---|---|
| A | 5563 | 704 | 12.655042% |
| B | 5563 | 199 | 3.577207% |
| C | 5563 | 60 | 1.078555% |
| D | 5563 | 3416 | 61.405716% |
Noise dominated data is calculated using 1-second bins in cleaned event files. If a bin has >2000 counts, and if more than 50% of those come from <1% of pixels, then it is considered to be noise-dominated and hence unusable.
| Quadrant | # 1 sec bins | Bins with >0 counts | Bins with >2000 counts | High rate bins dominated by noise | Noise dominated (total time) | Noise dominated (detector-on time) | Marked lightcurve |
|---|---|---|---|---|---|---|---|
| A | 7296 | 5564 | 479 | 479 | 6.57% | 8.61% | 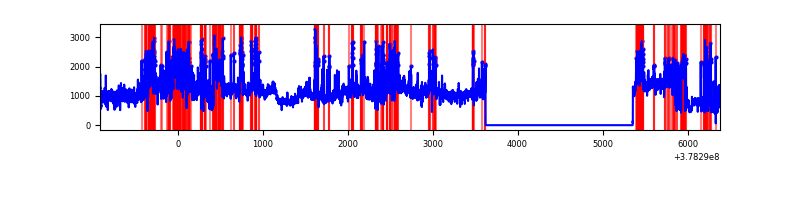 |
| B | 7296 | 5564 | 133 | 133 | 1.82% | 2.39% | 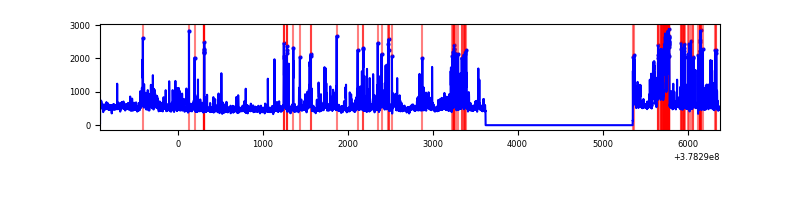 |
| C | 7296 | 5564 | 53 | 53 | 0.73% | 0.95% | 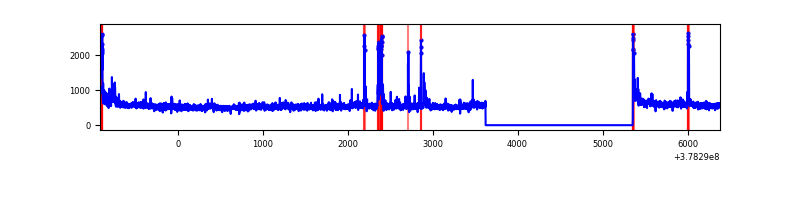 |
| D | 7296 | 5564 | 3688 | 3688 | 50.55% | 66.28% | 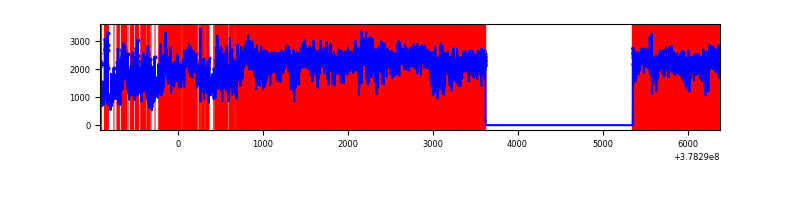 |
Top three noisy pixels from each quadrant. If the there are fewer than three noisy pixels in the level2.evt file, extra rows are filled as -1
| Pixel properties | Quadrant properties | ||||||
|---|---|---|---|---|---|---|---|
| Quadrant | DetID | PixID | Counts | Sigma | Mean | Median | Sigma |
| A | 15 | 169 | 3366894 | 25590.73 | 657 | 646 | 131.5 |
| A | 15 | 237 | 1080196 | 8206.9 | 657 | 646 | 131.5 |
| A | 13 | 6 | 9698 | 68.81 | 657 | 646 | 131.5 |
| B | 5 | 172 | 711742 | 5536.53 | 674 | 658 | 128.4 |
| B | 0 | 190 | 63355 | 488.16 | 674 | 658 | 128.4 |
| B | 15 | 85 | 36839 | 281.7 | 674 | 658 | 128.4 |
| C | 3 | 233 | 274316 | 1794.26 | 663 | 669 | 152.5 |
| C | 15 | 214 | 243797 | 1594.15 | 663 | 669 | 152.5 |
| C | 0 | 10 | 86114 | 560.25 | 663 | 669 | 152.5 |
| D | 12 | 235 | 7795080 | 52326.84 | 549 | 537 | 149.0 |
| D | 8 | 195 | 991215 | 6650.68 | 549 | 537 | 149.0 |
| D | 2 | 250 | 309558 | 2074.54 | 549 | 537 | 149.0 |
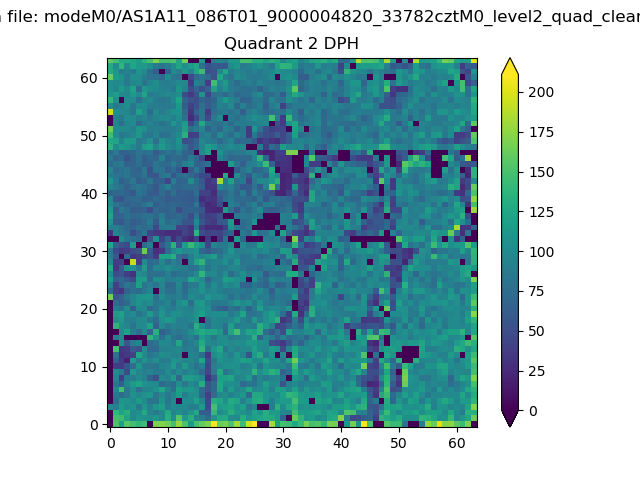
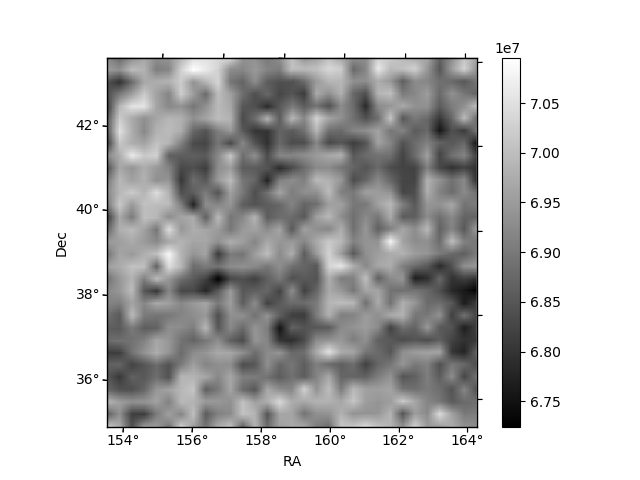
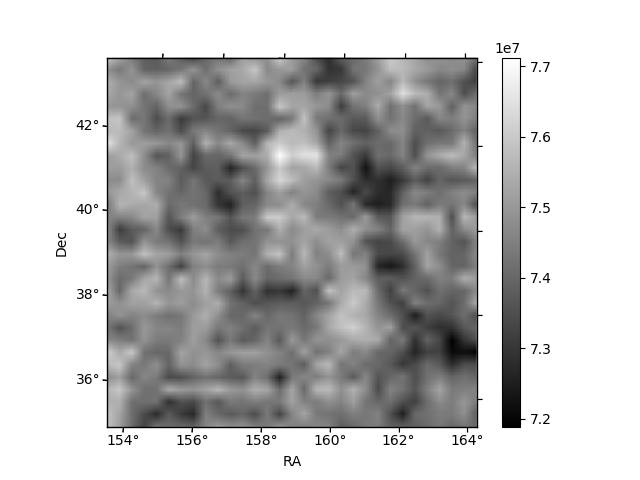
Histogram calculated using DETX and DETY for each event in the final _common_clean file
| Quadrant A | 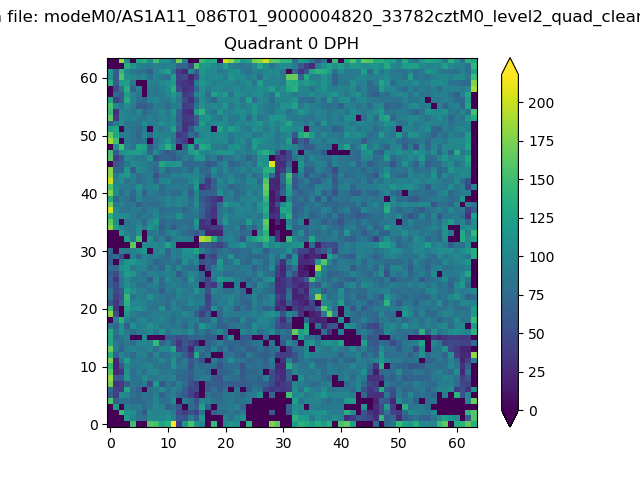 |
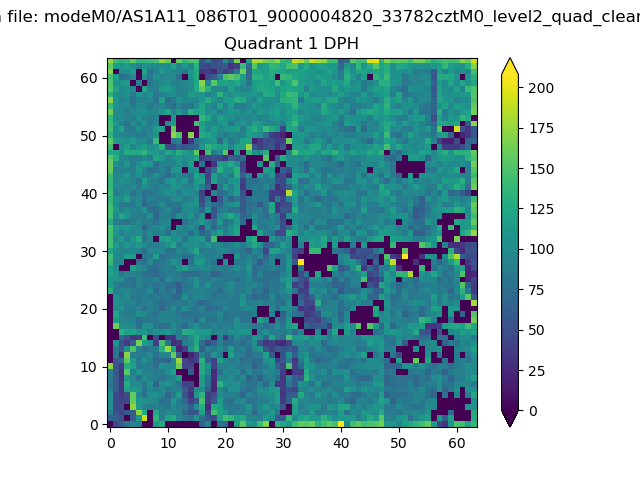 |
Quadrant B |
|---|---|---|---|
| Quadrant D | 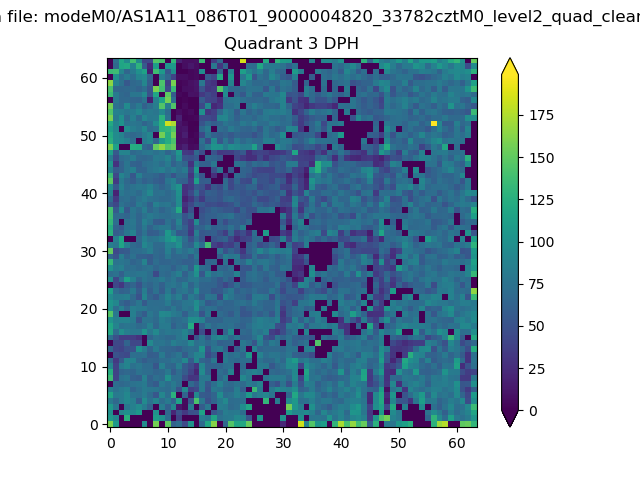 |
 |
Quadrant C |
| Plot type | Count rate plots | Images |
|---|---|---|
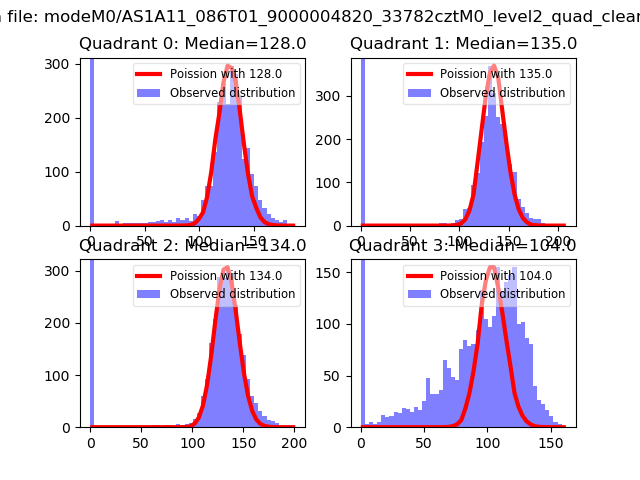
| Comparison with Poisson distribution Blue bars denote a histogram of data divided into 1 sec bins. Red curve is a Poisson curve with rate = median count rate of data. |
 |
 |
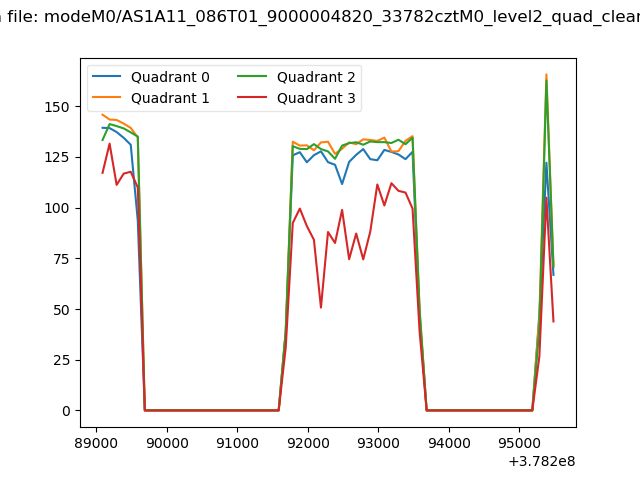
| Quadrant-wise count rates Data is divided into 100 sec bins |
 |
|
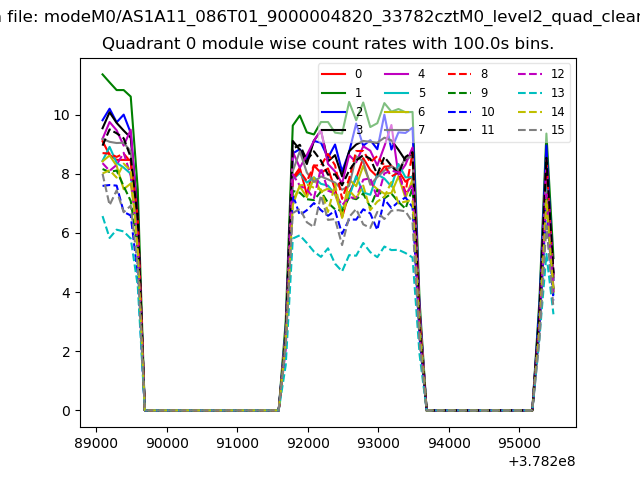
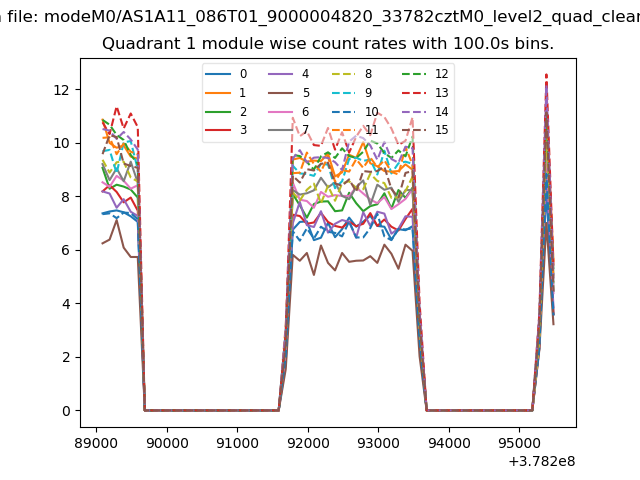
| Module-wise count rates for Quadrant A Data is divided into 100 sec bins |
 |
 |
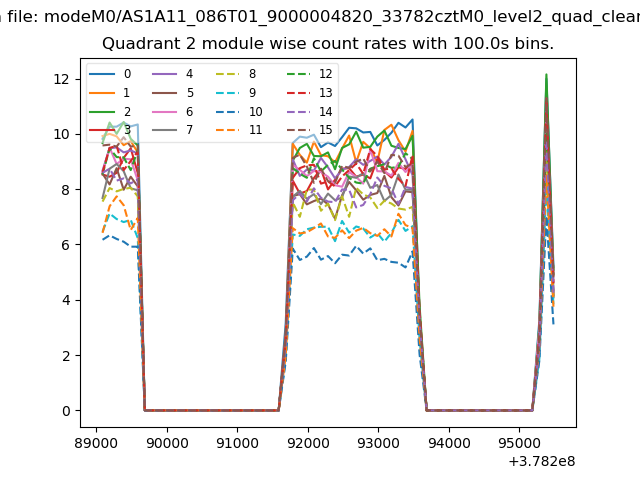
| Module-wise count rates for Quadrant B Data is divided into 100 sec bins |
 |
 |
| Module-wise count rates for Quadrant C Data is divided into 100 sec bins |
 |
 |
| Module-wise count rates for Quadrant D Data is divided into 100 sec bins |
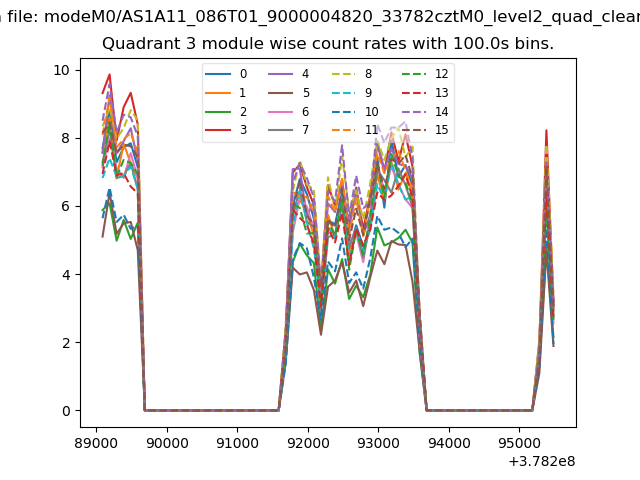 |
 |
| Parameter | Plot |
|---|---|
| CZT HV Monitor | 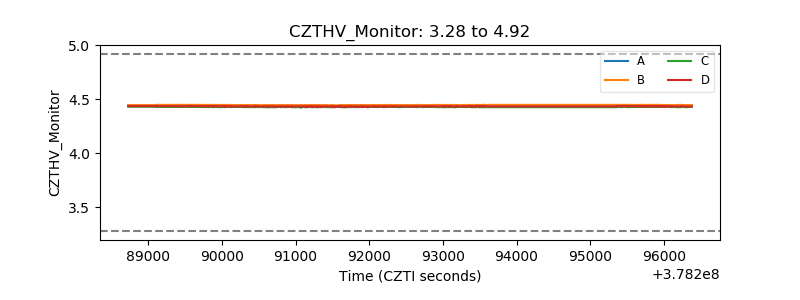 |
| D_VDD | 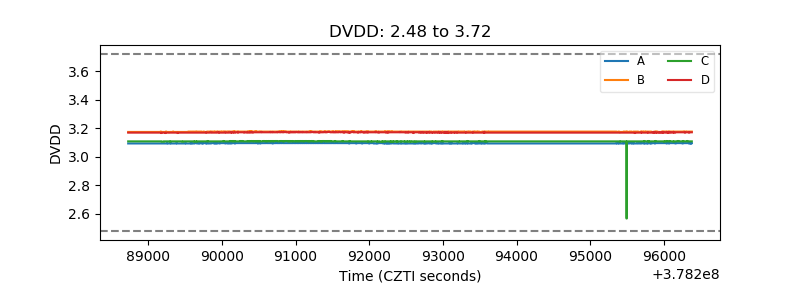 |
| Temperature 1 | 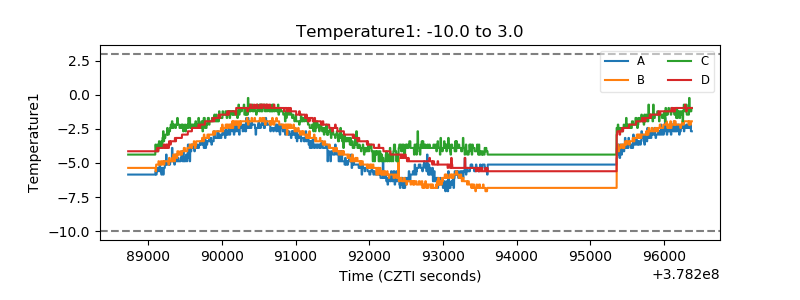 |
| Veto HV Monitor |  |
| Veto LLD |  |
| Alpha Counter | 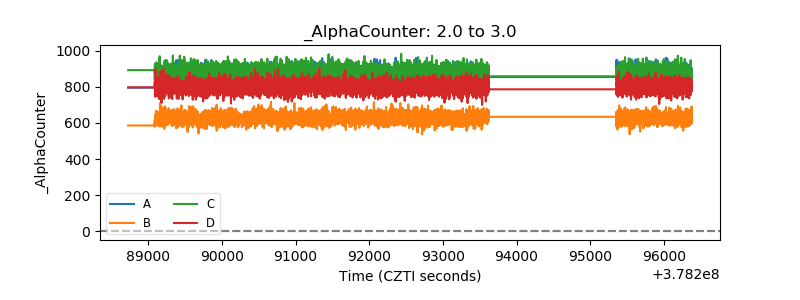 |
| _CPM_Rate | 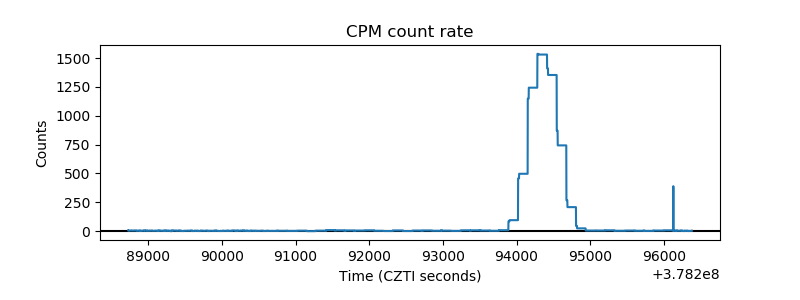 |
| CZT Counter | 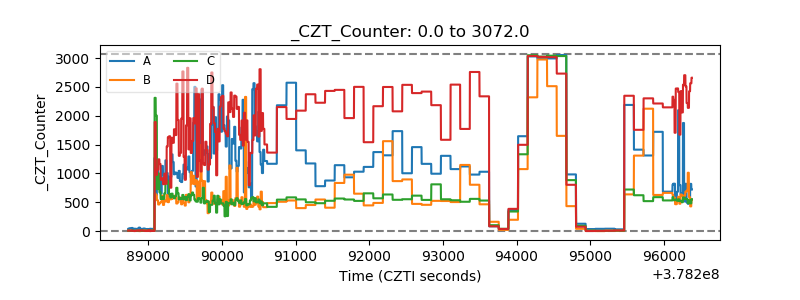 |
| +2.5 Volts monitor |  |
| +5 Volts monitor | 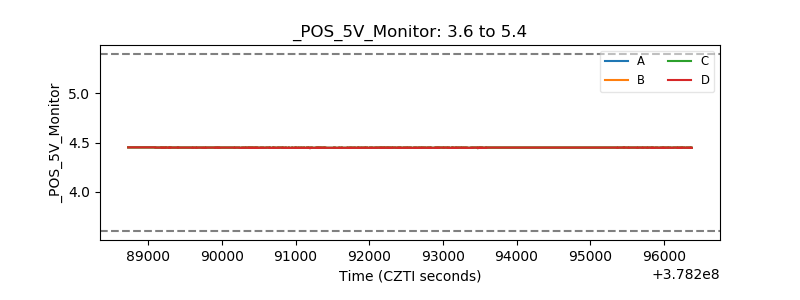 |
| _ROLL_ROT | 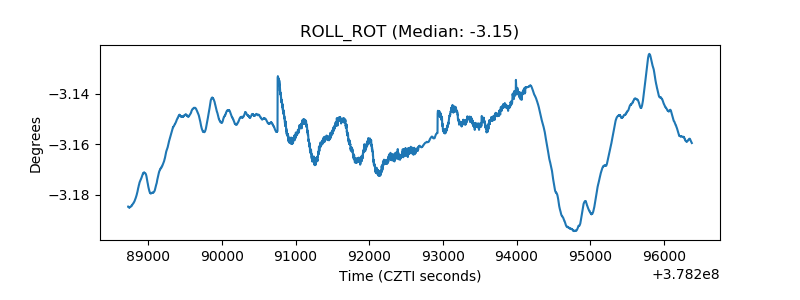 |
| _Roll_DEC | 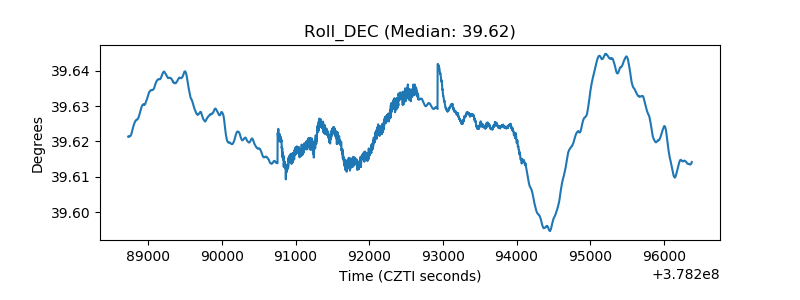 |
| _Roll_RA | 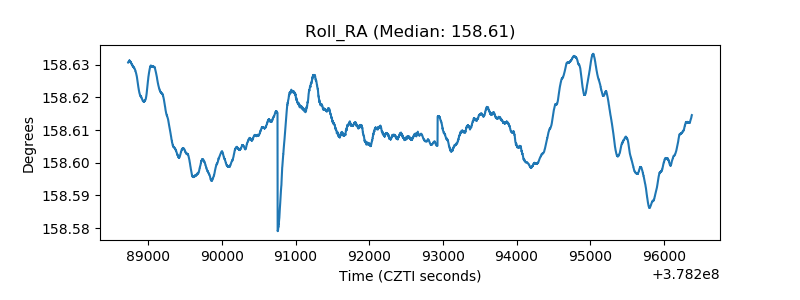 |
| Veto Counter | 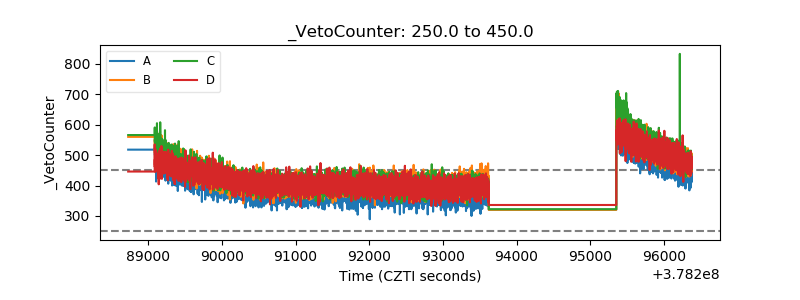 |