| Param | Original file | Final file |
|---|---|---|
| Filename | modeM0/AS1A11_086T01_9000004820_33783cztM0_level2.evt | modeM0/AS1A11_086T01_9000004820_33783cztM0_level2_quad_clean.evt |
| Size (bytes) | 763,070,400 | 51,883,200 |
| Size | 727.7 MB | 49.5 MB |
| Events in quadrant A | 4,600,507 | 305,099 |
| Events in quadrant B | 3,987,369 | 312,794 |
| Events in quadrant C | 3,296,292 | 317,842 |
| Events in quadrant D | 10,861,647 | 256,422 |
| Mode M9 | |||
|---|---|---|---|
| Quadrant | BADHDUFLAG | Total packets | Discarded packets |
| A | 0 | 23 | 0 |
| B | 0 | 23 | 0 |
| C | 0 | 23 | 0 |
| D | 0 | 24 | 0 |
| Mode SS | |||
|---|---|---|---|
| Quadrant | BADHDUFLAG | Total packets | Discarded packets |
| A | 0 | 110 | 0 |
| B | 0 | 110 | 0 |
| C | 0 | 110 | 0 |
| D | 0 | 110 | 0 |
| Mode M0 | |||
|---|---|---|---|
| Quadrant | BADHDUFLAG | Total packets | Discarded packets |
| A | 0 | 17283 | 3 |
| B | 0 | 15270 | 2 |
| C | 0 | 13095 | 2 |
| D | 0 | 36003 | 2 |
| Quadrant | Total seconds | Saturated seconds | Saturation percentage |
|---|---|---|---|
| A | 5396 | 493 | 9.136397% |
| B | 5396 | 363 | 6.727205% |
| C | 5396 | 69 | 1.278725% |
| D | 5396 | 3009 | 55.763529% |
Noise dominated data is calculated using 1-second bins in cleaned event files. If a bin has >2000 counts, and if more than 50% of those come from <1% of pixels, then it is considered to be noise-dominated and hence unusable.
| Quadrant | # 1 sec bins | Bins with >0 counts | Bins with >2000 counts | High rate bins dominated by noise | Noise dominated (total time) | Noise dominated (detector-on time) | Marked lightcurve |
|---|---|---|---|---|---|---|---|
| A | 7279 | 5397 | 358 | 358 | 4.92% | 6.63% | 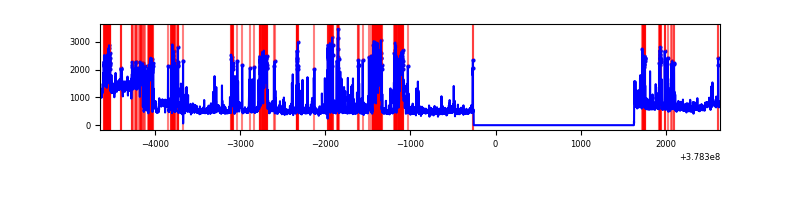 |
| B | 7279 | 5397 | 257 | 257 | 3.53% | 4.76% | 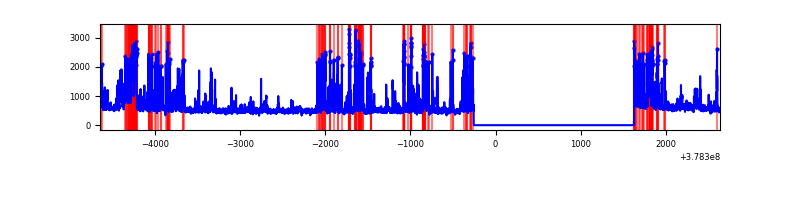 |
| C | 7279 | 5397 | 47 | 47 | 0.65% | 0.87% | 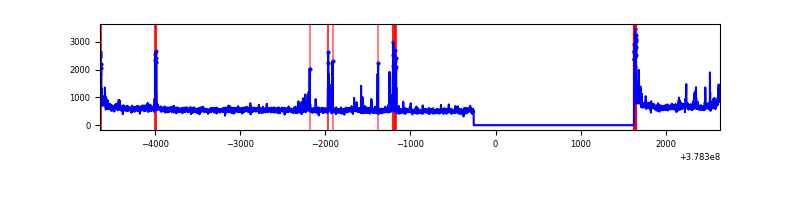 |
| D | 7279 | 5397 | 3195 | 3195 | 43.89% | 59.20% | 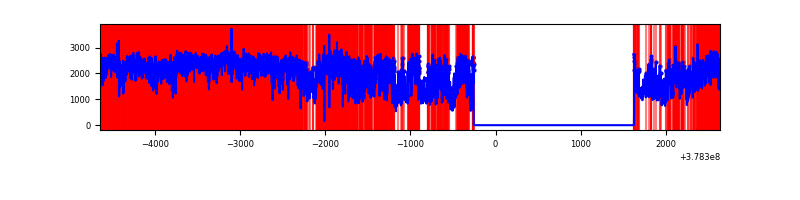 |
Top three noisy pixels from each quadrant. If the there are fewer than three noisy pixels in the level2.evt file, extra rows are filled as -1
| Pixel properties | Quadrant properties | ||||||
|---|---|---|---|---|---|---|---|
| Quadrant | DetID | PixID | Counts | Sigma | Mean | Median | Sigma |
| A | 15 | 237 | 1234923 | 9156.1 | 676 | 665 | 134.8 |
| A | 15 | 169 | 728805 | 5401.56 | 676 | 665 | 134.8 |
| A | 13 | 6 | 13841 | 97.74 | 676 | 665 | 134.8 |
| B | 5 | 172 | 1049726 | 8299.08 | 672 | 656 | 126.4 |
| B | 4 | 251 | 114799 | 902.97 | 672 | 656 | 126.4 |
| B | 0 | 213 | 32018 | 248.1 | 672 | 656 | 126.4 |
| C | 15 | 214 | 236471 | 1527.25 | 674 | 679 | 154.4 |
| C | 3 | 233 | 180931 | 1167.51 | 674 | 679 | 154.4 |
| C | 0 | 10 | 112806 | 726.26 | 674 | 679 | 154.4 |
| D | 12 | 235 | 6736411 | 47409.83 | 578 | 563 | 142.1 |
| D | 8 | 195 | 922935 | 6492.06 | 578 | 563 | 142.1 |
| D | 2 | 250 | 357100 | 2509.46 | 578 | 563 | 142.1 |
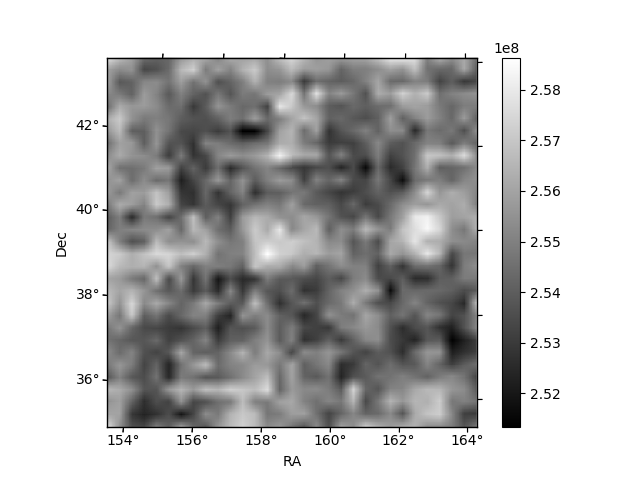
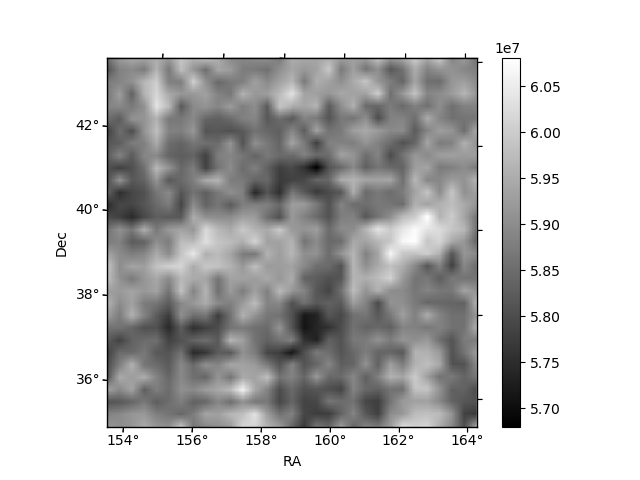
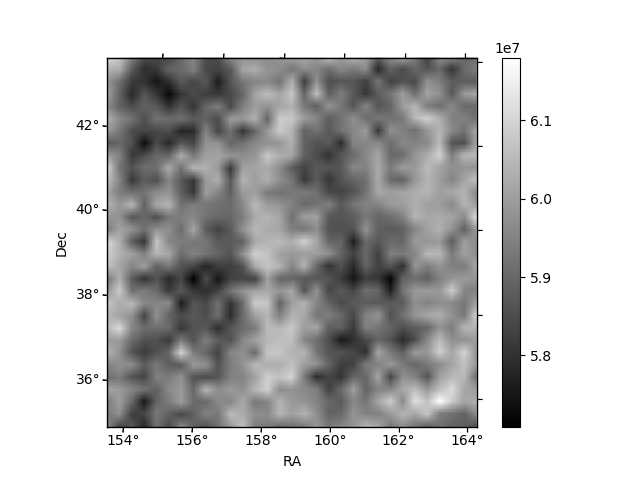
Histogram calculated using DETX and DETY for each event in the final _common_clean file
| Quadrant A | 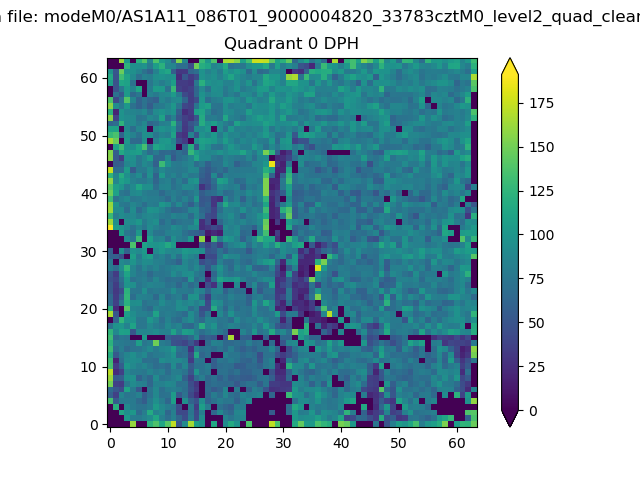 |
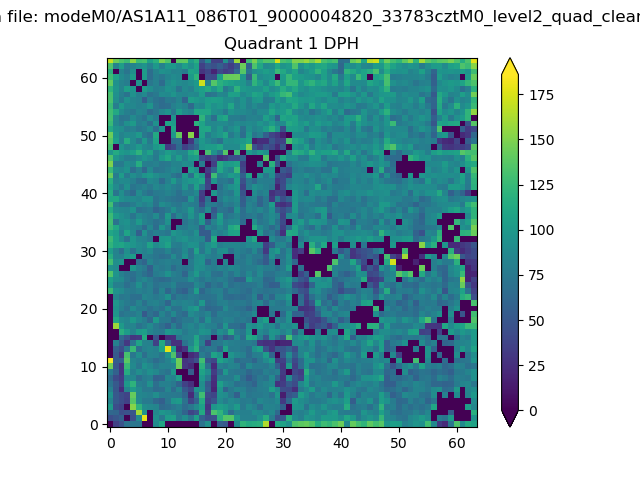 |
Quadrant B |
|---|---|---|---|
| Quadrant D | 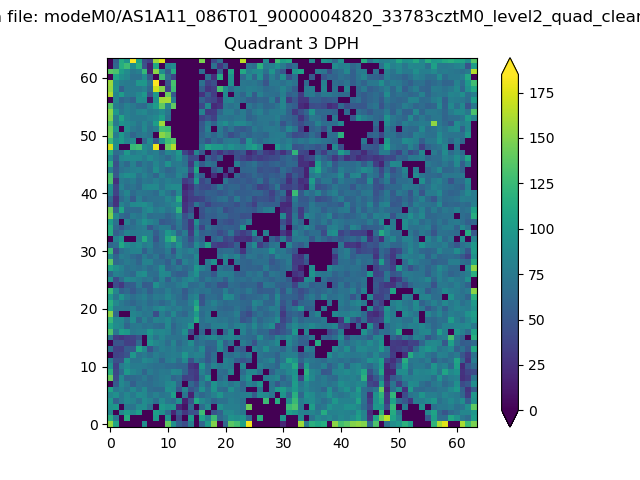 |
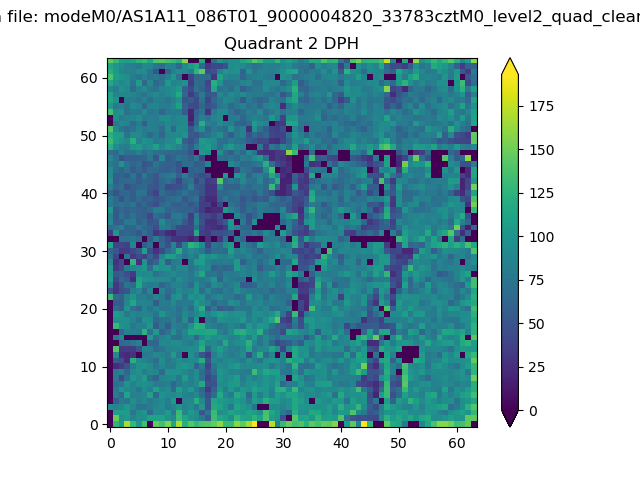 |
Quadrant C |
| Plot type | Count rate plots | Images |
|---|---|---|
| Comparison with Poisson distribution Blue bars denote a histogram of data divided into 1 sec bins. Red curve is a Poisson curve with rate = median count rate of data. |
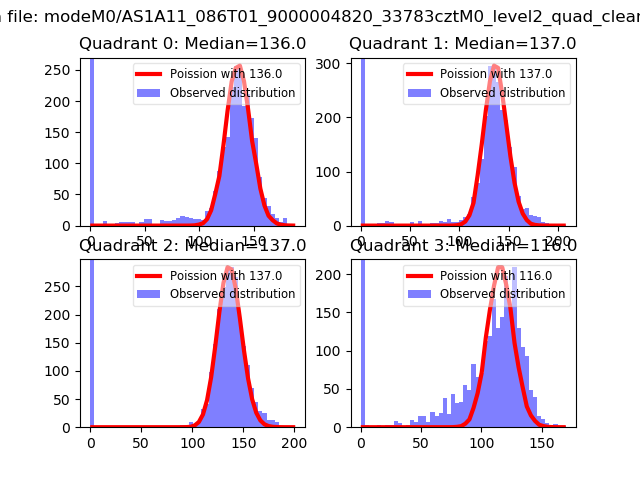 |
 |
| Quadrant-wise count rates Data is divided into 100 sec bins |
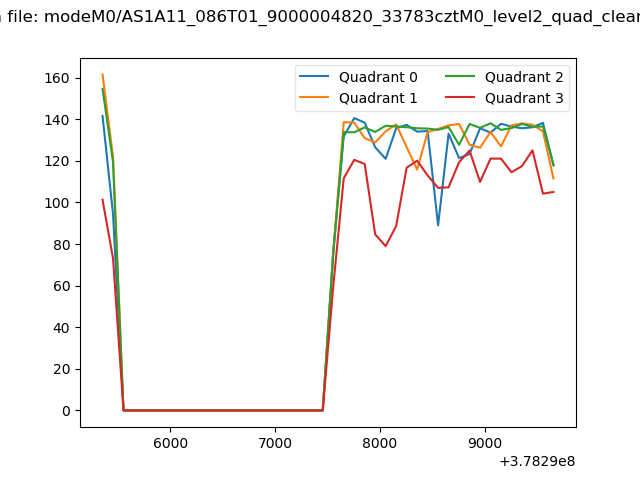 |
|
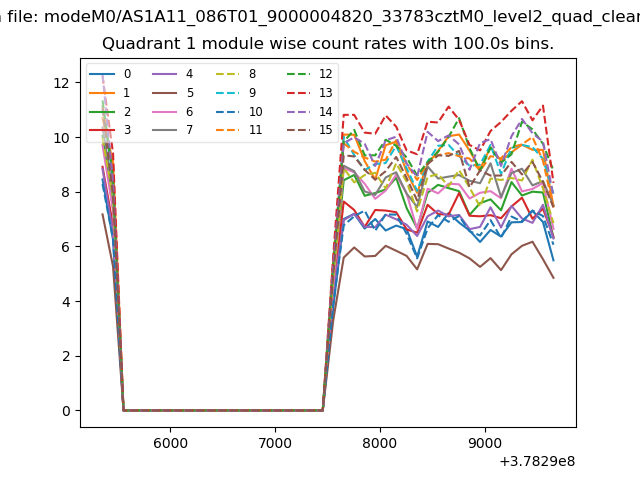
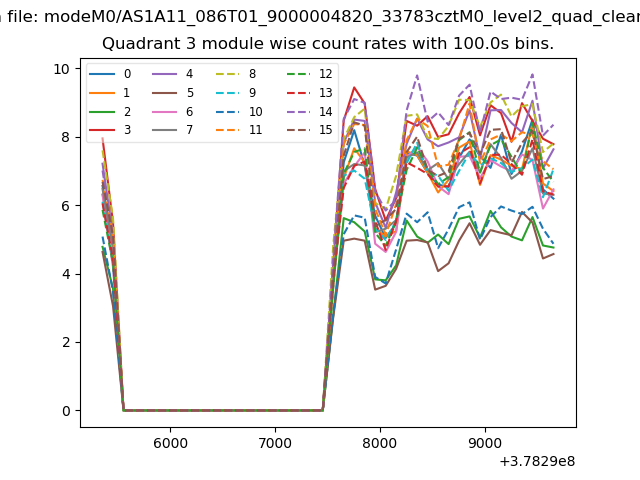
| Module-wise count rates for Quadrant A Data is divided into 100 sec bins |
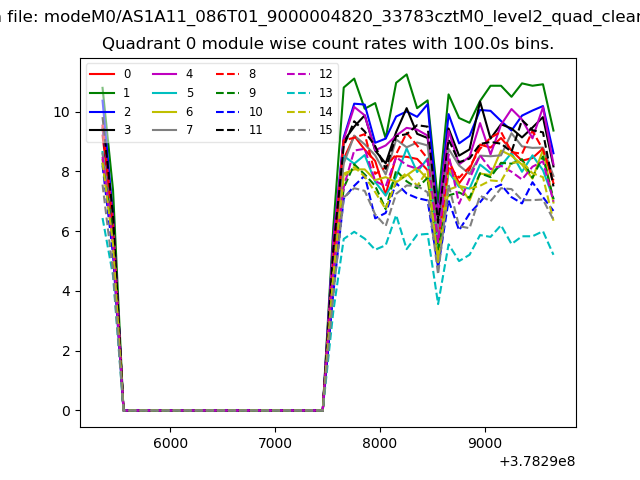 |
 |
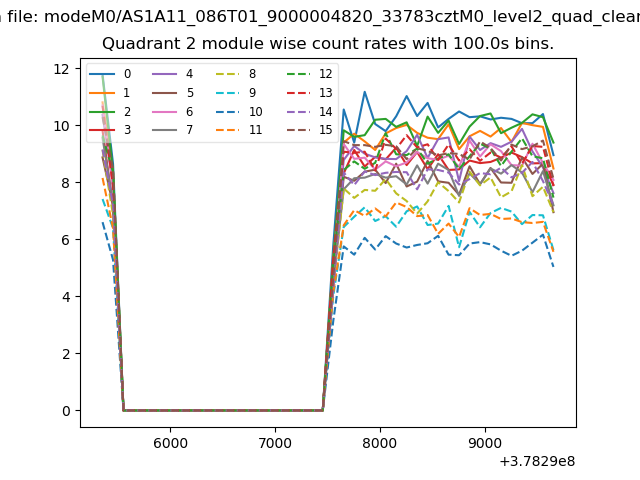
| Module-wise count rates for Quadrant B Data is divided into 100 sec bins |
 |
 |
| Module-wise count rates for Quadrant C Data is divided into 100 sec bins |
 |
 |
| Module-wise count rates for Quadrant D Data is divided into 100 sec bins |
 |
 |
| Parameter | Plot |
|---|---|
| CZT HV Monitor | 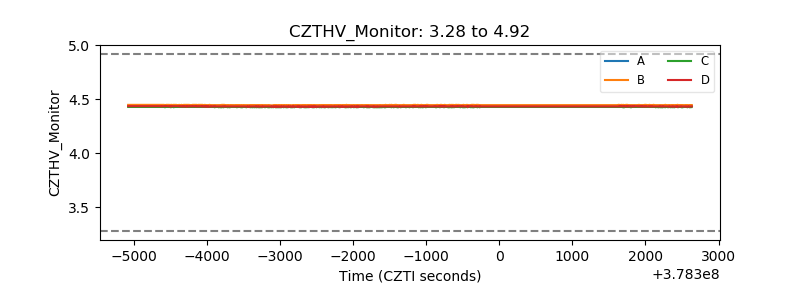 |
| D_VDD | 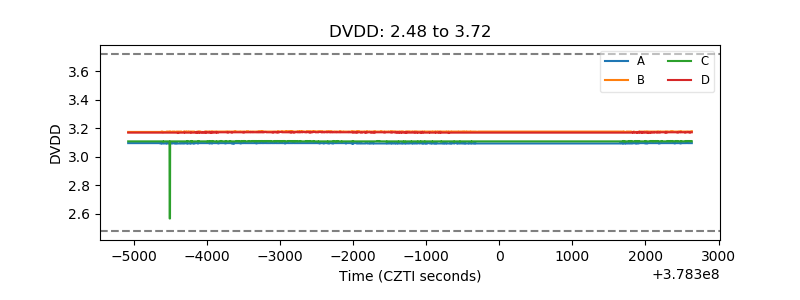 |
| Temperature 1 | 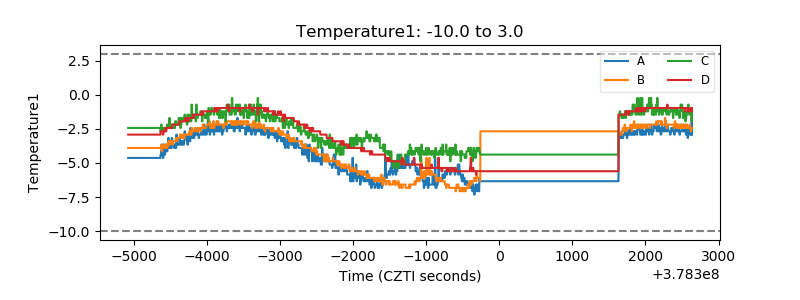 |
| Veto HV Monitor | 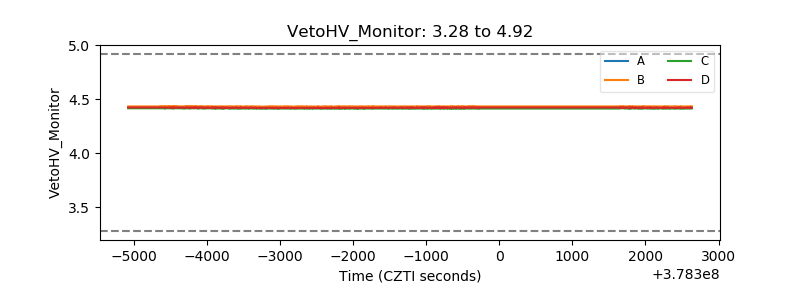 |
| Veto LLD |  |
| Alpha Counter | 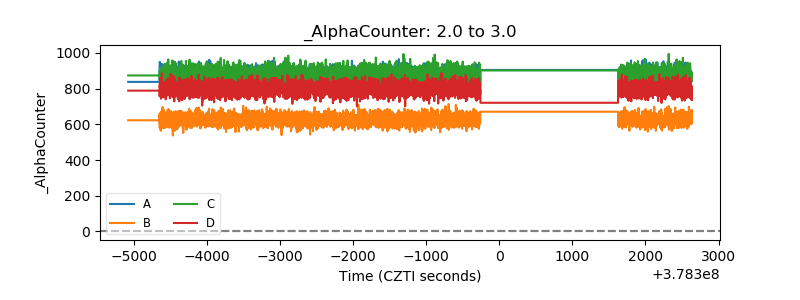 |
| _CPM_Rate | 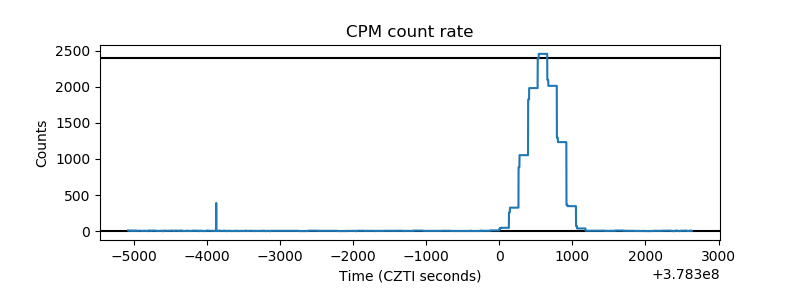 |
| CZT Counter | 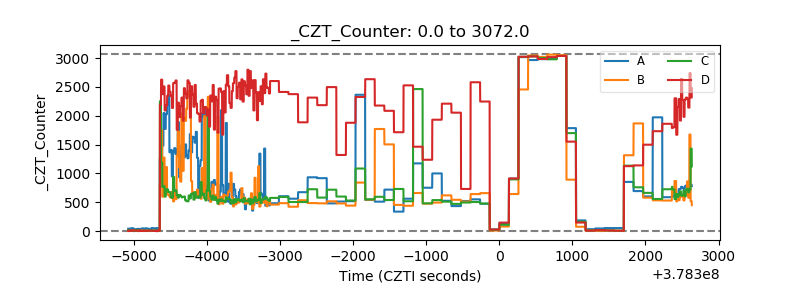 |
| +2.5 Volts monitor |  |
| +5 Volts monitor | 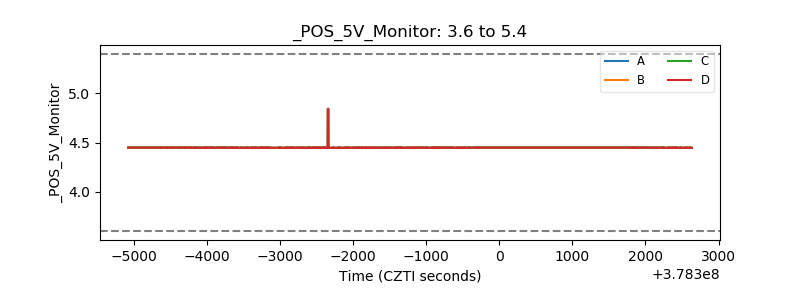 |
| _ROLL_ROT | 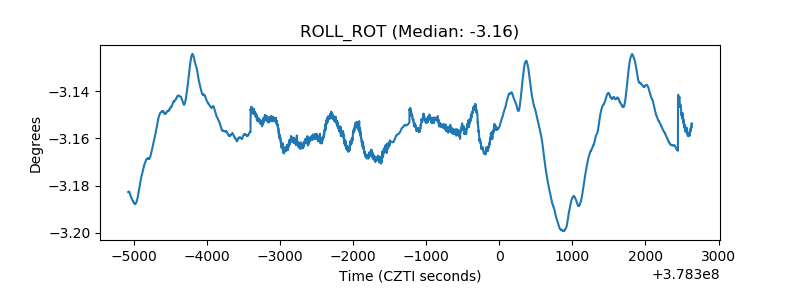 |
| _Roll_DEC | 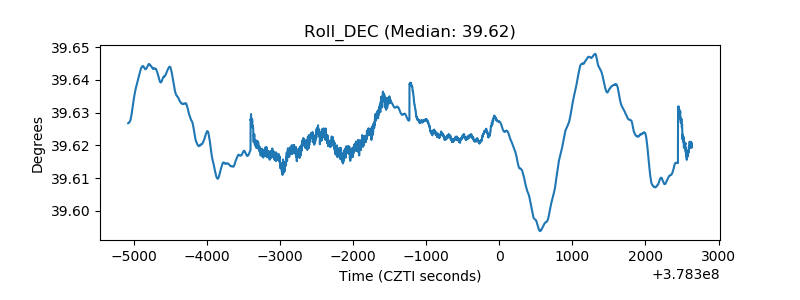 |
| _Roll_RA | 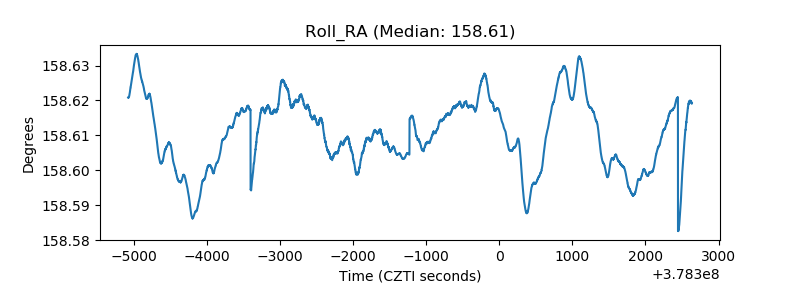 |
| Veto Counter | 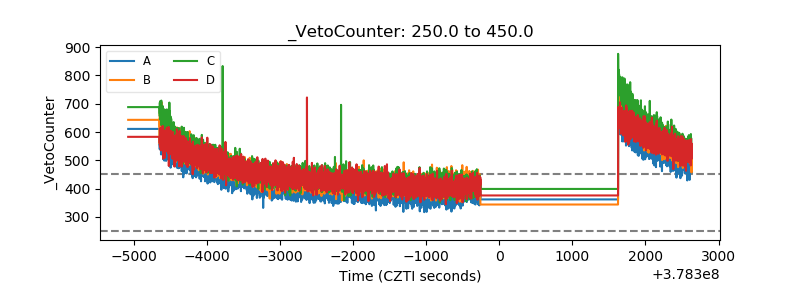 |