| Param | Original file | Final file |
|---|---|---|
| Filename | modeM0/AS1A11_086T01_9000004820_33784cztM0_level2.evt | modeM0/AS1A11_086T01_9000004820_33784cztM0_level2_quad_clean.evt |
| Size (bytes) | 687,885,120 | 56,183,040 |
| Size | 656.0 MB | 53.6 MB |
| Events in quadrant A | 3,571,419 | 345,522 |
| Events in quadrant B | 4,084,447 | 332,237 |
| Events in quadrant C | 3,714,834 | 349,643 |
| Events in quadrant D | 9,106,599 | 303,821 |
| Mode M9 | |||
|---|---|---|---|
| Quadrant | BADHDUFLAG | Total packets | Discarded packets |
| A | 0 | 31 | 0 |
| B | 0 | 31 | 0 |
| C | 0 | 31 | 0 |
| D | 0 | 32 | 0 |
| Mode SS | |||
|---|---|---|---|
| Quadrant | BADHDUFLAG | Total packets | Discarded packets |
| A | 0 | 106 | 0 |
| B | 0 | 106 | 0 |
| C | 0 | 106 | 0 |
| D | 0 | 106 | 0 |
| Mode M0 | |||
|---|---|---|---|
| Quadrant | BADHDUFLAG | Total packets | Discarded packets |
| A | 0 | 14125 | 3 |
| B | 0 | 15553 | 2 |
| C | 0 | 14639 | 2 |
| D | 0 | 30733 | 2 |
| Quadrant | Total seconds | Saturated seconds | Saturation percentage |
|---|---|---|---|
| A | 5279 | 182 | 3.447623% |
| B | 5279 | 436 | 8.259140% |
| C | 5279 | 152 | 2.879333% |
| D | 5279 | 1651 | 31.274863% |
Noise dominated data is calculated using 1-second bins in cleaned event files. If a bin has >2000 counts, and if more than 50% of those come from <1% of pixels, then it is considered to be noise-dominated and hence unusable.
| Quadrant | # 1 sec bins | Bins with >0 counts | Bins with >2000 counts | High rate bins dominated by noise | Noise dominated (total time) | Noise dominated (detector-on time) | Marked lightcurve |
|---|---|---|---|---|---|---|---|
| A | 7282 | 5280 | 139 | 139 | 1.91% | 2.63% | 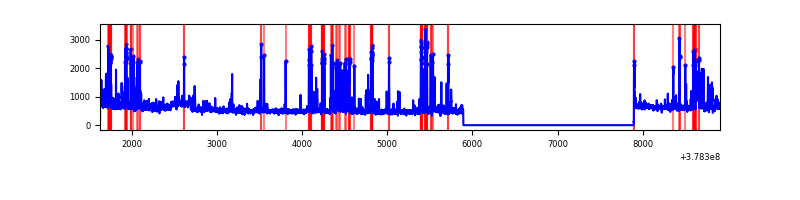 |
| B | 7282 | 5280 | 339 | 339 | 4.66% | 6.42% | 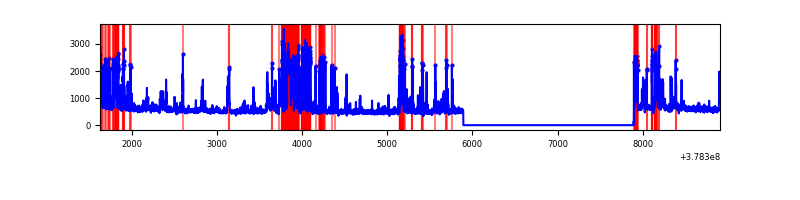 |
| C | 7282 | 5280 | 104 | 104 | 1.43% | 1.97% |  |
| D | 7282 | 5280 | 1708 | 1708 | 23.46% | 32.35% | 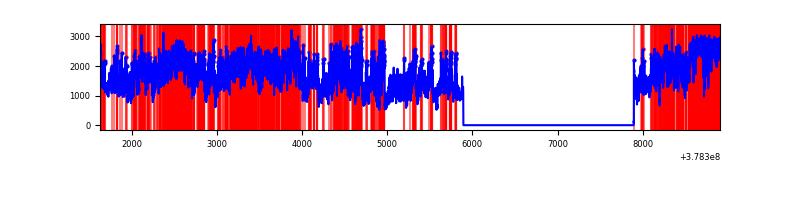 |
Top three noisy pixels from each quadrant. If the there are fewer than three noisy pixels in the level2.evt file, extra rows are filled as -1
| Pixel properties | Quadrant properties | ||||||
|---|---|---|---|---|---|---|---|
| Quadrant | DetID | PixID | Counts | Sigma | Mean | Median | Sigma |
| A | 15 | 237 | 721319 | 5189.04 | 701 | 691 | 138.9 |
| A | 15 | 169 | 105815 | 756.97 | 701 | 691 | 138.9 |
| A | 13 | 6 | 12280 | 83.45 | 701 | 691 | 138.9 |
| B | 5 | 172 | 1000245 | 7818.39 | 680 | 665 | 127.8 |
| B | 3 | 112 | 141353 | 1100.42 | 680 | 665 | 127.8 |
| B | 15 | 222 | 63870 | 494.37 | 680 | 665 | 127.8 |
| C | 3 | 233 | 437334 | 2815.68 | 682 | 691 | 155.1 |
| C | 0 | 10 | 338213 | 2176.5 | 682 | 691 | 155.1 |
| C | 15 | 214 | 227438 | 1462.17 | 682 | 691 | 155.1 |
| D | 12 | 235 | 3923686 | 25563.65 | 628 | 611 | 153.5 |
| D | 8 | 195 | 1351434 | 8802.27 | 628 | 611 | 153.5 |
| D | 2 | 250 | 520625 | 3388.53 | 628 | 611 | 153.5 |
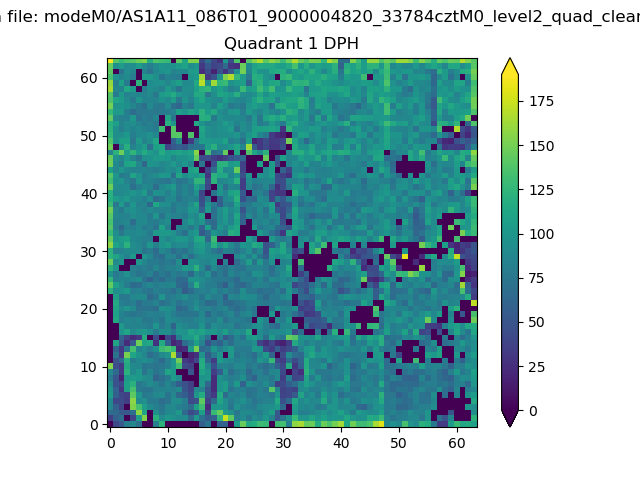
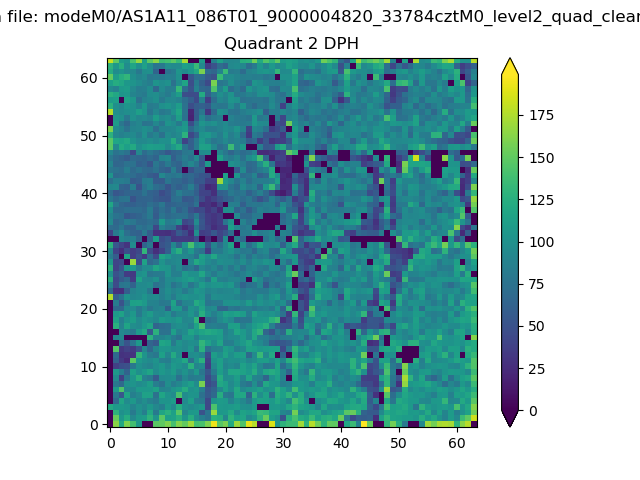
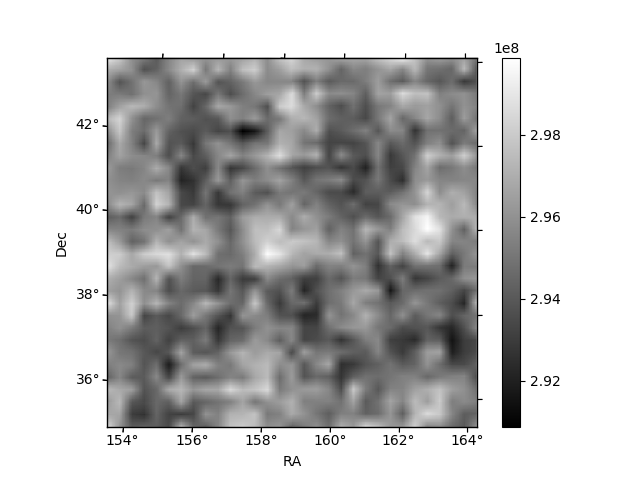
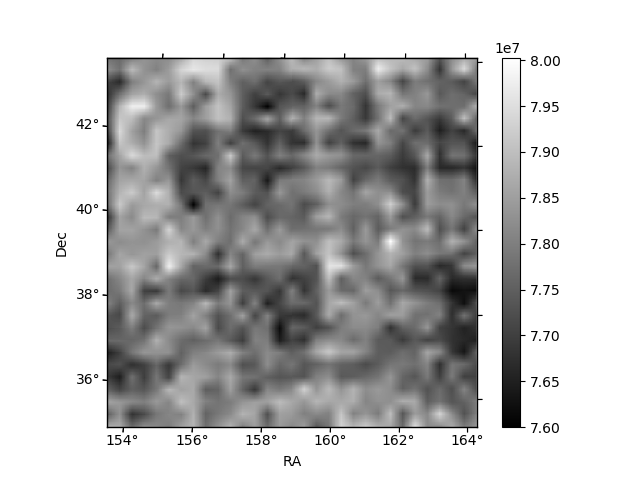
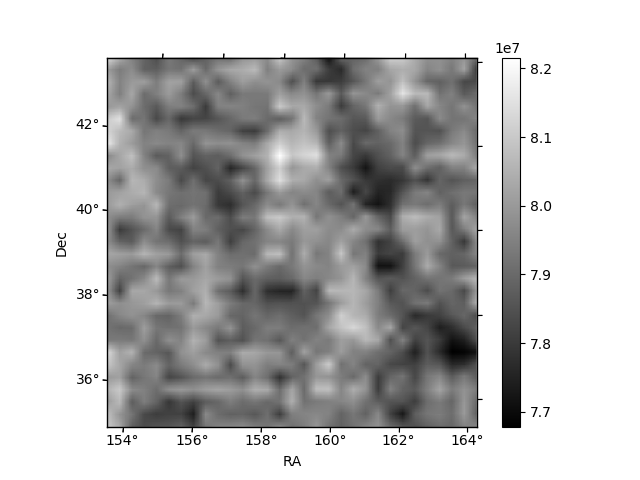
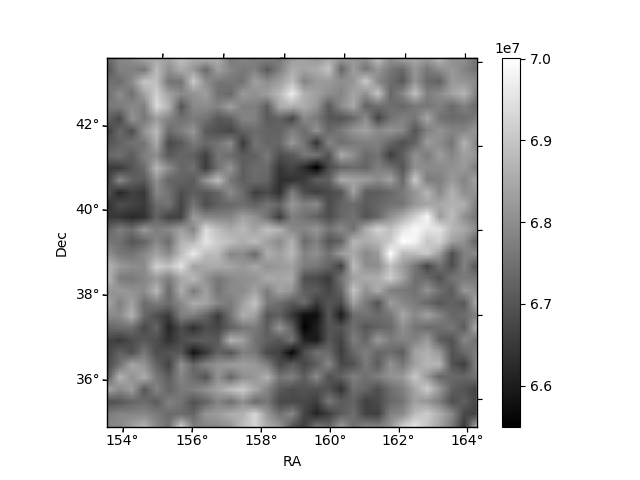
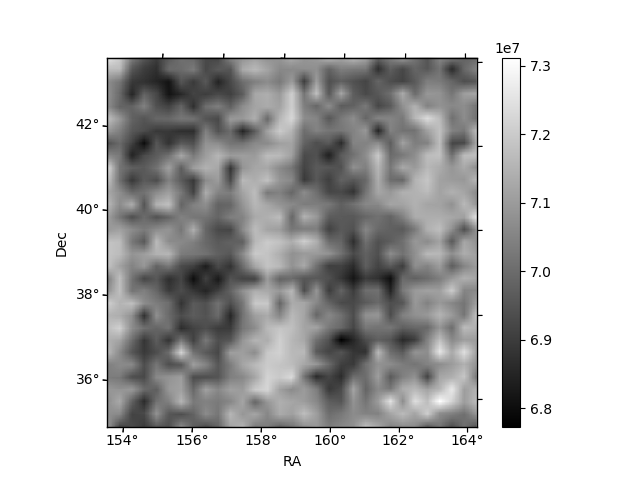
Histogram calculated using DETX and DETY for each event in the final _common_clean file
| Quadrant A | 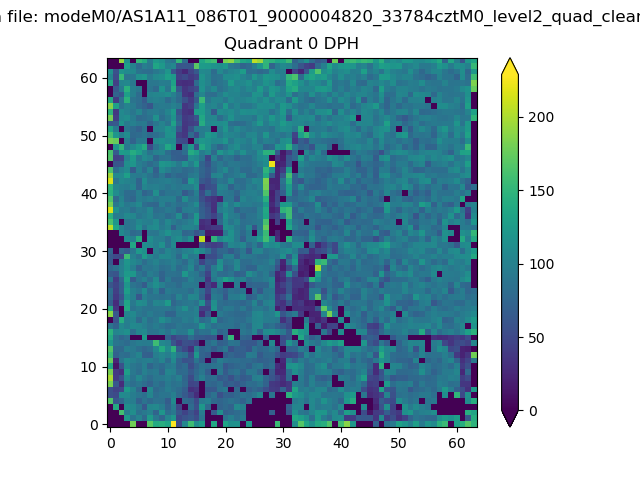 |
 |
Quadrant B |
|---|---|---|---|
| Quadrant D | 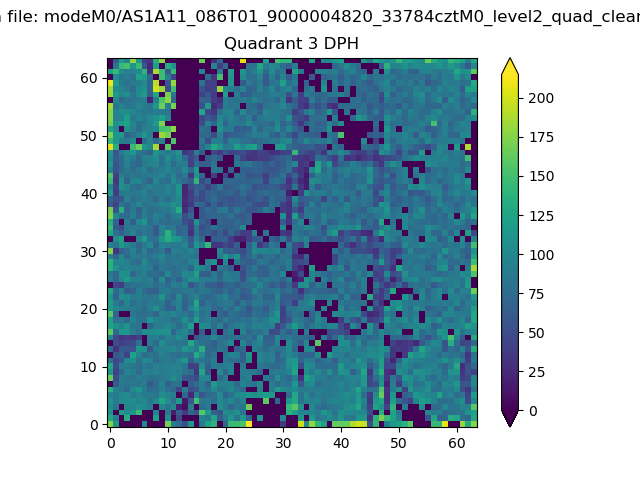 |
 |
Quadrant C |
| Plot type | Count rate plots | Images |
|---|---|---|
| Comparison with Poisson distribution Blue bars denote a histogram of data divided into 1 sec bins. Red curve is a Poisson curve with rate = median count rate of data. |
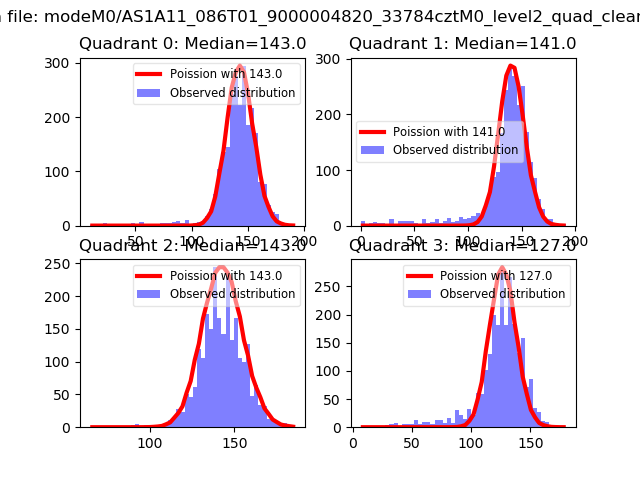 |
 |
| Quadrant-wise count rates Data is divided into 100 sec bins |
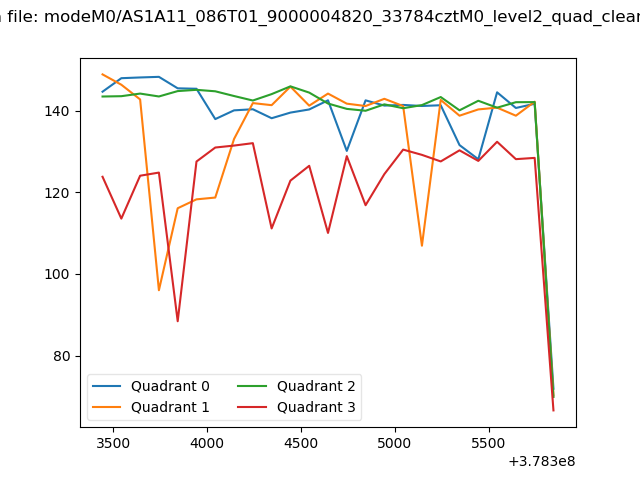 |
|
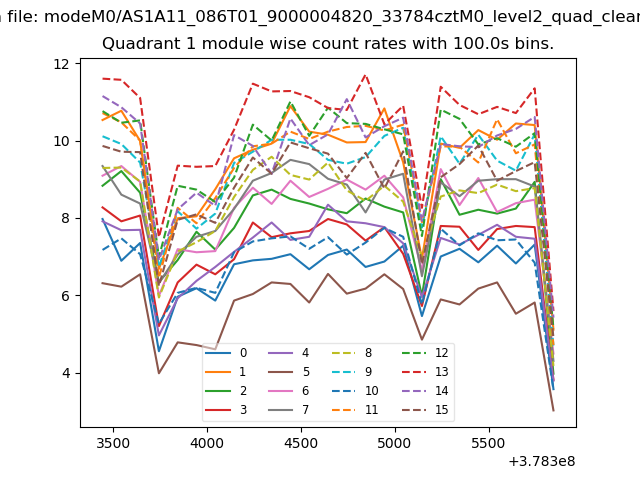
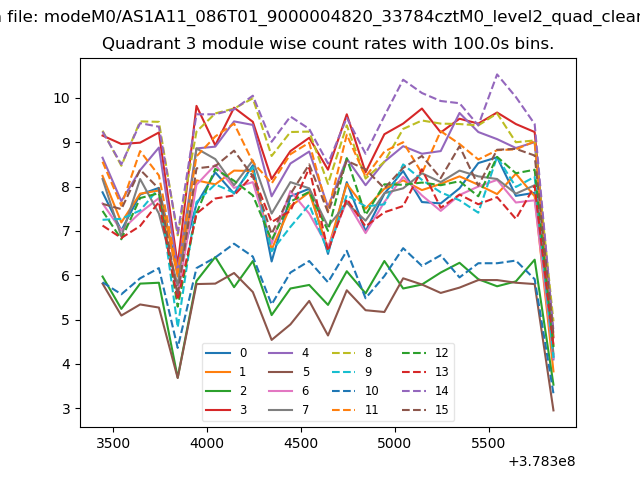
| Module-wise count rates for Quadrant A Data is divided into 100 sec bins |
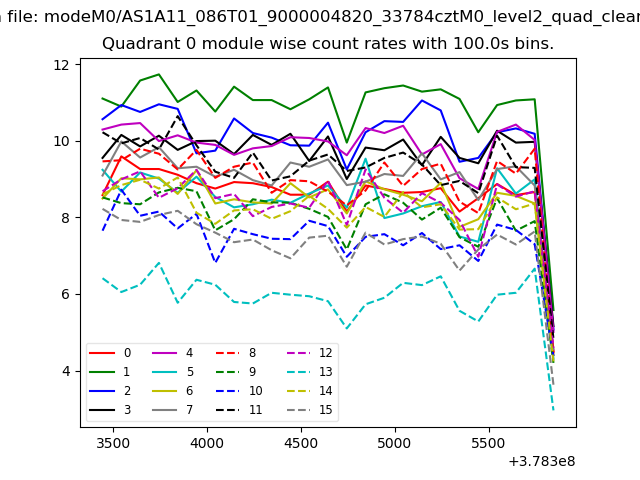 |
 |
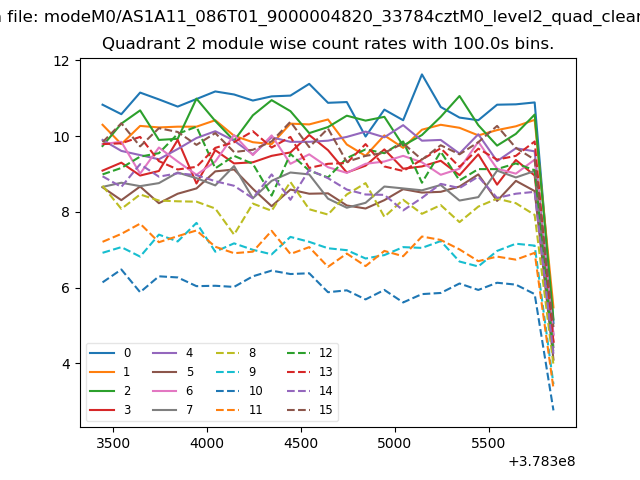
| Module-wise count rates for Quadrant B Data is divided into 100 sec bins |
 |
 |
| Module-wise count rates for Quadrant C Data is divided into 100 sec bins |
 |
 |
| Module-wise count rates for Quadrant D Data is divided into 100 sec bins |
 |
 |
| Parameter | Plot |
|---|---|
| CZT HV Monitor | 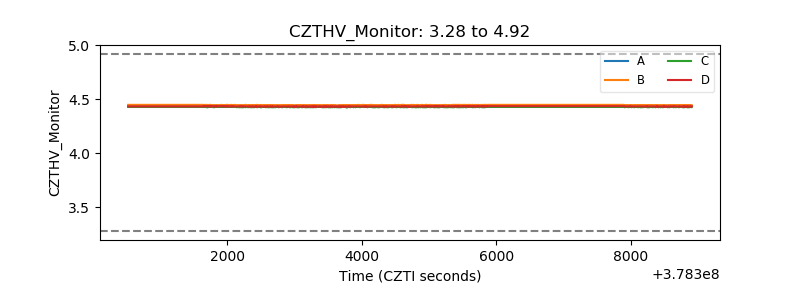 |
| D_VDD | 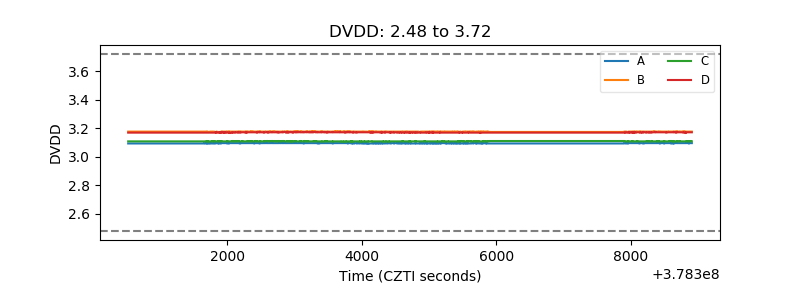 |
| Temperature 1 | 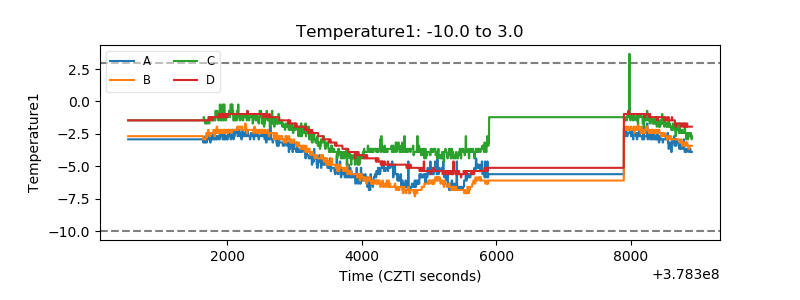 |
| Veto HV Monitor |  |
| Veto LLD |  |
| Alpha Counter | 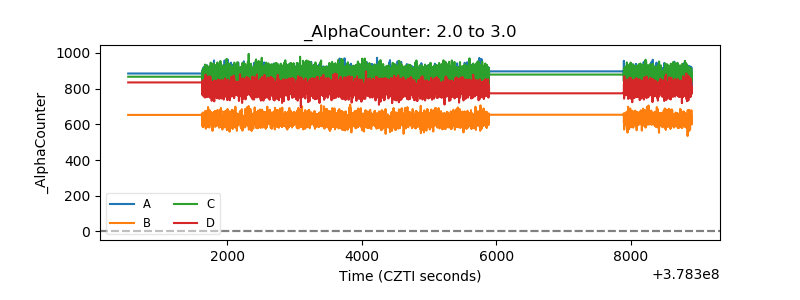 |
| _CPM_Rate | 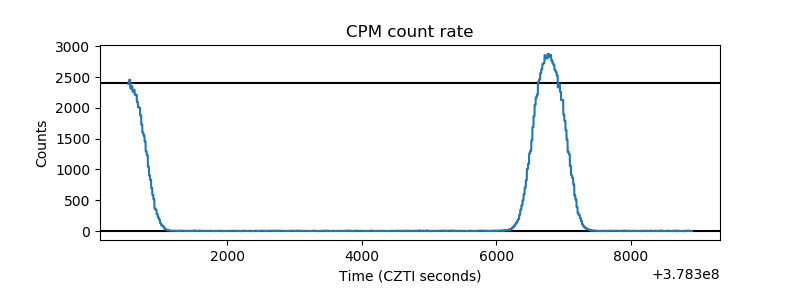 |
| CZT Counter | 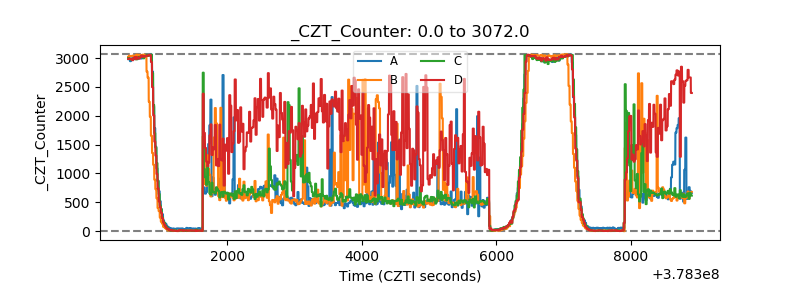 |
| +2.5 Volts monitor |  |
| +5 Volts monitor | 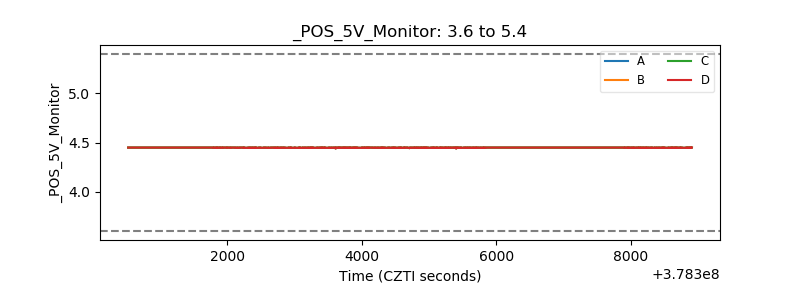 |
| _ROLL_ROT | 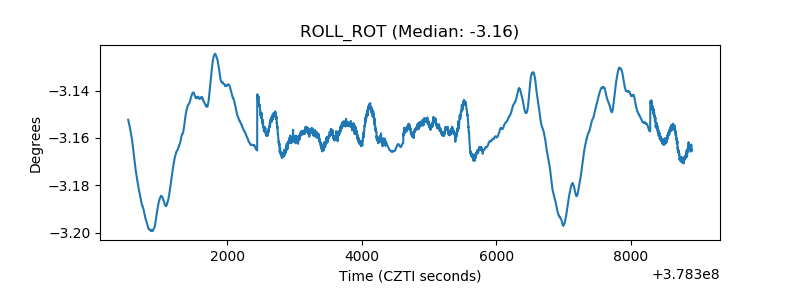 |
| _Roll_DEC | 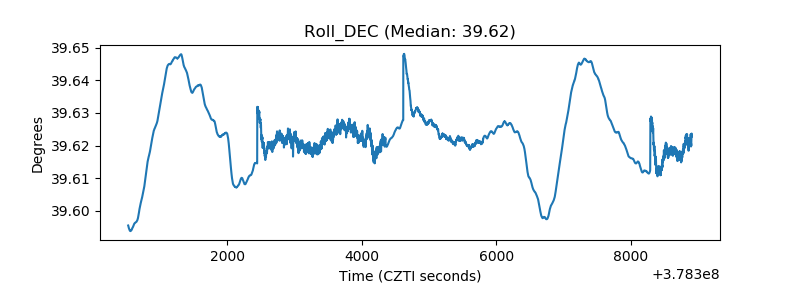 |
| _Roll_RA |  |
| Veto Counter | 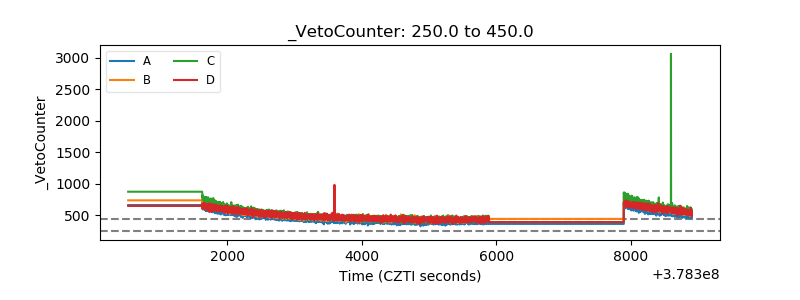 |