| Param | Original file | Final file |
|---|---|---|
| Filename | modeM0/AS1A11_086T01_9000004820_33785cztM0_level2.evt | modeM0/AS1A11_086T01_9000004820_33785cztM0_level2_quad_clean.evt |
| Size (bytes) | 762,762,240 | 57,188,160 |
| Size | 727.4 MB | 54.5 MB |
| Events in quadrant A | 3,813,095 | 405,778 |
| Events in quadrant B | 3,630,718 | 404,757 |
| Events in quadrant C | 3,313,906 | 413,100 |
| Events in quadrant D | 12,001,181 | 151,828 |
| Mode M9 | |||
|---|---|---|---|
| Quadrant | BADHDUFLAG | Total packets | Discarded packets |
| A | 0 | 23 | 0 |
| B | 0 | 23 | 0 |
| C | 0 | 23 | 0 |
| D | 0 | 24 | 0 |
| Mode SS | |||
|---|---|---|---|
| Quadrant | BADHDUFLAG | Total packets | Discarded packets |
| A | 0 | 104 | 0 |
| B | 0 | 104 | 0 |
| C | 0 | 104 | 0 |
| D | 0 | 104 | 0 |
| Mode M0 | |||
|---|---|---|---|
| Quadrant | BADHDUFLAG | Total packets | Discarded packets |
| A | 0 | 14698 | 3 |
| B | 0 | 14142 | 2 |
| C | 0 | 13123 | 2 |
| D | 0 | 39034 | 2 |
| Quadrant | Total seconds | Saturated seconds | Saturation percentage |
|---|---|---|---|
| A | 5059 | 385 | 7.610200% |
| B | 5059 | 279 | 5.514924% |
| C | 5059 | 123 | 2.431311% |
| D | 5059 | 4027 | 79.600712% |
Noise dominated data is calculated using 1-second bins in cleaned event files. If a bin has >2000 counts, and if more than 50% of those come from <1% of pixels, then it is considered to be noise-dominated and hence unusable.
| Quadrant | # 1 sec bins | Bins with >0 counts | Bins with >2000 counts | High rate bins dominated by noise | Noise dominated (total time) | Noise dominated (detector-on time) | Marked lightcurve |
|---|---|---|---|---|---|---|---|
| A | 7152 | 5060 | 284 | 284 | 3.97% | 5.61% | 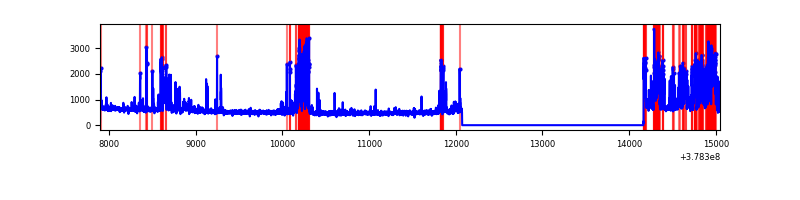 |
| B | 7152 | 5060 | 203 | 203 | 2.84% | 4.01% | 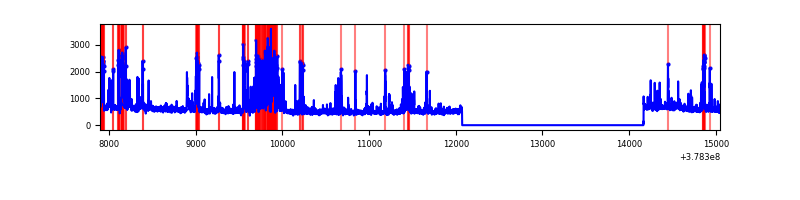 |
| C | 7152 | 5060 | 76 | 76 | 1.06% | 1.50% | 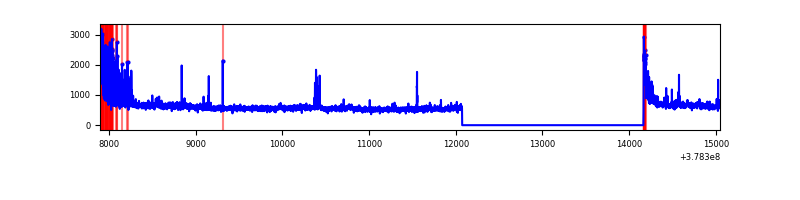 |
| D | 7152 | 5060 | 3975 | 3975 | 55.58% | 78.56% | 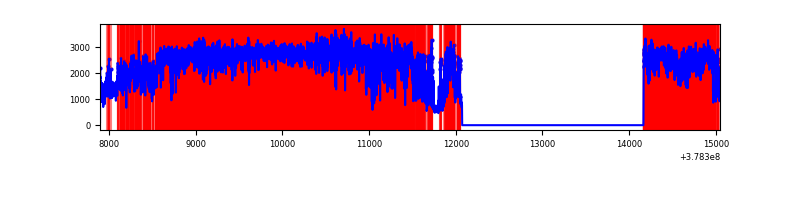 |
Top three noisy pixels from each quadrant. If the there are fewer than three noisy pixels in the level2.evt file, extra rows are filled as -1
| Pixel properties | Quadrant properties | ||||||
|---|---|---|---|---|---|---|---|
| Quadrant | DetID | PixID | Counts | Sigma | Mean | Median | Sigma |
| A | 15 | 237 | 1125042 | 8554.91 | 661 | 652 | 131.4 |
| A | 15 | 169 | 95902 | 724.71 | 661 | 652 | 131.4 |
| A | 13 | 6 | 12557 | 90.58 | 661 | 652 | 131.4 |
| B | 5 | 172 | 728924 | 5927.24 | 665 | 650 | 122.9 |
| B | 4 | 251 | 80698 | 651.49 | 665 | 650 | 122.9 |
| B | 0 | 197 | 41364 | 331.36 | 665 | 650 | 122.9 |
| C | 0 | 10 | 312524 | 2075.55 | 662 | 670 | 150.3 |
| C | 15 | 214 | 218016 | 1446.55 | 662 | 670 | 150.3 |
| C | 3 | 233 | 116580 | 771.44 | 662 | 670 | 150.3 |
| D | 12 | 235 | 7695511 | 86810.52 | 356 | 345 | 88.6 |
| D | 8 | 195 | 836433 | 9432.06 | 356 | 345 | 88.6 |
| D | 12 | 233 | 783991 | 8840.45 | 356 | 345 | 88.6 |
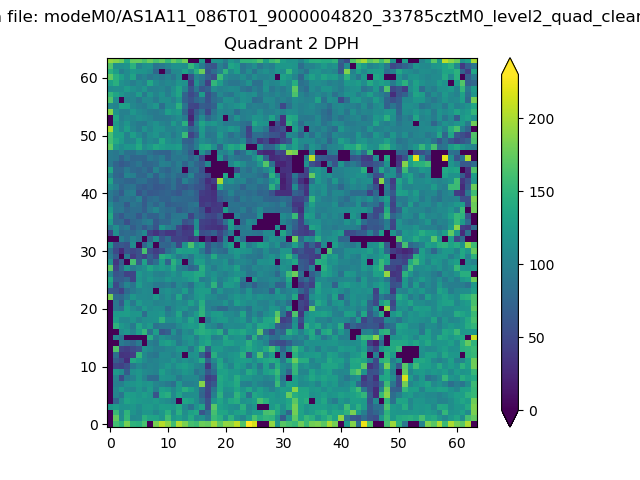
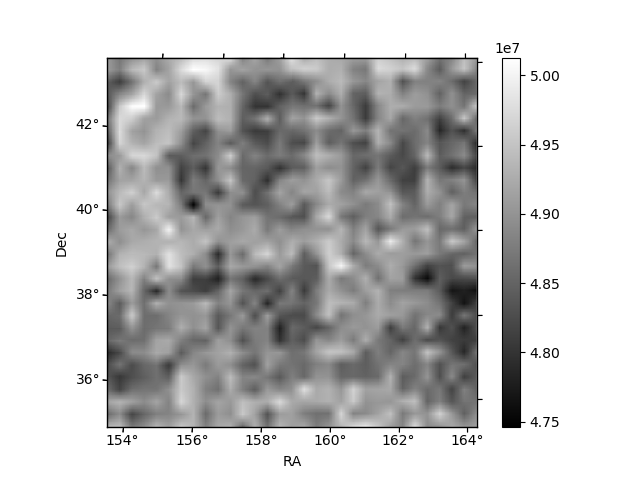
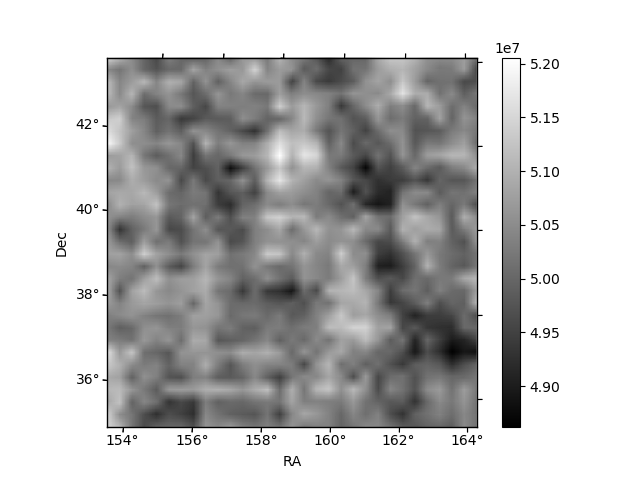
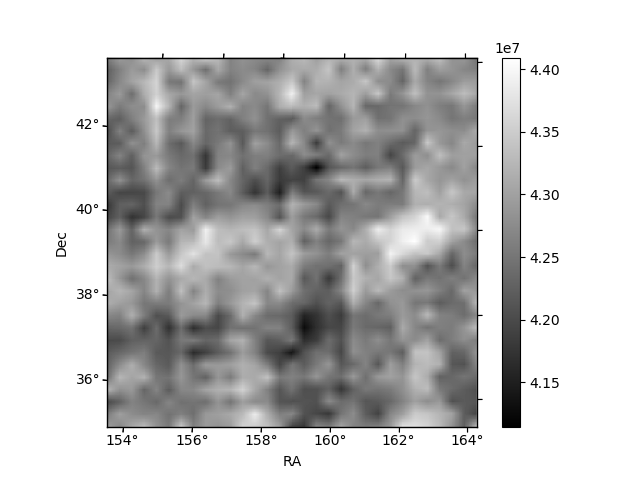
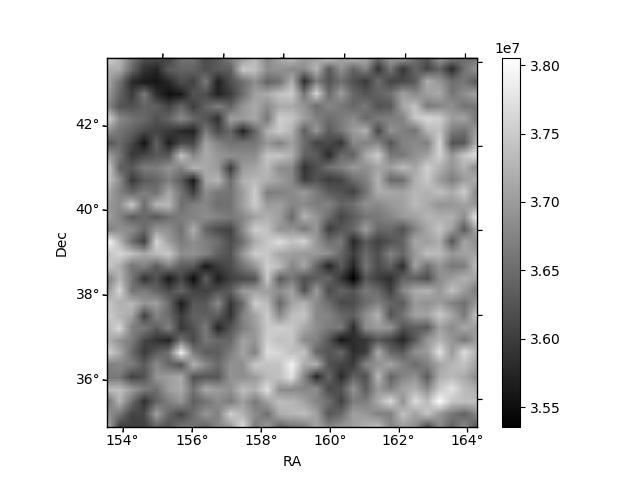
Histogram calculated using DETX and DETY for each event in the final _common_clean file
| Quadrant A | 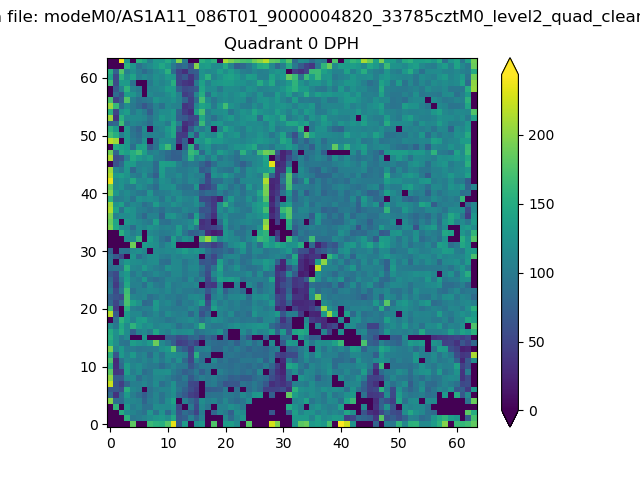 |
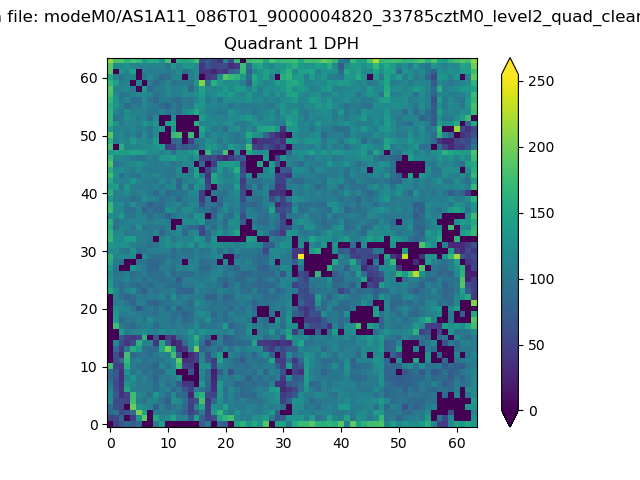 |
Quadrant B |
|---|---|---|---|
| Quadrant D | 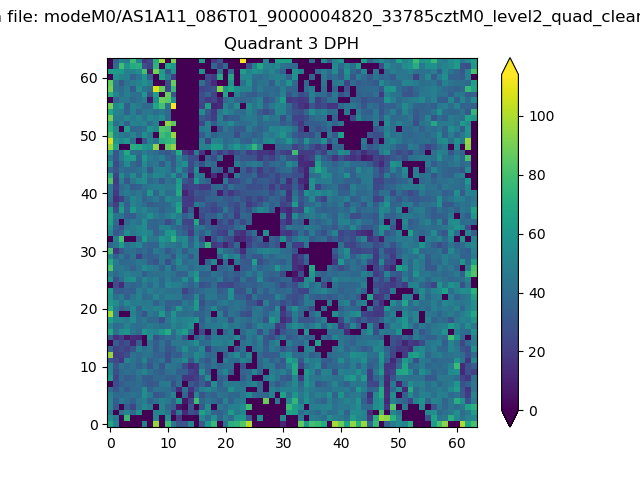 |
 |
Quadrant C |
| Plot type | Count rate plots | Images |
|---|---|---|
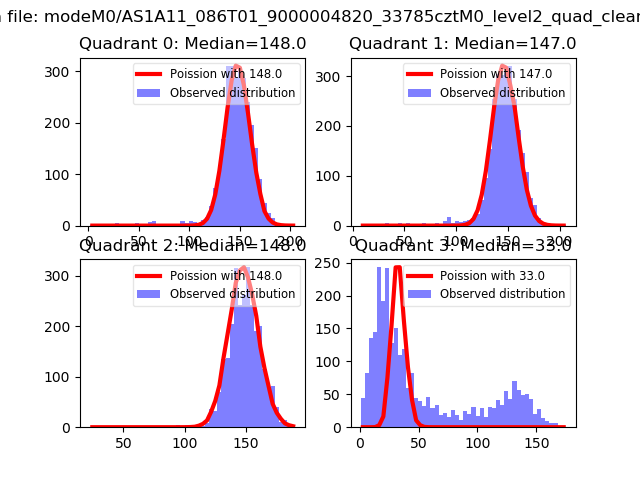
| Comparison with Poisson distribution Blue bars denote a histogram of data divided into 1 sec bins. Red curve is a Poisson curve with rate = median count rate of data. |
 |
 |
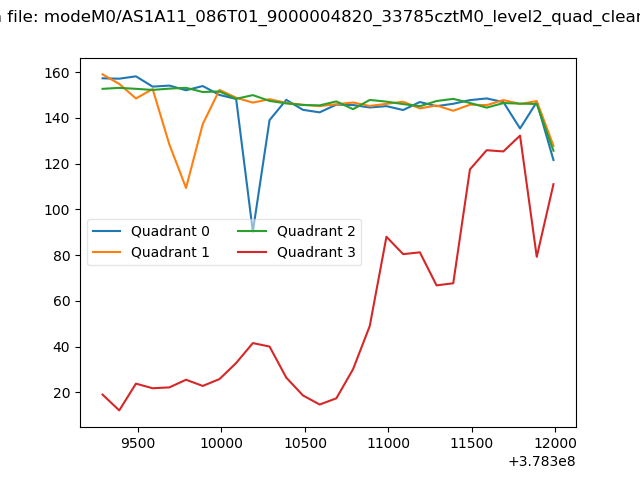
| Quadrant-wise count rates Data is divided into 100 sec bins |
 |
|
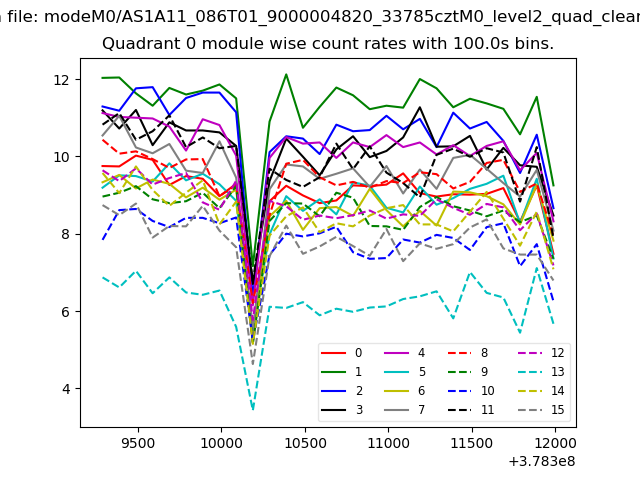
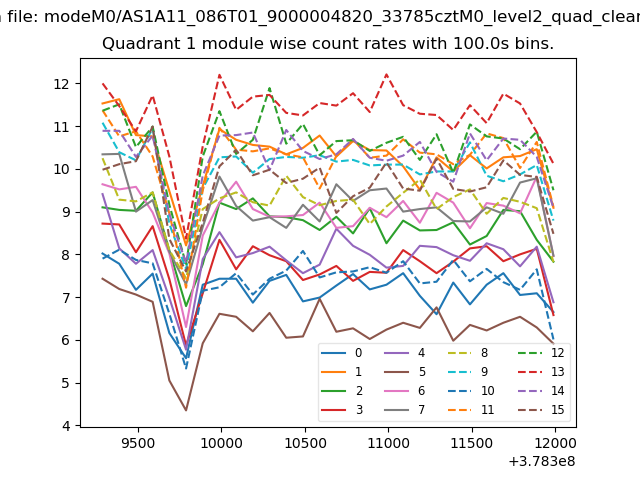
| Module-wise count rates for Quadrant A Data is divided into 100 sec bins |
 |
 |
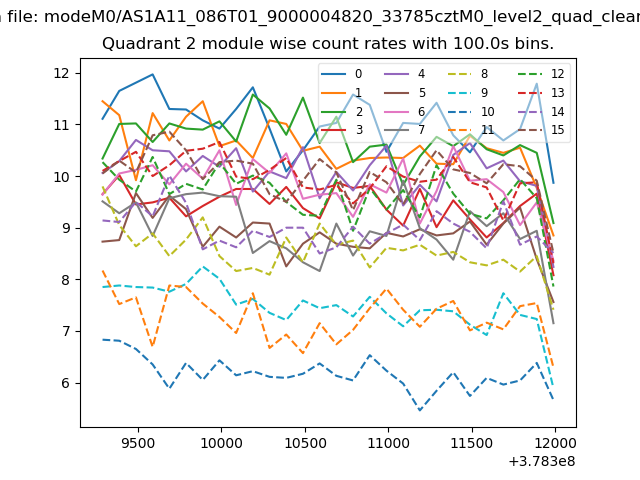
| Module-wise count rates for Quadrant B Data is divided into 100 sec bins |
 |
 |
| Module-wise count rates for Quadrant C Data is divided into 100 sec bins |
 |
 |
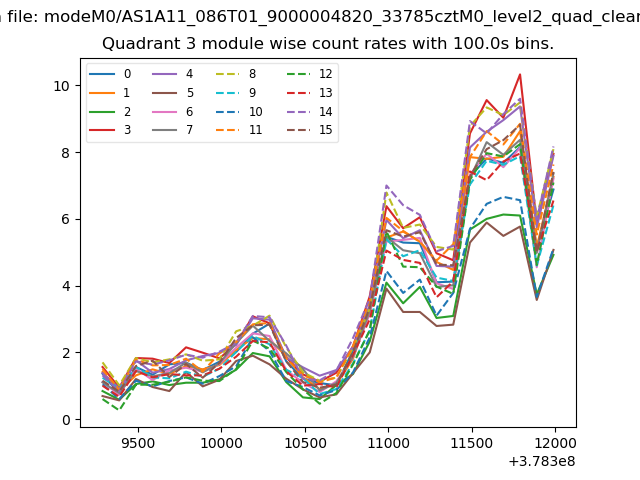
| Module-wise count rates for Quadrant D Data is divided into 100 sec bins |
 |
 |
| Parameter | Plot |
|---|---|
| CZT HV Monitor |  |
| D_VDD | 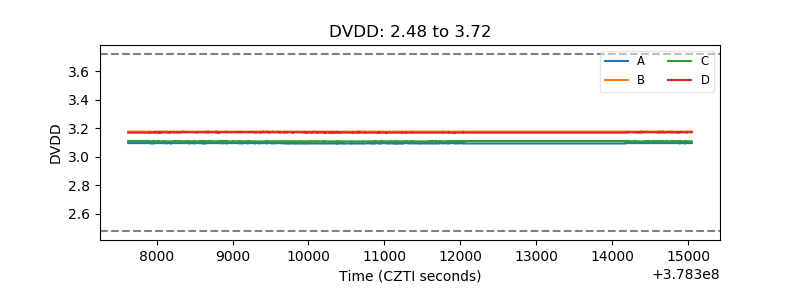 |
| Temperature 1 | 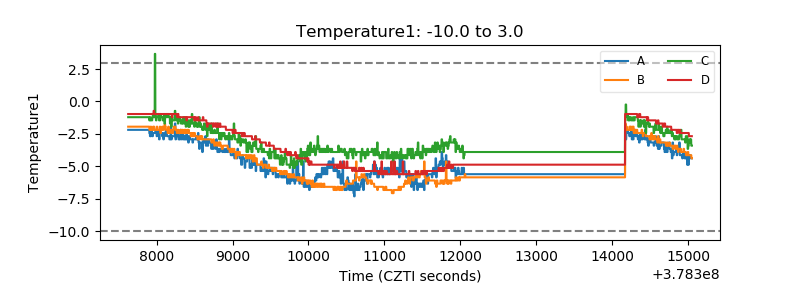 |
| Veto HV Monitor | 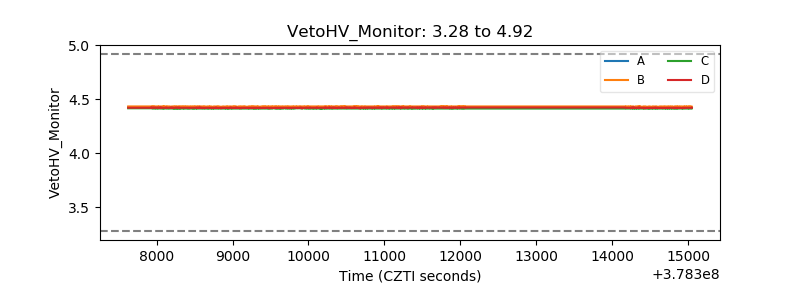 |
| Veto LLD | 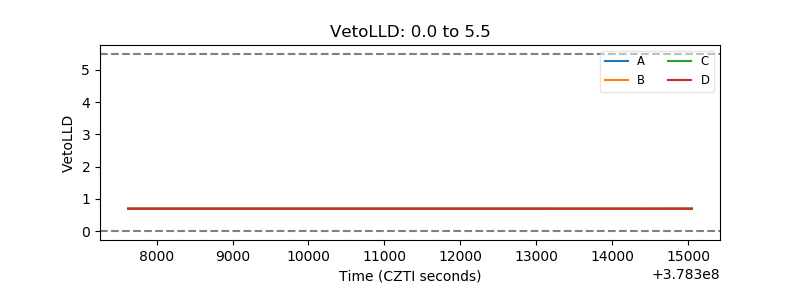 |
| Alpha Counter | 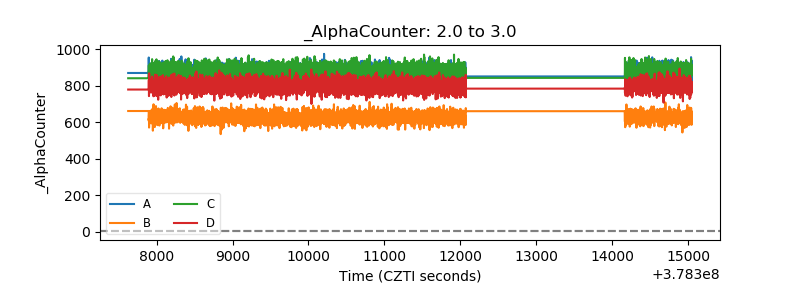 |
| _CPM_Rate | 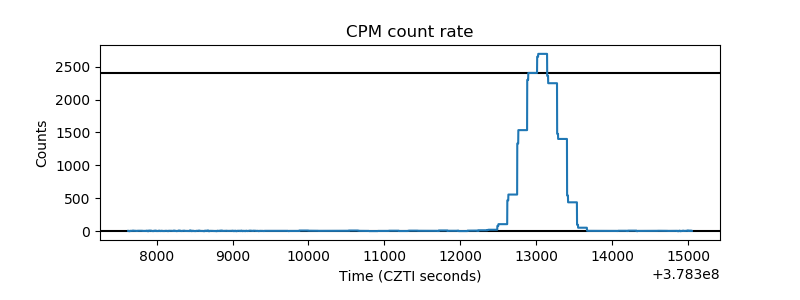 |
| CZT Counter | 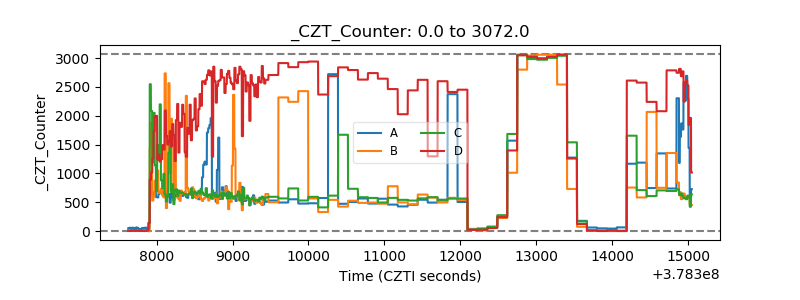 |
| +2.5 Volts monitor |  |
| +5 Volts monitor |  |
| _ROLL_ROT | 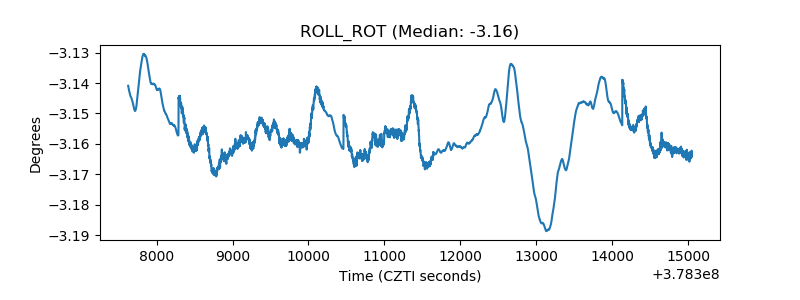 |
| _Roll_DEC | 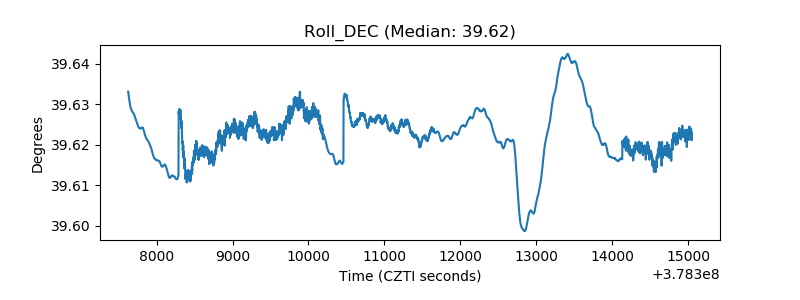 |
| _Roll_RA | 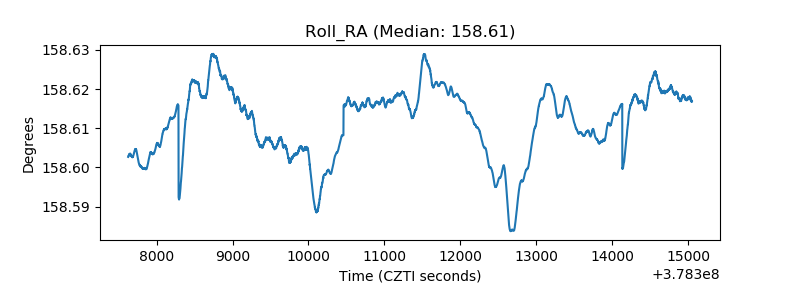 |
| Veto Counter | 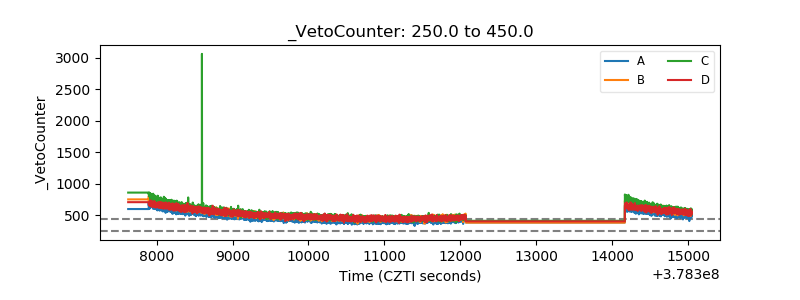 |