| Param | Original file | Final file |
|---|---|---|
| Filename | modeM0/AS1A11_086T01_9000004820_33789cztM0_level2.evt | modeM0/AS1A11_086T01_9000004820_33789cztM0_level2_quad_clean.evt |
| Size (bytes) | 660,421,440 | 82,068,480 |
| Size | 629.8 MB | 78.3 MB |
| Events in quadrant A | 5,260,668 | 509,998 |
| Events in quadrant B | 3,731,500 | 546,670 |
| Events in quadrant C | 3,029,028 | 555,546 |
| Events in quadrant D | 7,597,287 | 476,512 |
| Mode M9 | |||
|---|---|---|---|
| Quadrant | BADHDUFLAG | Total packets | Discarded packets |
| A | 0 | 24 | 0 |
| B | 0 | 24 | 0 |
| C | 0 | 24 | 0 |
| D | 0 | 25 | 0 |
| Mode SS | |||
|---|---|---|---|
| Quadrant | BADHDUFLAG | Total packets | Discarded packets |
| A | 0 | 114 | 0 |
| B | 0 | 114 | 0 |
| C | 0 | 114 | 0 |
| D | 0 | 114 | 0 |
| Mode M0 | |||
|---|---|---|---|
| Quadrant | BADHDUFLAG | Total packets | Discarded packets |
| A | 0 | 19516 | 3 |
| B | 0 | 14924 | 2 |
| C | 0 | 12478 | 2 |
| D | 0 | 26573 | 2 |
| Quadrant | Total seconds | Saturated seconds | Saturation percentage |
|---|---|---|---|
| A | 5664 | 892 | 15.748588% |
| B | 5664 | 219 | 3.866525% |
| C | 5664 | 70 | 1.235876% |
| D | 5664 | 1289 | 22.757768% |
Noise dominated data is calculated using 1-second bins in cleaned event files. If a bin has >2000 counts, and if more than 50% of those come from <1% of pixels, then it is considered to be noise-dominated and hence unusable.
| Quadrant | # 1 sec bins | Bins with >0 counts | Bins with >2000 counts | High rate bins dominated by noise | Noise dominated (total time) | Noise dominated (detector-on time) | Marked lightcurve |
|---|---|---|---|---|---|---|---|
| A | 7187 | 5665 | 688 | 688 | 9.57% | 12.14% | 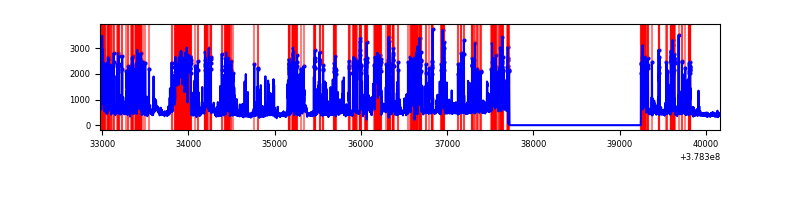 |
| B | 7187 | 5665 | 147 | 147 | 2.05% | 2.59% | 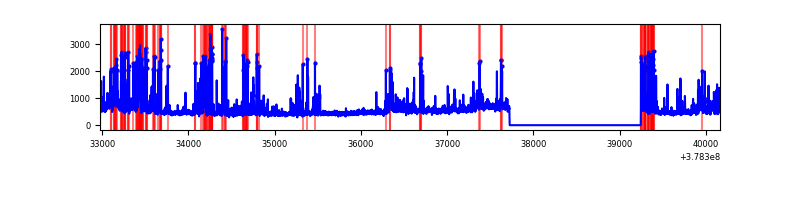 |
| C | 7187 | 5665 | 55 | 55 | 0.77% | 0.97% | 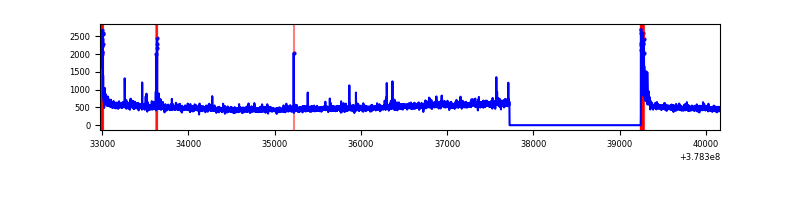 |
| D | 7187 | 5665 | 1258 | 1258 | 17.50% | 22.21% | 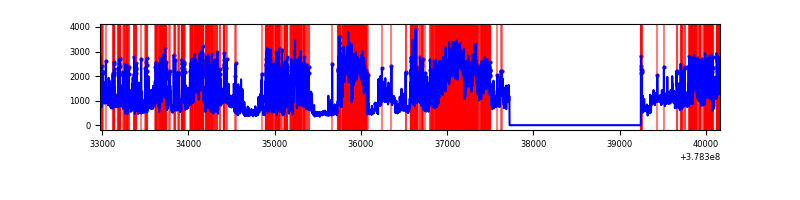 |
Top three noisy pixels from each quadrant. If the there are fewer than three noisy pixels in the level2.evt file, extra rows are filled as -1
| Pixel properties | Quadrant properties | ||||||
|---|---|---|---|---|---|---|---|
| Quadrant | DetID | PixID | Counts | Sigma | Mean | Median | Sigma |
| A | 15 | 237 | 2521604 | 20651.22 | 607 | 595 | 122.1 |
| A | 15 | 169 | 327078 | 2674.43 | 607 | 595 | 122.1 |
| A | 7 | 16 | 39581 | 319.36 | 607 | 595 | 122.1 |
| B | 5 | 172 | 648286 | 5241.81 | 645 | 627 | 123.6 |
| B | 0 | 197 | 131799 | 1061.64 | 645 | 627 | 123.6 |
| B | 15 | 222 | 97621 | 785.02 | 645 | 627 | 123.6 |
| C | 15 | 214 | 244705 | 1656.19 | 638 | 643 | 147.4 |
| C | 0 | 10 | 158557 | 1071.59 | 638 | 643 | 147.4 |
| C | 3 | 233 | 96148 | 648.09 | 638 | 643 | 147.4 |
| D | 12 | 235 | 2461561 | 17404.54 | 573 | 556 | 141.4 |
| D | 8 | 195 | 1071958 | 7577.09 | 573 | 556 | 141.4 |
| D | 2 | 250 | 823583 | 5820.55 | 573 | 556 | 141.4 |
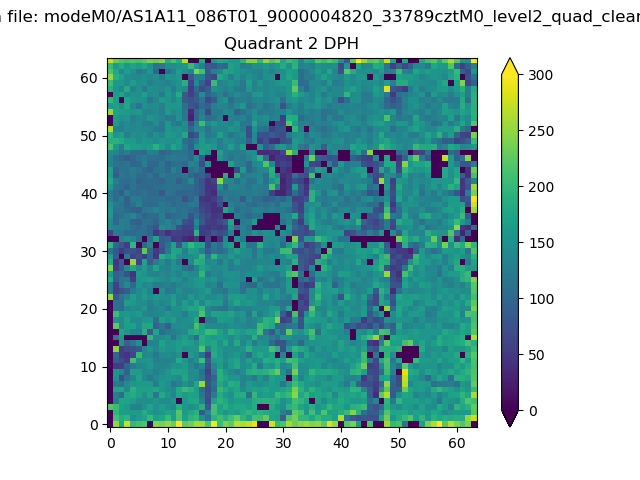
Histogram calculated using DETX and DETY for each event in the final _common_clean file
| Quadrant A | 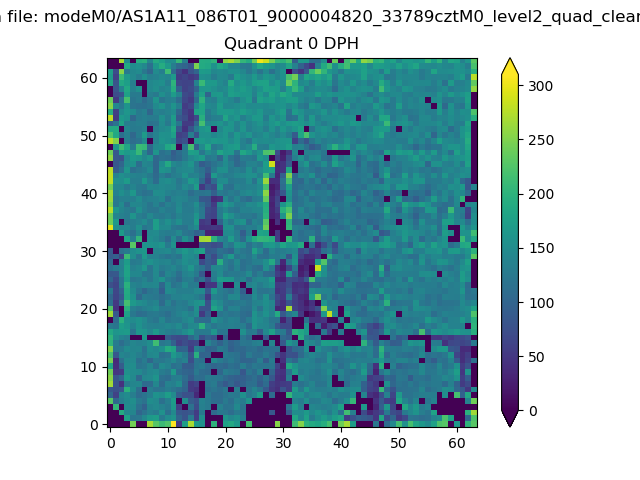 |
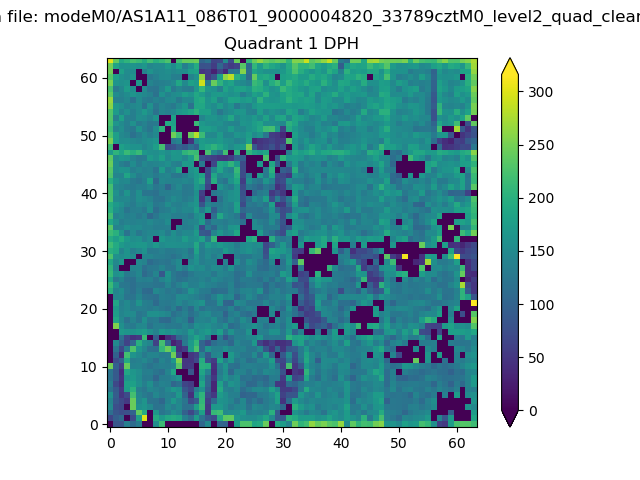 |
Quadrant B |
|---|---|---|---|
| Quadrant D | 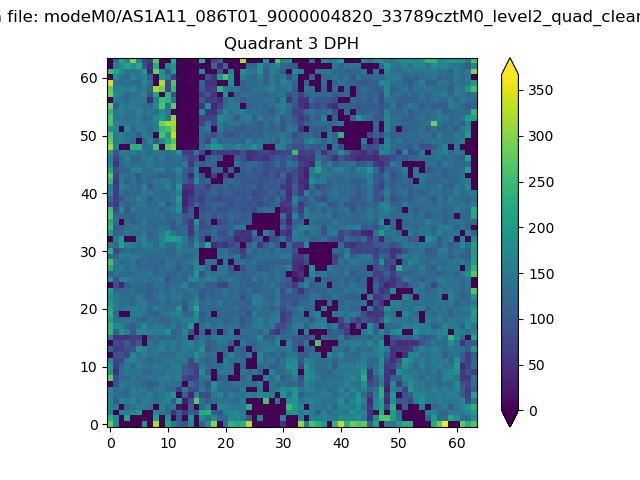 |
 |
Quadrant C |
| Plot type | Count rate plots | Images |
|---|---|---|
| Comparison with Poisson distribution Blue bars denote a histogram of data divided into 1 sec bins. Red curve is a Poisson curve with rate = median count rate of data. |
 |
 |
| Quadrant-wise count rates Data is divided into 100 sec bins |
 |
|
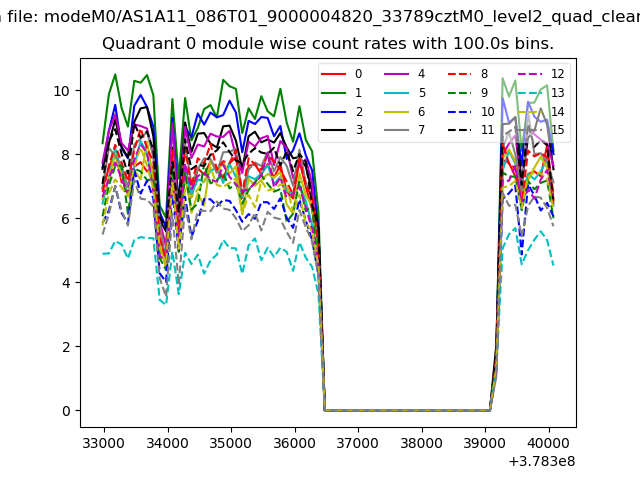
| Module-wise count rates for Quadrant A Data is divided into 100 sec bins |
 |
 |
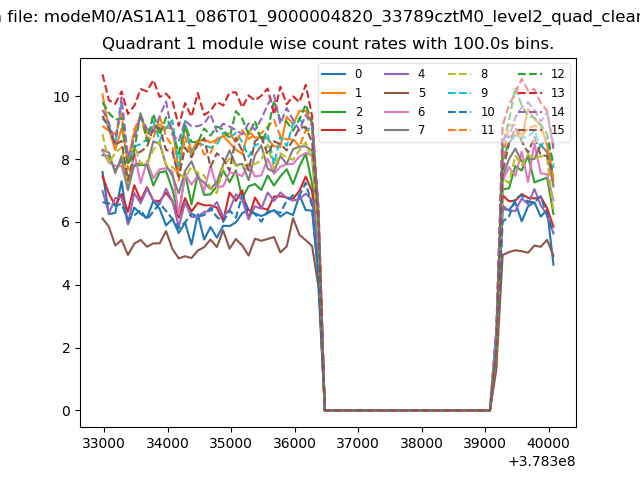
| Module-wise count rates for Quadrant B Data is divided into 100 sec bins |
 |
 |
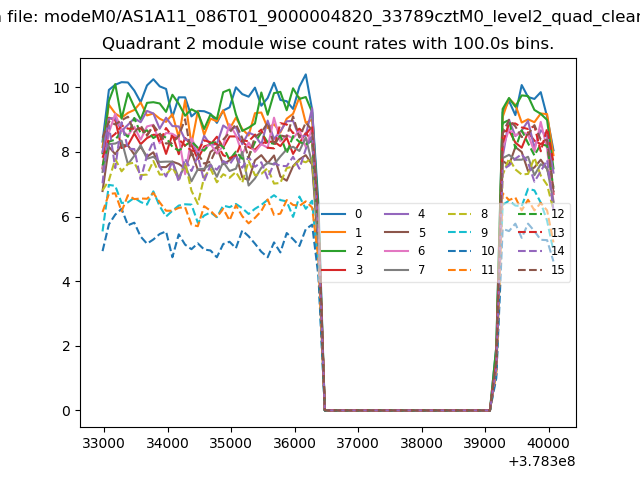
| Module-wise count rates for Quadrant C Data is divided into 100 sec bins |
 |
 |
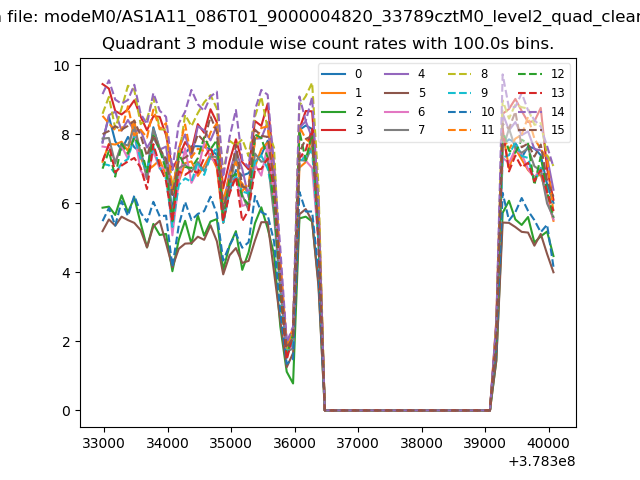
| Module-wise count rates for Quadrant D Data is divided into 100 sec bins |
 |
 |
| Parameter | Plot |
|---|---|
| CZT HV Monitor | 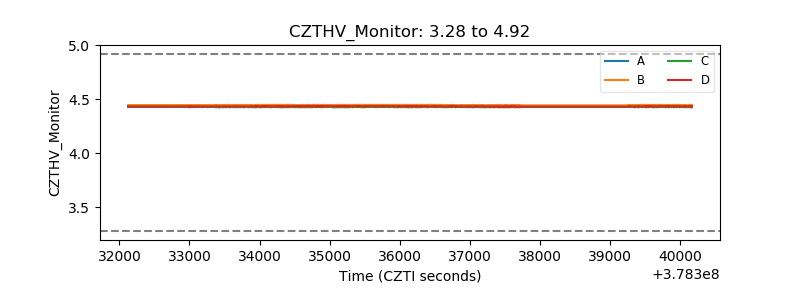 |
| D_VDD | 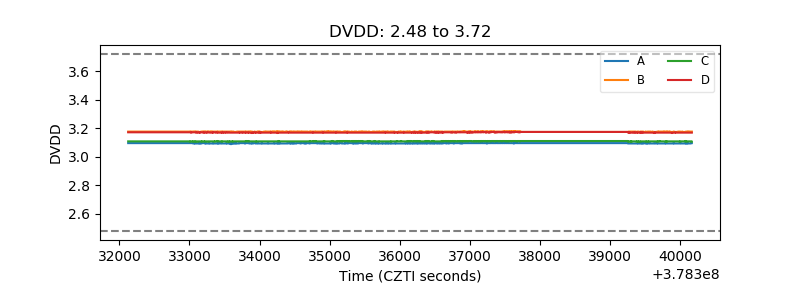 |
| Temperature 1 | 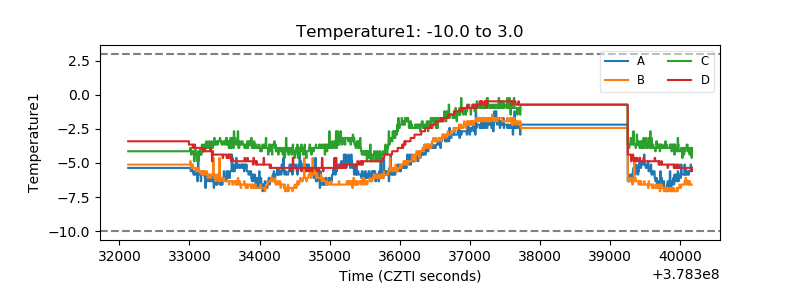 |
| Veto HV Monitor | 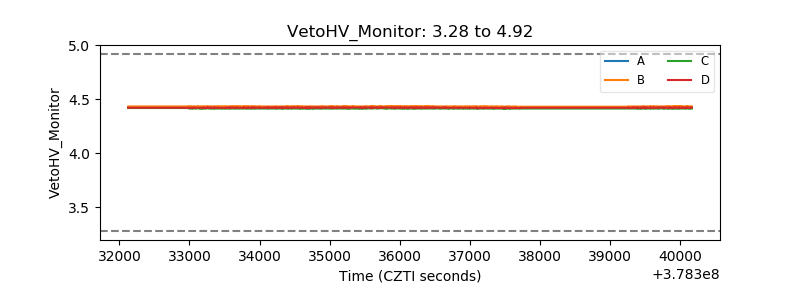 |
| Veto LLD | 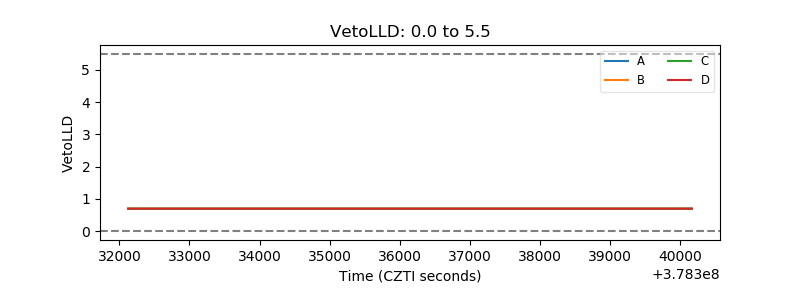 |
| Alpha Counter | 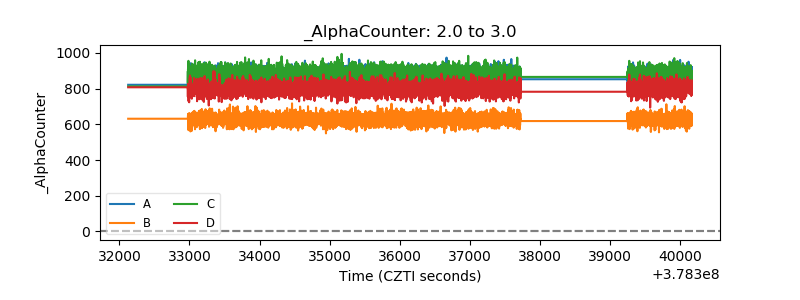 |
| _CPM_Rate |  |
| CZT Counter | 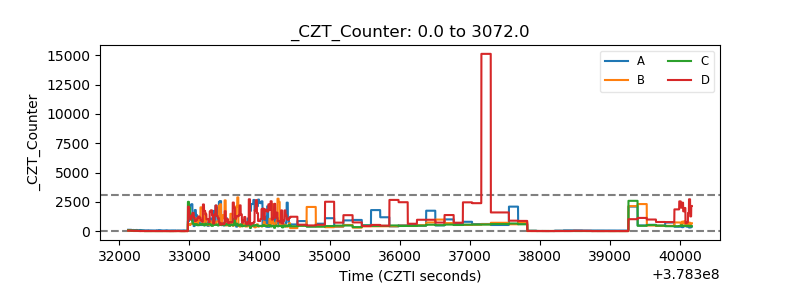 |
| +2.5 Volts monitor |  |
| +5 Volts monitor |  |
| _ROLL_ROT | 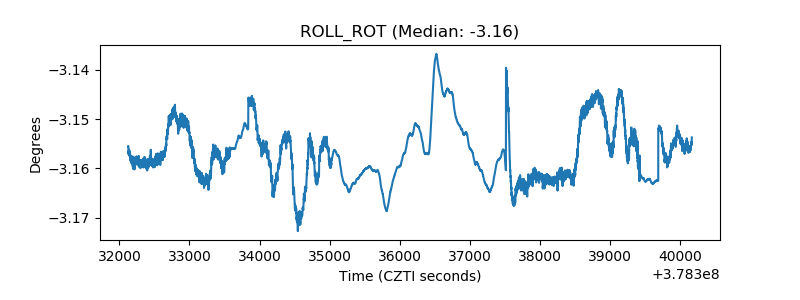 |
| _Roll_DEC | 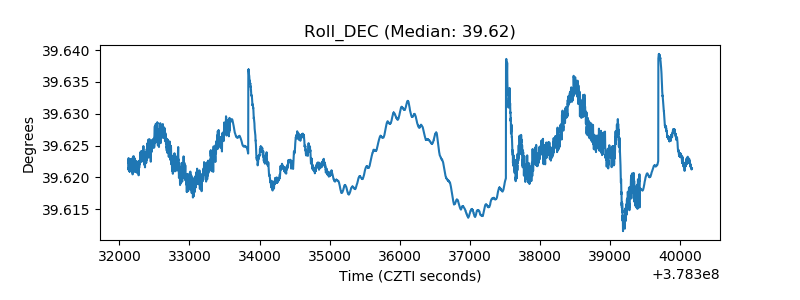 |
| _Roll_RA | 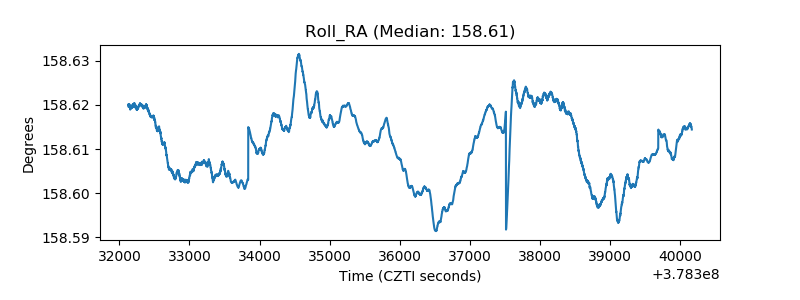 |
| Veto Counter | 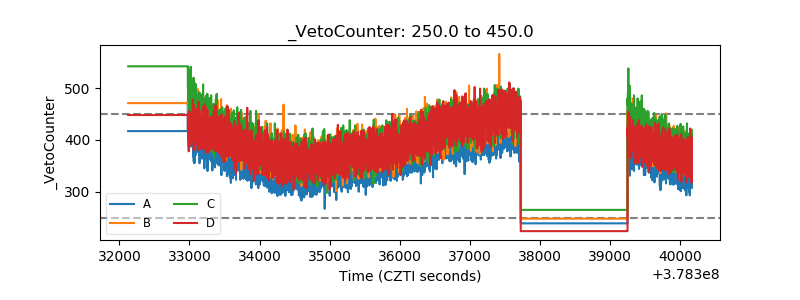 |