| Param | Original file | Final file |
|---|---|---|
| Filename | modeM0/AS1A11_086T01_9000004820_33790cztM0_level2.evt | modeM0/AS1A11_086T01_9000004820_33790cztM0_level2_quad_clean.evt |
| Size (bytes) | 377,856,000 | 54,843,840 |
| Size | 360.4 MB | 52.3 MB |
| Events in quadrant A | 2,316,041 | 362,628 |
| Events in quadrant B | 3,536,924 | 337,432 |
| Events in quadrant C | 1,803,945 | 376,293 |
| Events in quadrant D | 3,550,917 | 338,556 |
| Mode M9 | |||
|---|---|---|---|
| Quadrant | BADHDUFLAG | Total packets | Discarded packets |
| A | 0 | 29 | 12 |
| B | 0 | 27 | 10 |
| C | 0 | 29 | 10 |
| D | 0 | 29 | 10 |
| Mode SS | |||
|---|---|---|---|
| Quadrant | BADHDUFLAG | Total packets | Discarded packets |
| A | 0 | 121 | 49 |
| B | 0 | 120 | 52 |
| C | 0 | 120 | 48 |
| D | 0 | 119 | 49 |
| Mode M0 | |||
|---|---|---|---|
| Quadrant | BADHDUFLAG | Total packets | Discarded packets |
| A | 0 | 18111 | 8713 |
| B | 0 | 20588 | 7778 |
| C | 0 | 13582 | 5961 |
| D | 0 | 23601 | 10695 |
| Quadrant | Total seconds | Saturated seconds | Saturation percentage |
|---|---|---|---|
| A | 3488 | 215 | 6.163991% |
| B | 3436 | 616 | 17.927823% |
| C | 3574 | 30 | 0.839396% |
| D | 3352 | 226 | 6.742243% |
Noise dominated data is calculated using 1-second bins in cleaned event files. If a bin has >2000 counts, and if more than 50% of those come from <1% of pixels, then it is considered to be noise-dominated and hence unusable.
| Quadrant | # 1 sec bins | Bins with >0 counts | Bins with >2000 counts | High rate bins dominated by noise | Noise dominated (total time) | Noise dominated (detector-on time) | Marked lightcurve |
|---|---|---|---|---|---|---|---|
| A | 8859 | 3679 | 174 | 174 | 1.96% | 4.73% | 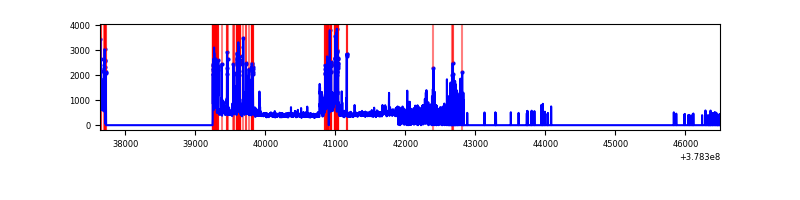 |
| B | 8859 | 3690 | 562 | 562 | 6.34% | 15.23% | 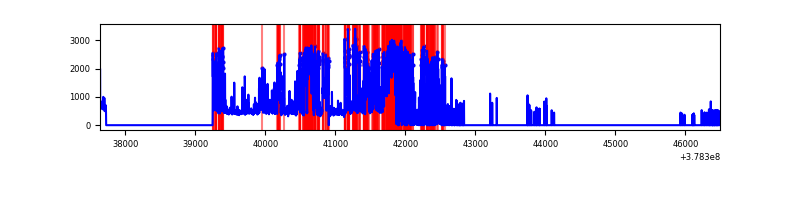 |
| C | 8852 | 3785 | 24 | 24 | 0.27% | 0.63% | 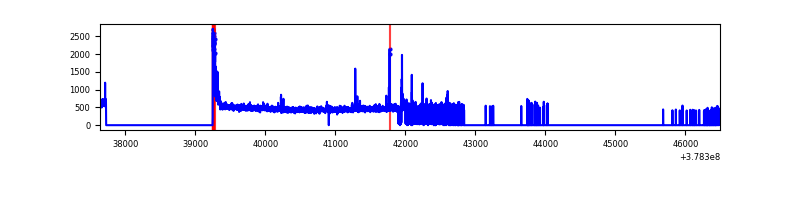 |
| D | 8855 | 3542 | 254 | 254 | 2.87% | 7.17% | 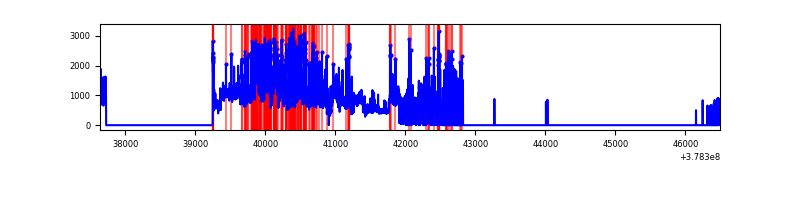 |
Top three noisy pixels from each quadrant. If the there are fewer than three noisy pixels in the level2.evt file, extra rows are filled as -1
| Pixel properties | Quadrant properties | ||||||
|---|---|---|---|---|---|---|---|
| Quadrant | DetID | PixID | Counts | Sigma | Mean | Median | Sigma |
| A | 15 | 237 | 658072 | 8739.22 | 369 | 363 | 75.3 |
| A | 15 | 169 | 206169 | 2734.61 | 369 | 363 | 75.3 |
| A | 7 | 16 | 12217 | 157.5 | 369 | 363 | 75.3 |
| B | 0 | 197 | 1450712 | 21186.95 | 352 | 342 | 68.5 |
| B | 5 | 255 | 347344 | 5068.99 | 352 | 342 | 68.5 |
| B | 5 | 172 | 274112 | 3999.22 | 352 | 342 | 68.5 |
| C | 15 | 214 | 152984 | 1723.57 | 380 | 383 | 88.5 |
| C | 0 | 10 | 86002 | 967.03 | 380 | 383 | 88.5 |
| C | 3 | 233 | 36508 | 408.02 | 380 | 383 | 88.5 |
| D | 12 | 235 | 944581 | 11058.56 | 345 | 335 | 85.4 |
| D | 8 | 195 | 804493 | 9417.91 | 345 | 335 | 85.4 |
| D | 2 | 250 | 196737 | 2300.17 | 345 | 335 | 85.4 |
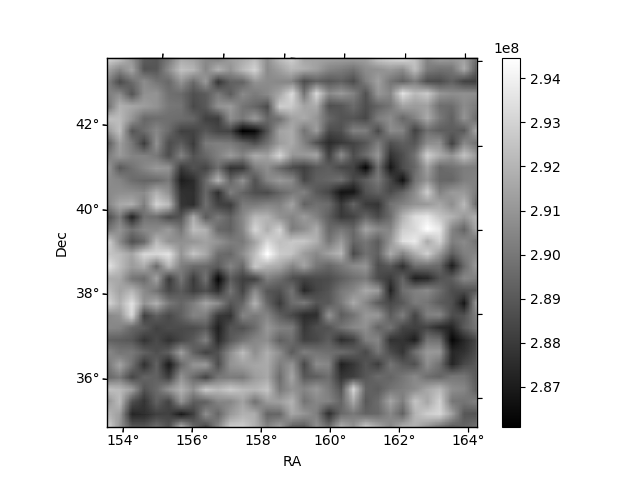
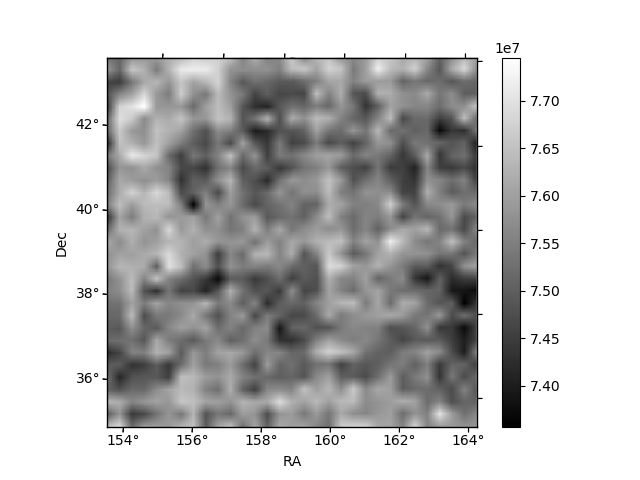
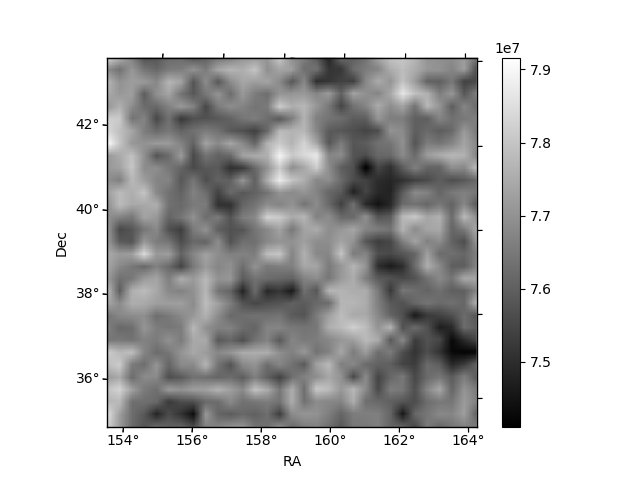
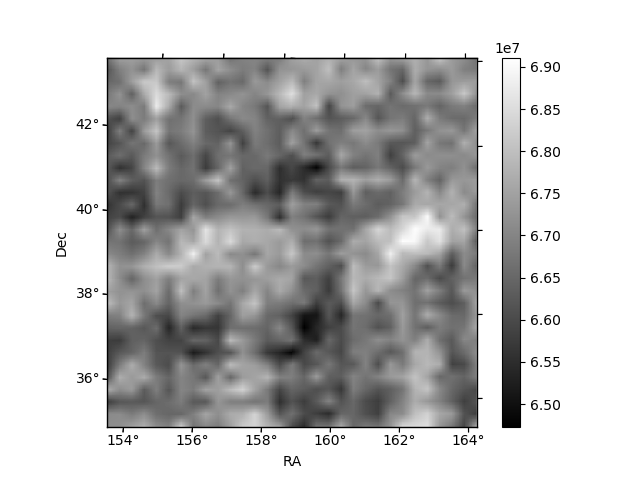
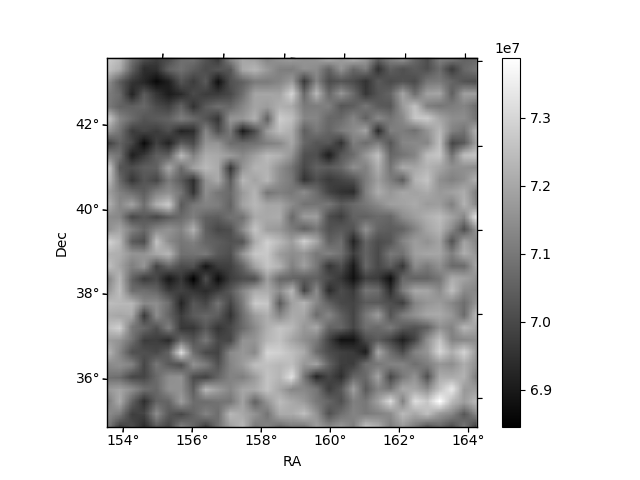
Histogram calculated using DETX and DETY for each event in the final _common_clean file
| Quadrant A | 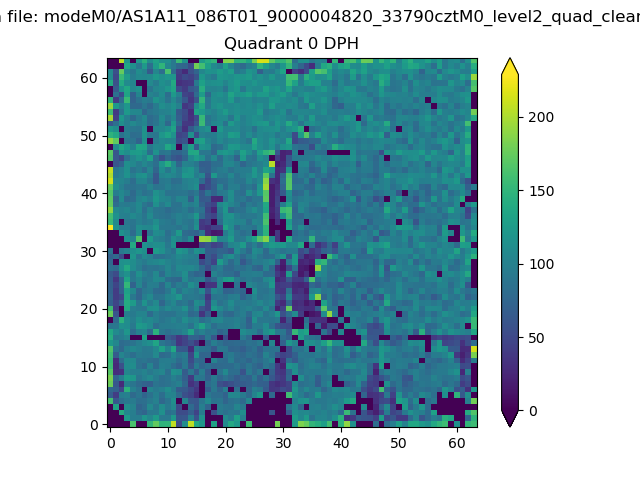 |
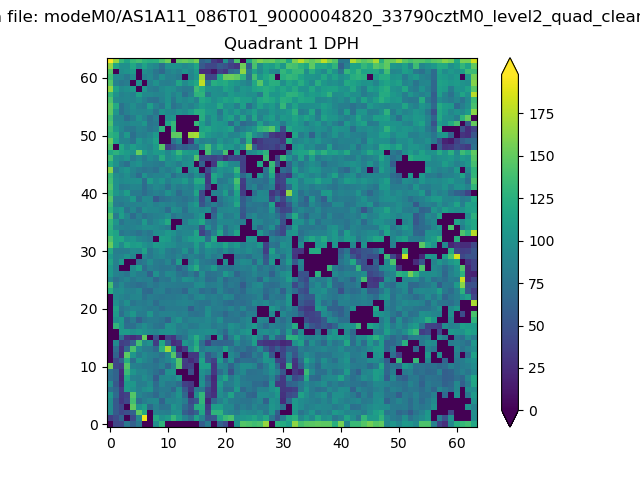 |
Quadrant B |
|---|---|---|---|
| Quadrant D | 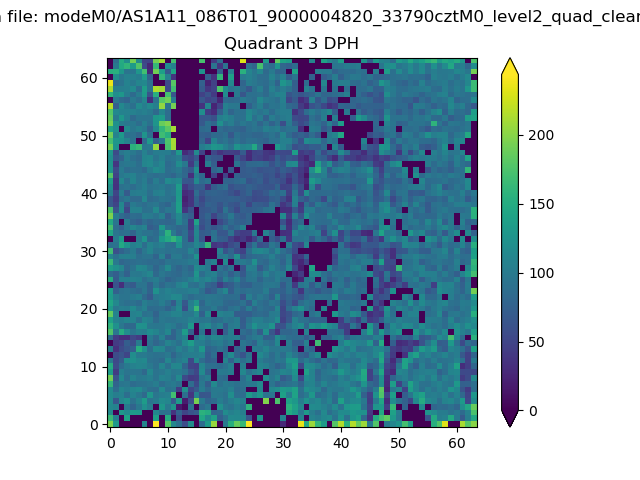 |
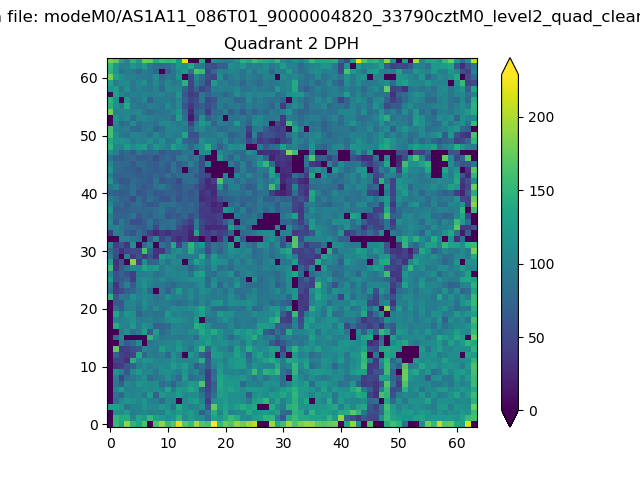 |
Quadrant C |
| Plot type | Count rate plots | Images |
|---|---|---|
| Comparison with Poisson distribution Blue bars denote a histogram of data divided into 1 sec bins. Red curve is a Poisson curve with rate = median count rate of data. |
 |
 |
| Quadrant-wise count rates Data is divided into 100 sec bins |
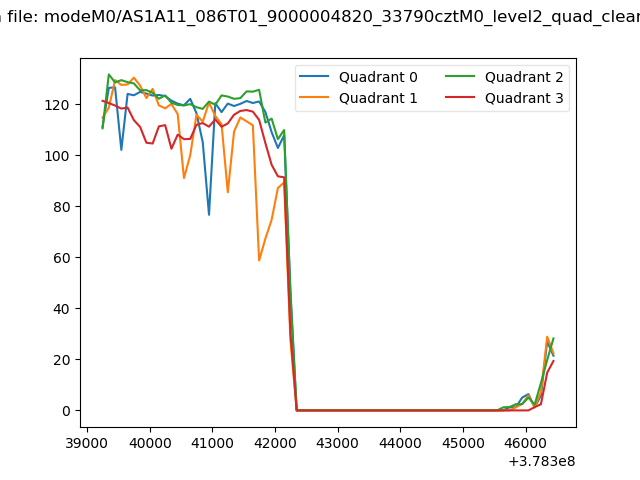 |
|
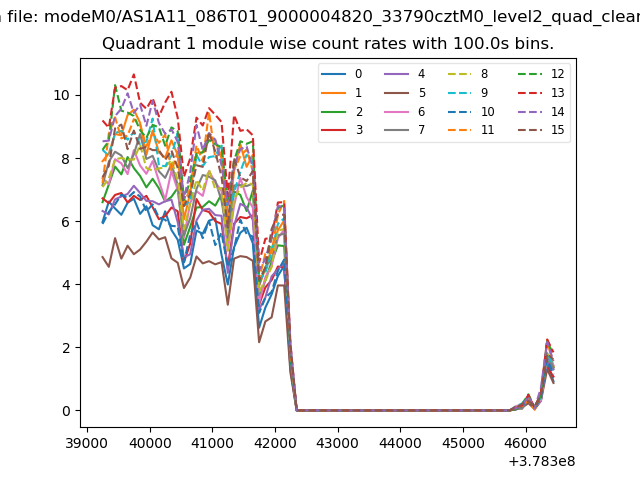
| Module-wise count rates for Quadrant A Data is divided into 100 sec bins |
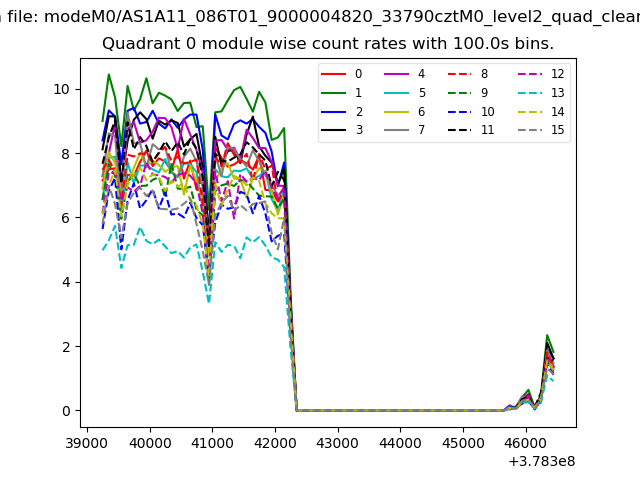 |
 |
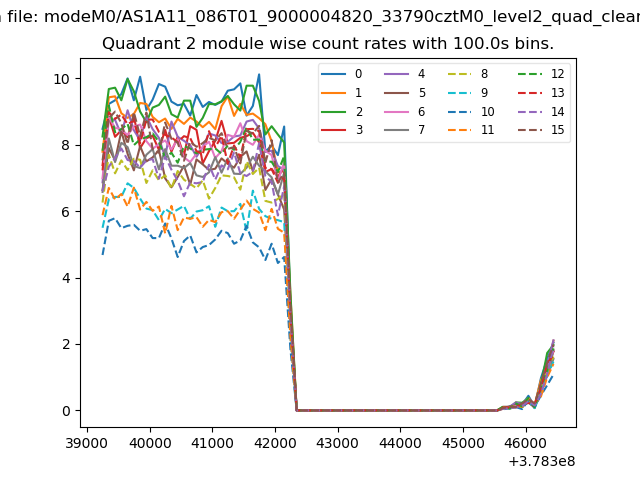
| Module-wise count rates for Quadrant B Data is divided into 100 sec bins |
 |
 |
| Module-wise count rates for Quadrant C Data is divided into 100 sec bins |
 |
 |
| Module-wise count rates for Quadrant D Data is divided into 100 sec bins |
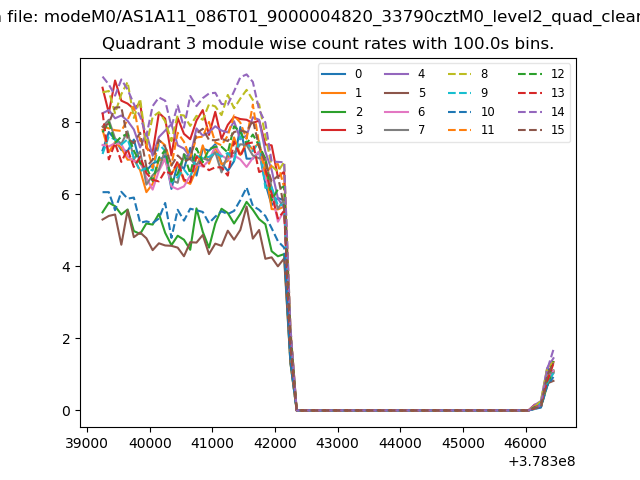 |
 |
| Parameter | Plot |
|---|---|
| CZT HV Monitor | 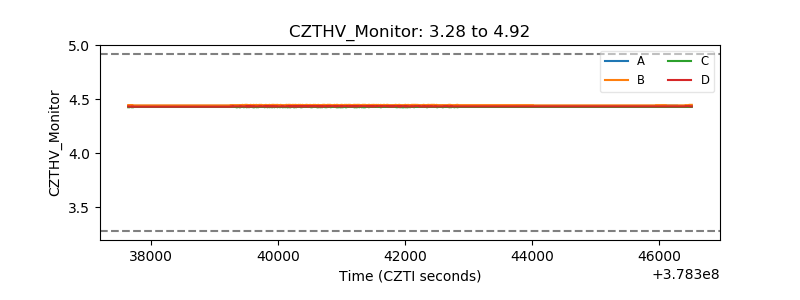 |
| D_VDD | 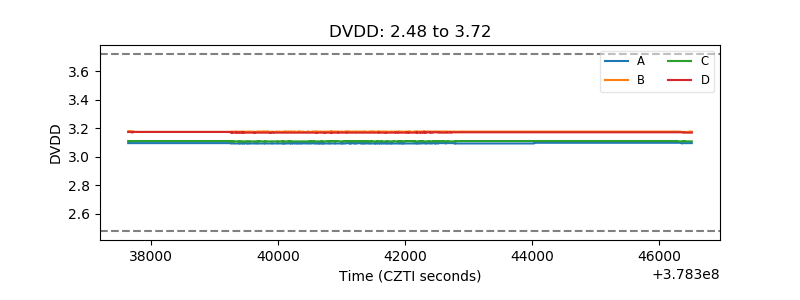 |
| Temperature 1 | 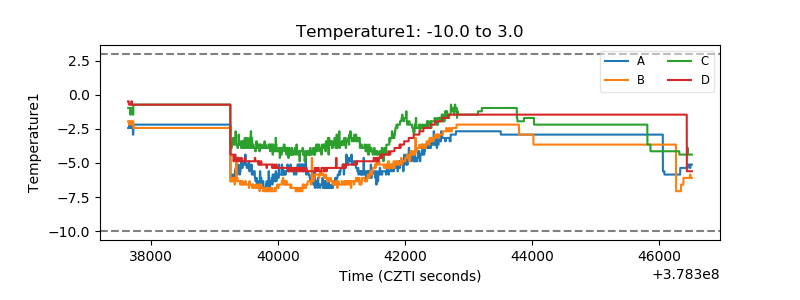 |
| Veto HV Monitor |  |
| Veto LLD | 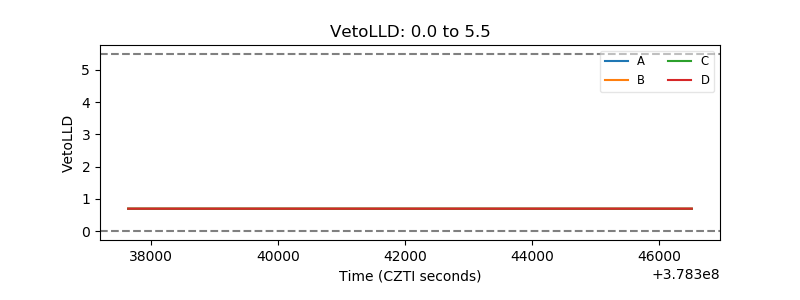 |
| Alpha Counter | 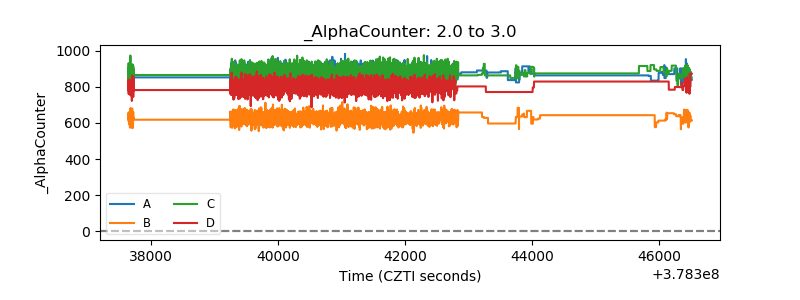 |
| _CPM_Rate | 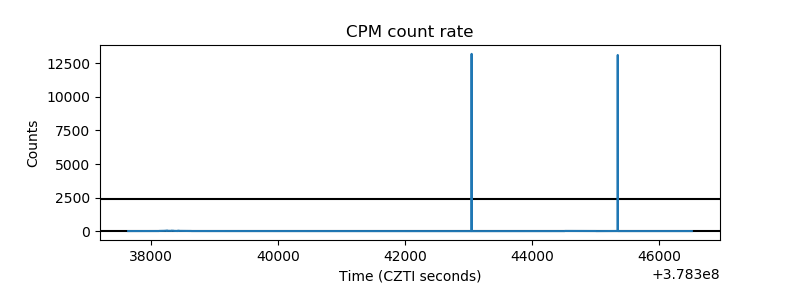 |
| CZT Counter | 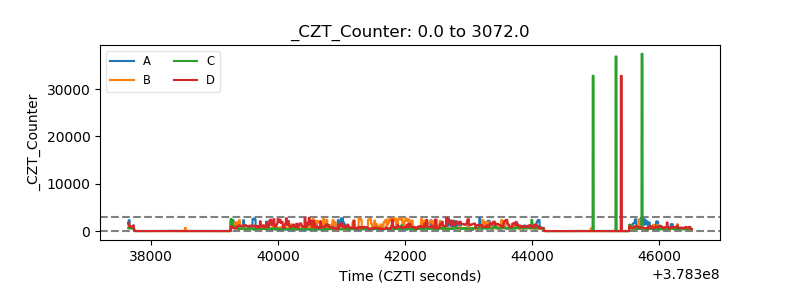 |
| +2.5 Volts monitor | 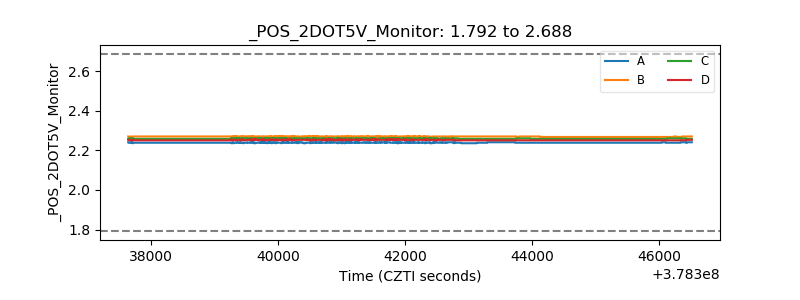 |
| +5 Volts monitor |  |
| _ROLL_ROT | 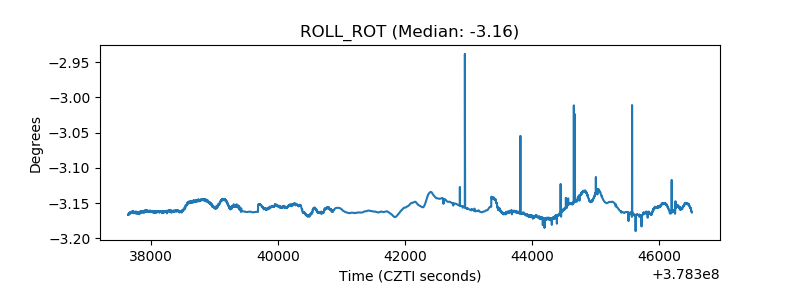 |
| _Roll_DEC | 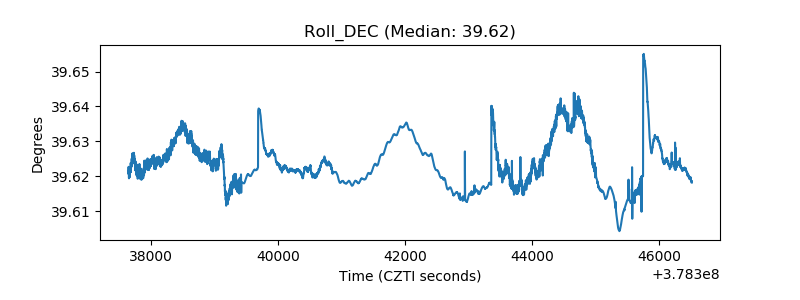 |
| _Roll_RA | 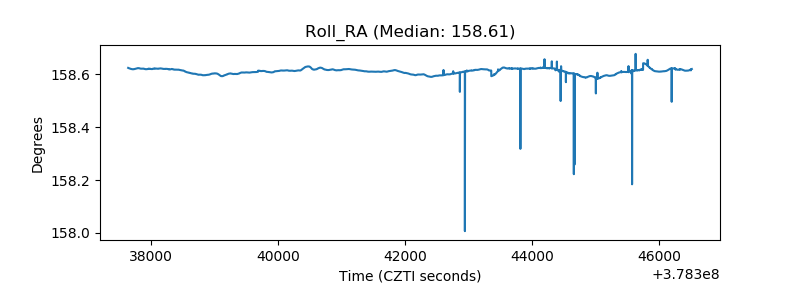 |
| Veto Counter | 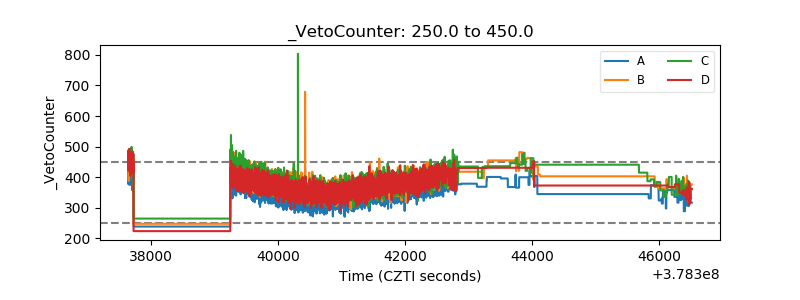 |