| Param | Original file | Final file |
|---|---|---|
| Filename | modeM0/AS1A11_086T01_9000004820_33793cztM0_level2.evt | modeM0/AS1A11_086T01_9000004820_33793cztM0_level2_quad_clean.evt |
| Size (bytes) | 1,298,145,600 | 128,085,120 |
| Size | 1.2 GB | 122.2 MB |
| Events in quadrant A | 8,622,708 | 802,745 |
| Events in quadrant B | 6,562,027 | 825,339 |
| Events in quadrant C | 6,047,329 | 831,128 |
| Events in quadrant D | 17,355,422 | 670,532 |
| Mode M9 | |||
|---|---|---|---|
| Quadrant | BADHDUFLAG | Total packets | Discarded packets |
| A | 0 | 35 | 0 |
| B | 0 | 35 | 0 |
| C | 0 | 35 | 0 |
| D | 0 | 36 | 0 |
| Mode SS | |||
|---|---|---|---|
| Quadrant | BADHDUFLAG | Total packets | Discarded packets |
| A | 0 | 218 | 0 |
| B | 0 | 218 | 0 |
| C | 0 | 218 | 0 |
| D | 0 | 218 | 0 |
| Mode M0 | |||
|---|---|---|---|
| Quadrant | BADHDUFLAG | Total packets | Discarded packets |
| A | 0 | 32787 | 4 |
| B | 0 | 26537 | 3 |
| C | 0 | 24668 | 3 |
| D | 0 | 58962 | 3 |
| Quadrant | Total seconds | Saturated seconds | Saturation percentage |
|---|---|---|---|
| A | 10809 | 1154 | 10.676288% |
| B | 10809 | 353 | 3.265797% |
| C | 10809 | 95 | 0.878897% |
| D | 10809 | 4490 | 41.539458% |
Noise dominated data is calculated using 1-second bins in cleaned event files. If a bin has >2000 counts, and if more than 50% of those come from <1% of pixels, then it is considered to be noise-dominated and hence unusable.
| Quadrant | # 1 sec bins | Bins with >0 counts | Bins with >2000 counts | High rate bins dominated by noise | Noise dominated (total time) | Noise dominated (detector-on time) | Marked lightcurve |
|---|---|---|---|---|---|---|---|
| A | 13587 | 10811 | 849 | 849 | 6.25% | 7.85% | 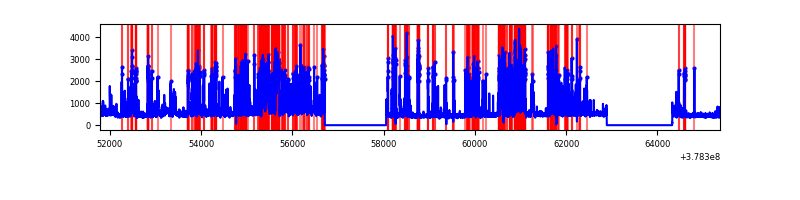 |
| B | 13587 | 10811 | 225 | 225 | 1.66% | 2.08% | 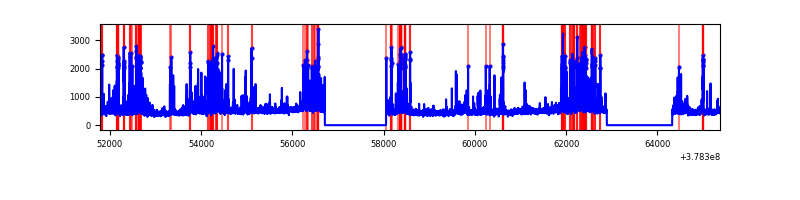 |
| C | 13587 | 10811 | 79 | 79 | 0.58% | 0.73% | 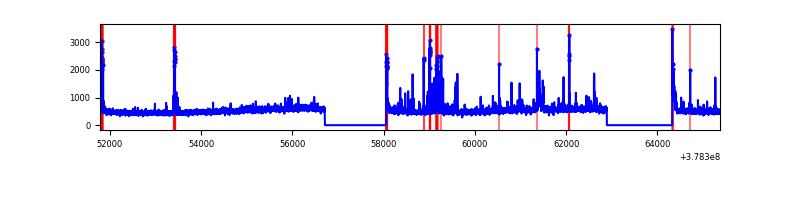 |
| D | 13587 | 10811 | 4400 | 4400 | 32.38% | 40.70% | 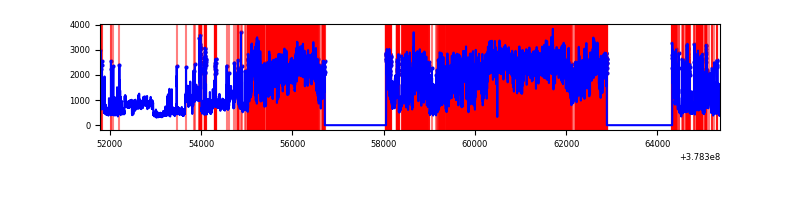 |
Top three noisy pixels from each quadrant. If the there are fewer than three noisy pixels in the level2.evt file, extra rows are filled as -1
| Pixel properties | Quadrant properties | ||||||
|---|---|---|---|---|---|---|---|
| Quadrant | DetID | PixID | Counts | Sigma | Mean | Median | Sigma |
| A | 15 | 237 | 3654450 | 15409.07 | 1192 | 1168 | 237.1 |
| A | 15 | 169 | 291044 | 1222.66 | 1192 | 1168 | 237.1 |
| A | 7 | 16 | 34309 | 139.78 | 1192 | 1168 | 237.1 |
| B | 5 | 172 | 1009543 | 4243.31 | 1243 | 1210 | 237.6 |
| B | 5 | 255 | 191915 | 802.53 | 1243 | 1210 | 237.6 |
| B | 4 | 251 | 175850 | 734.93 | 1243 | 1210 | 237.6 |
| C | 15 | 214 | 491396 | 1742.46 | 1224 | 1234 | 281.3 |
| C | 3 | 233 | 196997 | 695.91 | 1224 | 1234 | 281.3 |
| C | 14 | 254 | 196254 | 693.27 | 1224 | 1234 | 281.3 |
| D | 12 | 235 | 8958211 | 36147.7 | 1004 | 973 | 247.8 |
| D | 8 | 195 | 1707555 | 6887.06 | 1004 | 973 | 247.8 |
| D | 10 | 118 | 835014 | 3365.84 | 1004 | 973 | 247.8 |
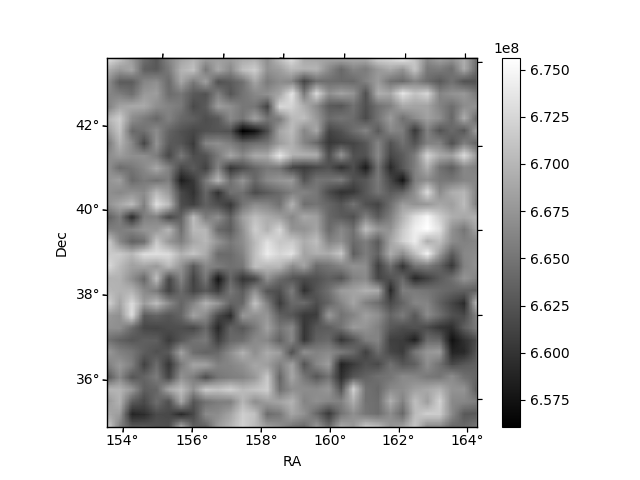
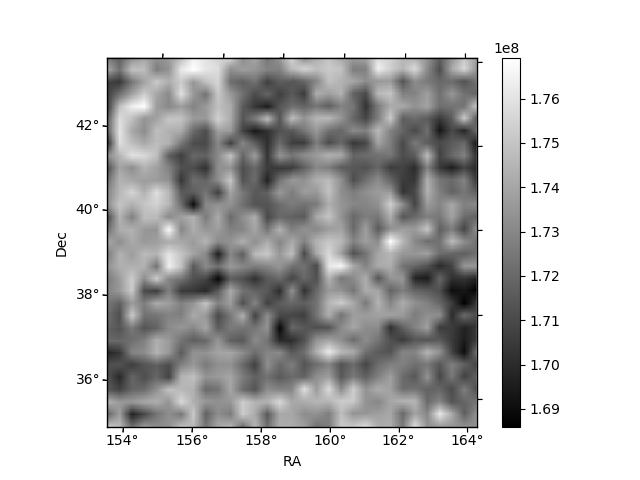
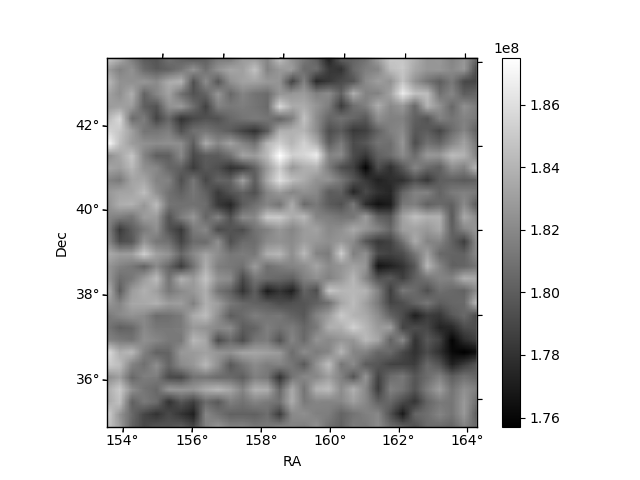
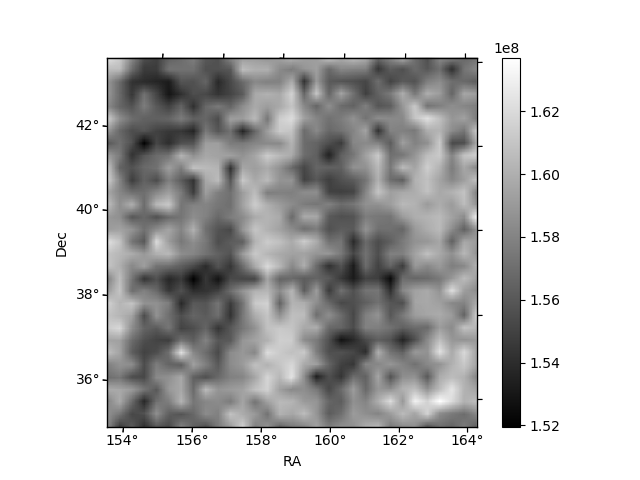
Histogram calculated using DETX and DETY for each event in the final _common_clean file
| Quadrant A | 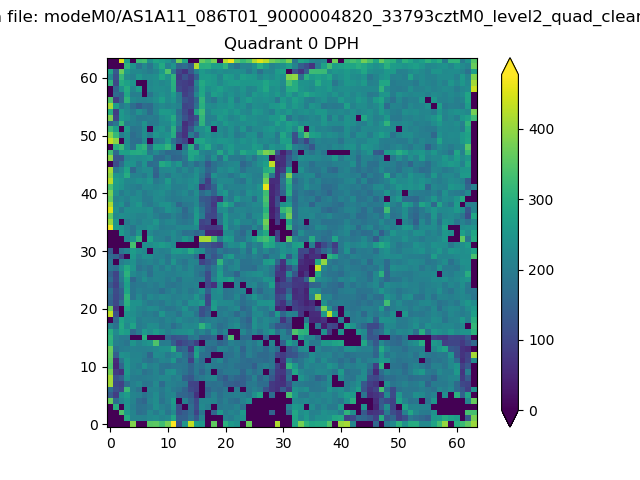 |
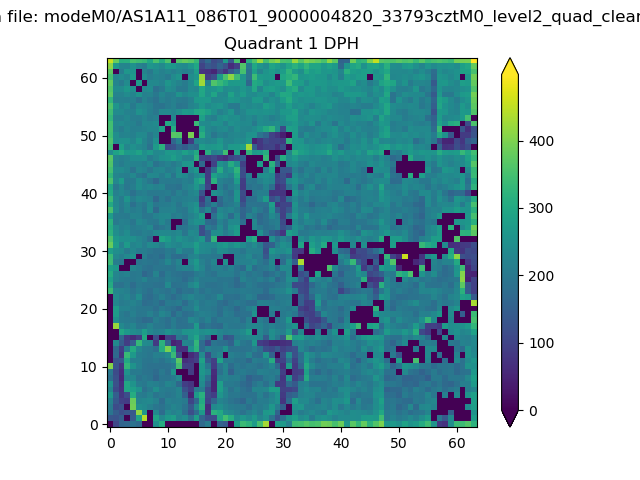 |
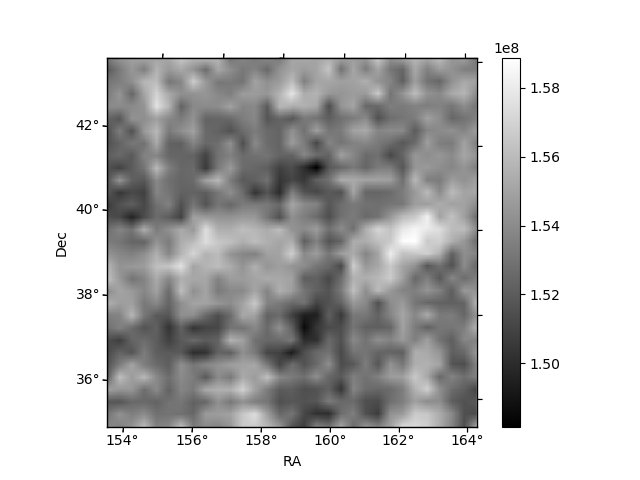
Quadrant B |
|---|---|---|---|
| Quadrant D | 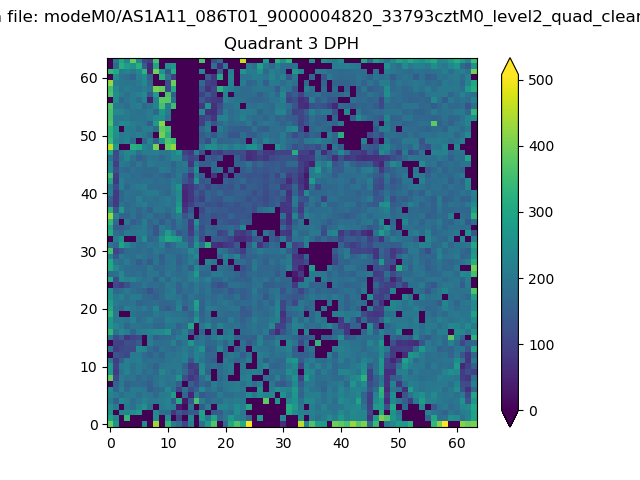 |
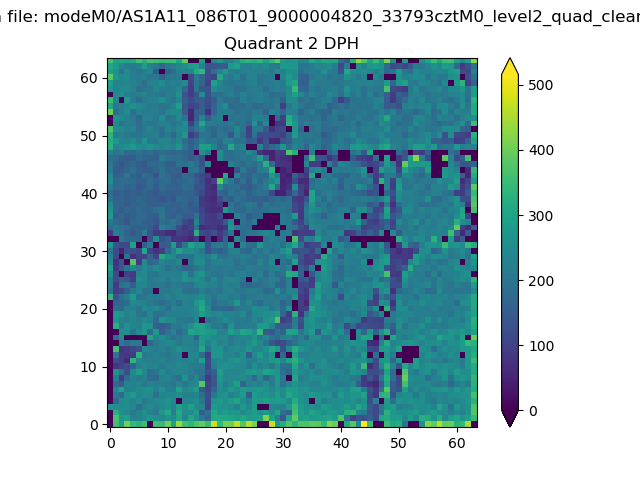 |
Quadrant C |
| Plot type | Count rate plots | Images |
|---|---|---|
| Comparison with Poisson distribution Blue bars denote a histogram of data divided into 1 sec bins. Red curve is a Poisson curve with rate = median count rate of data. |
 |
 |
| Quadrant-wise count rates Data is divided into 100 sec bins |
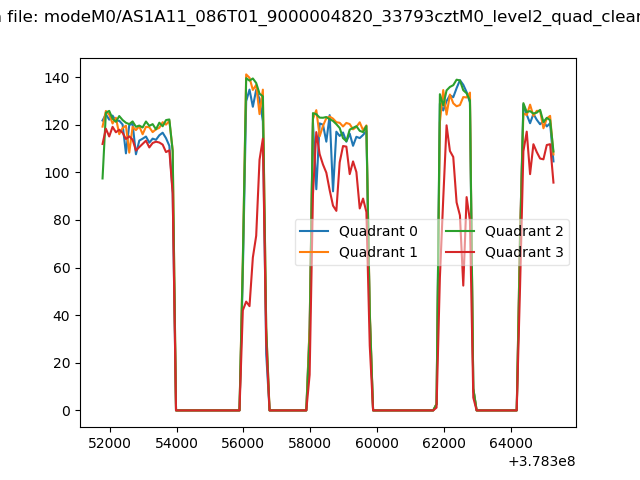 |
|
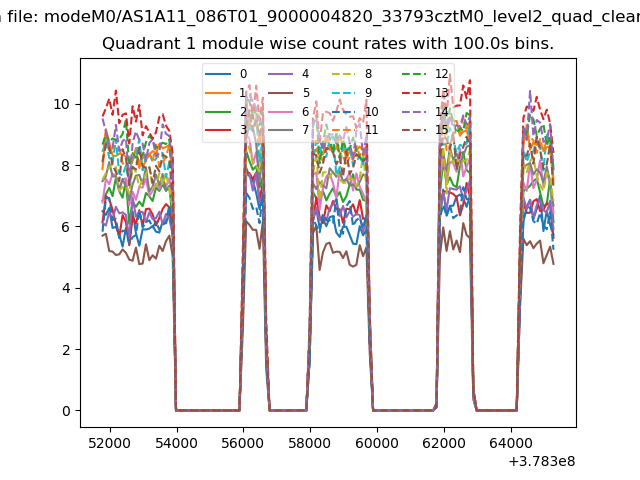
| Module-wise count rates for Quadrant A Data is divided into 100 sec bins |
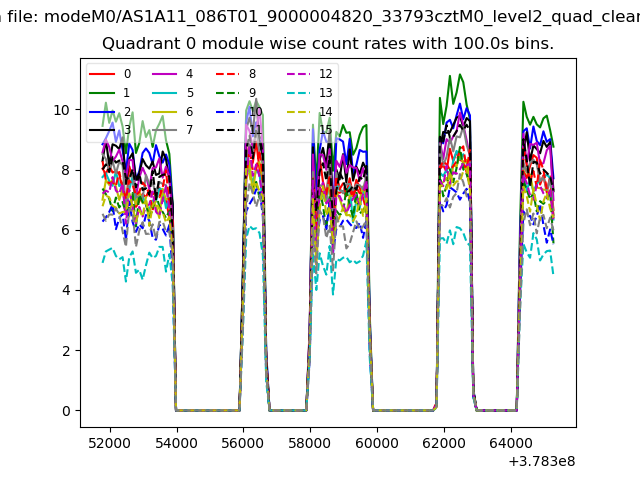 |
 |
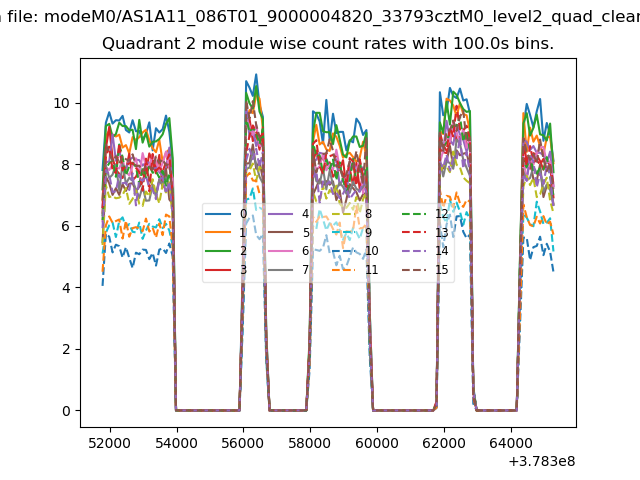
| Module-wise count rates for Quadrant B Data is divided into 100 sec bins |
 |
 |
| Module-wise count rates for Quadrant C Data is divided into 100 sec bins |
 |
 |
| Module-wise count rates for Quadrant D Data is divided into 100 sec bins |
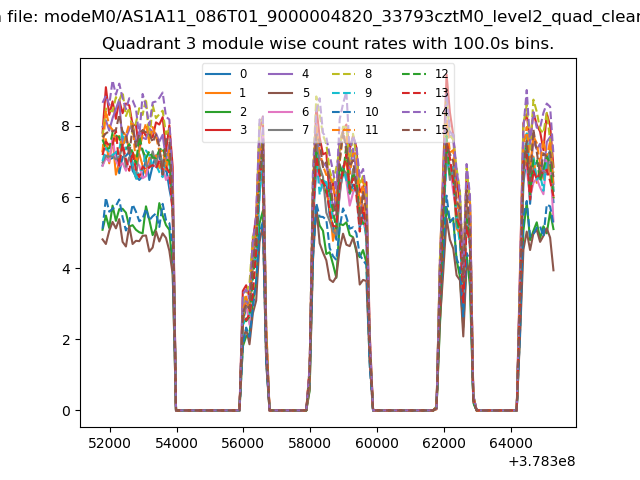 |
 |
| Parameter | Plot |
|---|---|
| CZT HV Monitor | 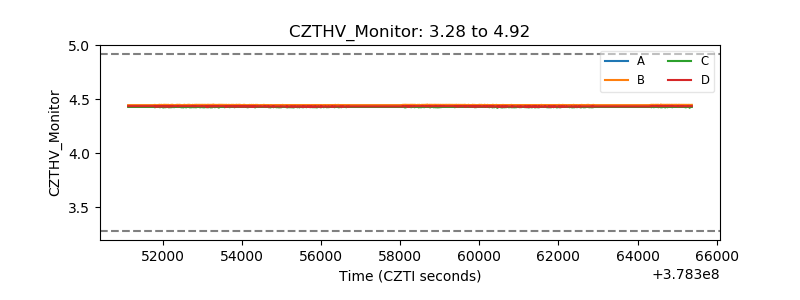 |
| D_VDD | 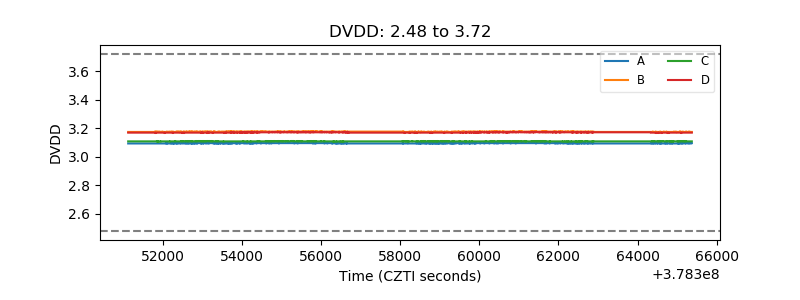 |
| Temperature 1 | 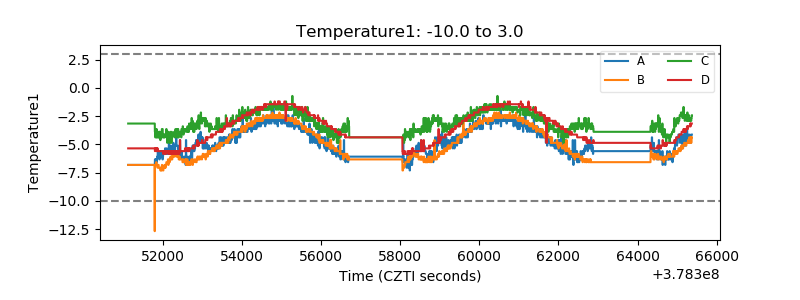 |
| Veto HV Monitor |  |
| Veto LLD |  |
| Alpha Counter | 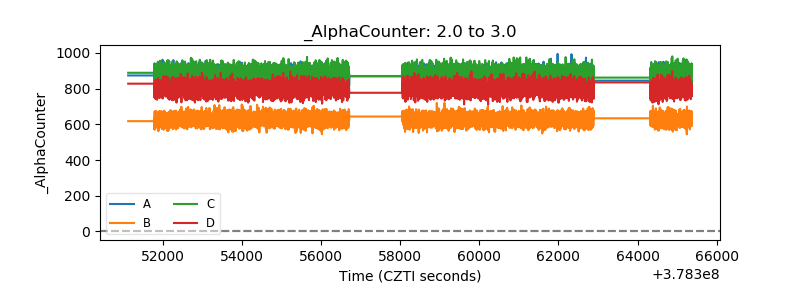 |
| _CPM_Rate | 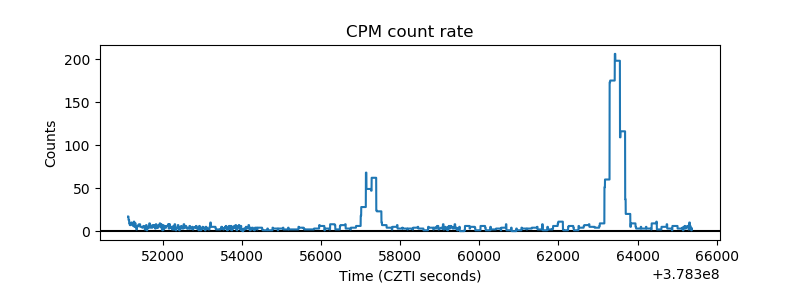 |
| CZT Counter | 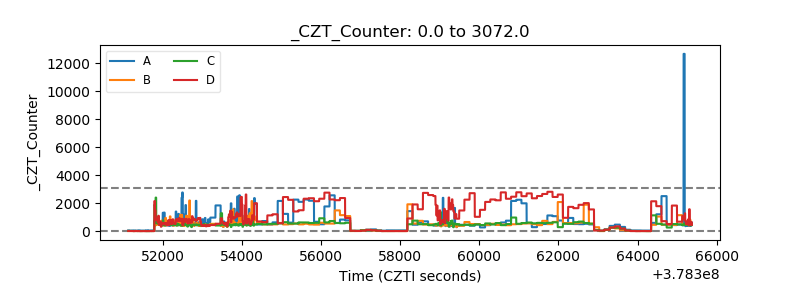 |
| +2.5 Volts monitor |  |
| +5 Volts monitor |  |
| _ROLL_ROT |  |
| _Roll_DEC |  |
| _Roll_RA | 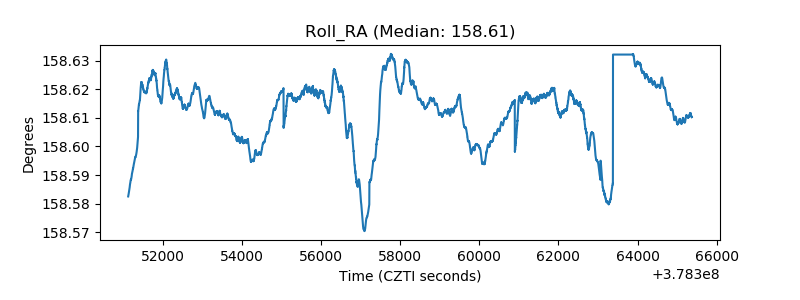 |
| Veto Counter |  |