| Param | Original file | Final file |
|---|---|---|
| Filename | modeM0/AS1A11_086T01_9000004820_33794cztM0_level2.evt | modeM0/AS1A11_086T01_9000004820_33794cztM0_level2_quad_clean.evt |
| Size (bytes) | 2,943,743,040 | 287,827,200 |
| Size | 2.7 GB | 274.5 MB |
| Events in quadrant A | 20,041,797 | 1,784,099 |
| Events in quadrant B | 17,136,937 | 1,819,213 |
| Events in quadrant C | 13,844,803 | 1,860,591 |
| Events in quadrant D | 36,447,637 | 1,527,929 |
| Mode M9 | |||
|---|---|---|---|
| Quadrant | BADHDUFLAG | Total packets | Discarded packets |
| A | 0 | 70 | 0 |
| B | 0 | 70 | 0 |
| C | 0 | 70 | 0 |
| D | 0 | 70 | 0 |
| Mode SS | |||
|---|---|---|---|
| Quadrant | BADHDUFLAG | Total packets | Discarded packets |
| A | 0 | 510 | 0 |
| B | 0 | 510 | 0 |
| C | 0 | 510 | 0 |
| D | 0 | 510 | 0 |
| Mode M0 | |||
|---|---|---|---|
| Quadrant | BADHDUFLAG | Total packets | Discarded packets |
| A | 0 | 76528 | 7 |
| B | 0 | 67202 | 5 |
| C | 0 | 56646 | 5 |
| D | 0 | 125523 | 5 |
| Quadrant | Total seconds | Saturated seconds | Saturation percentage |
|---|---|---|---|
| A | 25052 | 2643 | 10.550056% |
| B | 25052 | 1427 | 5.696152% |
| C | 25052 | 174 | 0.694555% |
| D | 25052 | 7837 | 31.282932% |
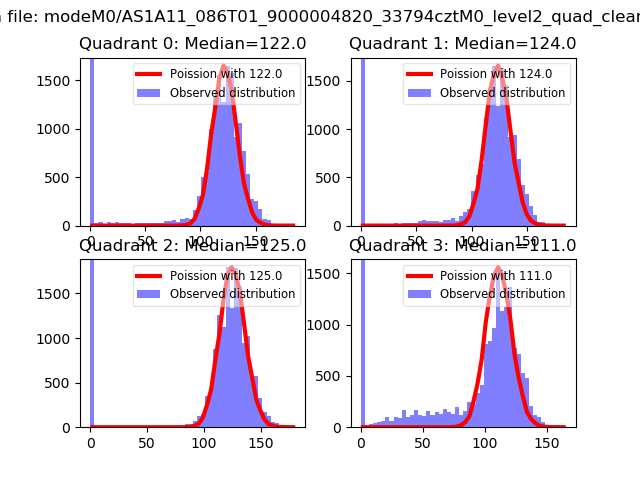
Noise dominated data is calculated using 1-second bins in cleaned event files. If a bin has >2000 counts, and if more than 50% of those come from <1% of pixels, then it is considered to be noise-dominated and hence unusable.
| Quadrant | # 1 sec bins | Bins with >0 counts | Bins with >2000 counts | High rate bins dominated by noise | Noise dominated (total time) | Noise dominated (detector-on time) | Marked lightcurve |
|---|---|---|---|---|---|---|---|
| A | 32011 | 25058 | 1883 | 1883 | 5.88% | 7.51% | 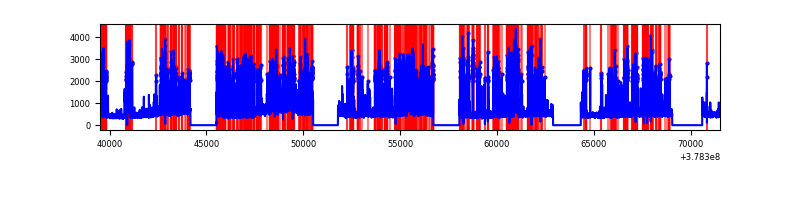 |
| B | 32011 | 25058 | 1089 | 1089 | 3.40% | 4.35% | 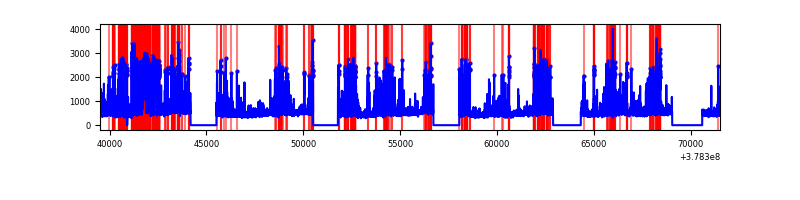 |
| C | 32011 | 25058 | 143 | 143 | 0.45% | 0.57% | 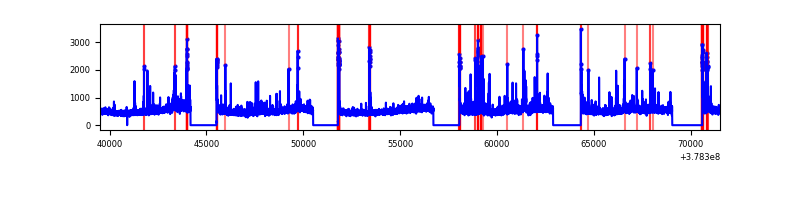 |
| D | 32011 | 25058 | 7659 | 7659 | 23.93% | 30.57% | 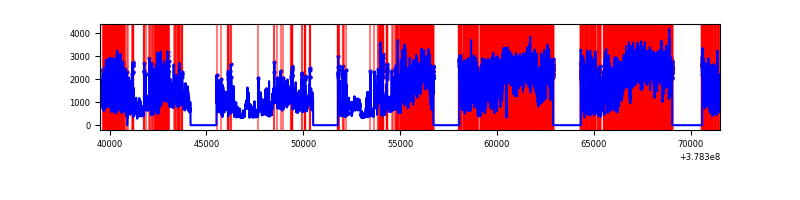 |
Top three noisy pixels from each quadrant. If the there are fewer than three noisy pixels in the level2.evt file, extra rows are filled as -1
| Pixel properties | Quadrant properties | ||||||
|---|---|---|---|---|---|---|---|
| Quadrant | DetID | PixID | Counts | Sigma | Mean | Median | Sigma |
| A | 15 | 237 | 7604504 | 13738.08 | 2784 | 2728 | 553.3 |
| A | 15 | 169 | 1571383 | 2834.9 | 2784 | 2728 | 553.3 |
| A | 13 | 6 | 54673 | 93.88 | 2784 | 2728 | 553.3 |
| B | 5 | 172 | 2295570 | 4226.48 | 2862 | 2780 | 542.5 |
| B | 0 | 197 | 1881596 | 3463.37 | 2862 | 2780 | 542.5 |
| B | 5 | 255 | 817821 | 1502.43 | 2862 | 2780 | 542.5 |
| C | 15 | 214 | 1114162 | 1715.88 | 2846 | 2870 | 647.7 |
| C | 14 | 254 | 490131 | 752.35 | 2846 | 2870 | 647.7 |
| C | 3 | 233 | 442681 | 679.08 | 2846 | 2870 | 647.7 |
| D | 12 | 235 | 16695474 | 28084.39 | 2447 | 2378 | 594.4 |
| D | 8 | 195 | 4969385 | 8356.47 | 2447 | 2378 | 594.4 |
| D | 10 | 118 | 1698948 | 2854.3 | 2447 | 2378 | 594.4 |
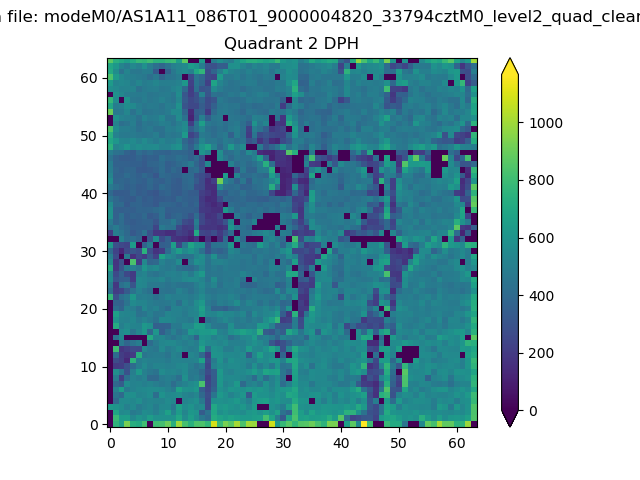
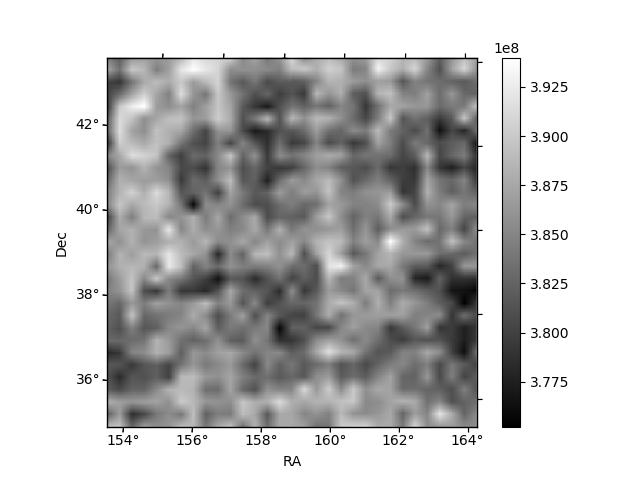
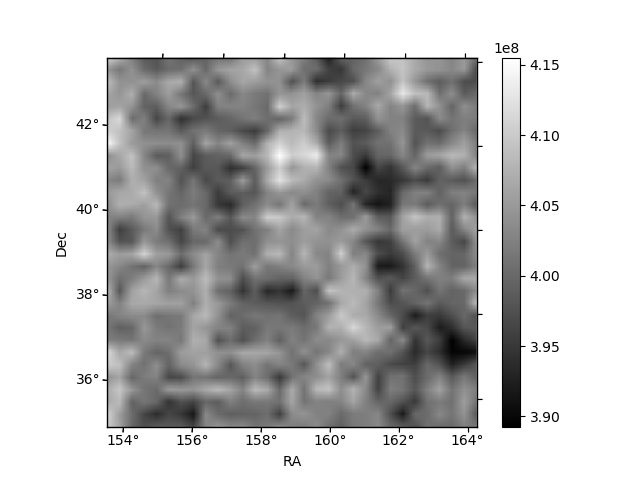
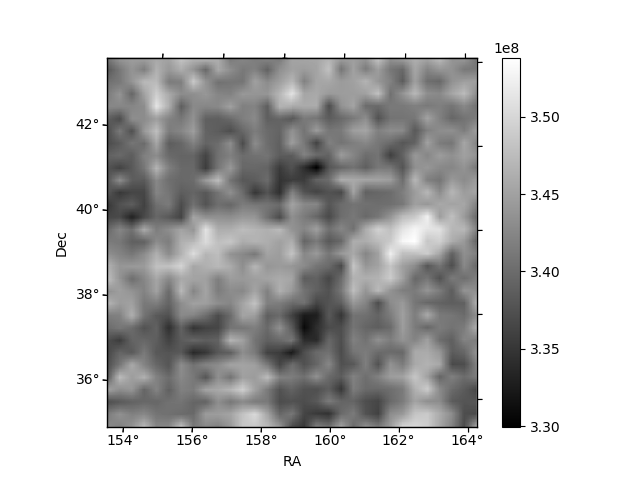
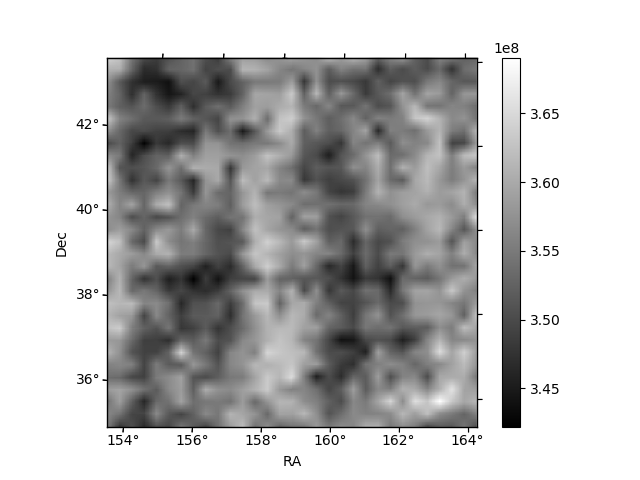
Histogram calculated using DETX and DETY for each event in the final _common_clean file
| Quadrant A | 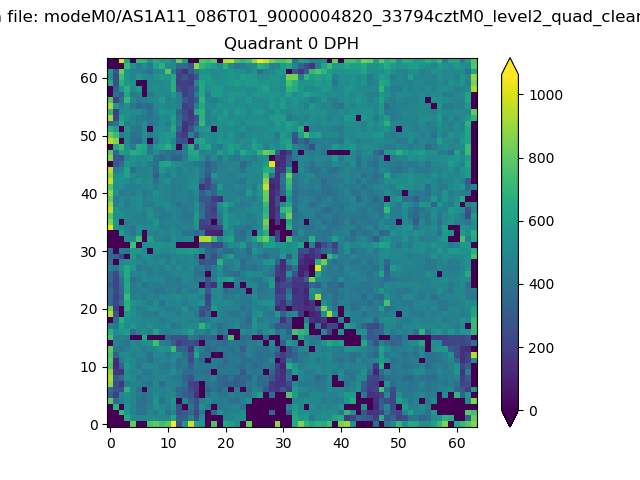 |
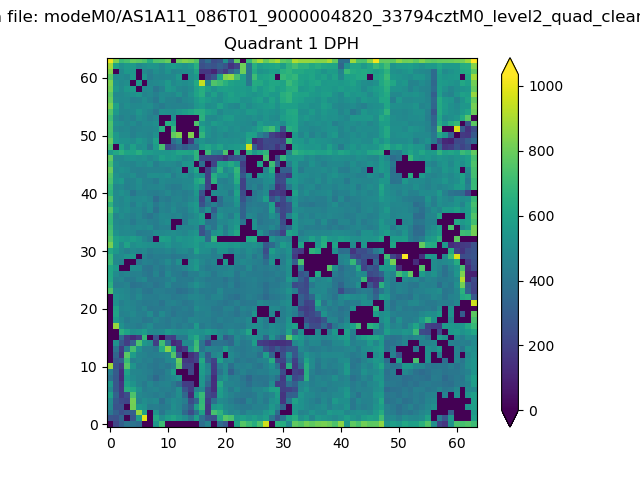 |
Quadrant B |
|---|---|---|---|
| Quadrant D | 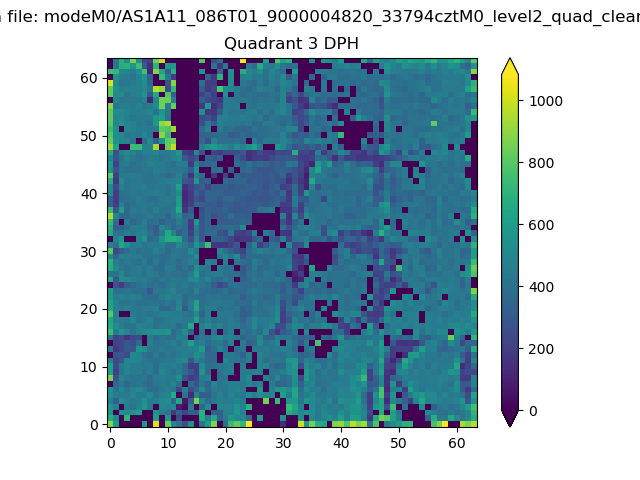 |
 |
Quadrant C |
| Plot type | Count rate plots | Images |
|---|---|---|
| Comparison with Poisson distribution Blue bars denote a histogram of data divided into 1 sec bins. Red curve is a Poisson curve with rate = median count rate of data. |
 |
 |
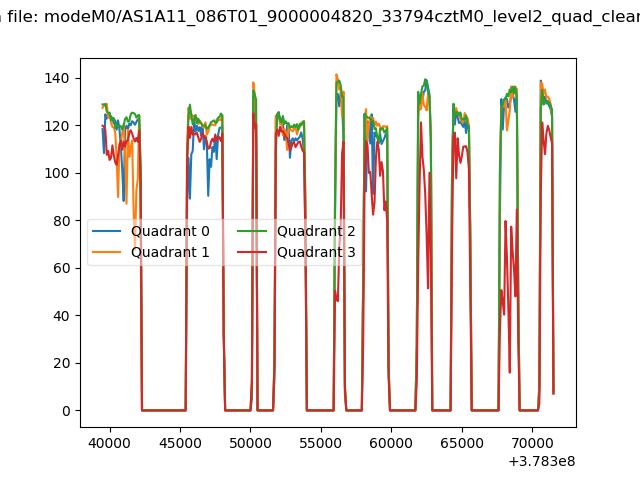
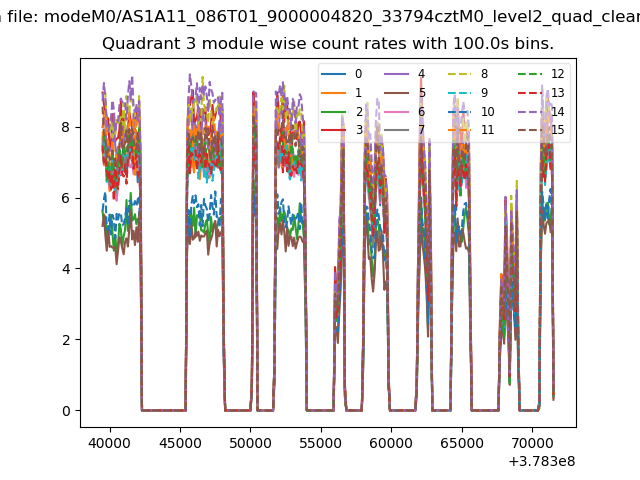
| Quadrant-wise count rates Data is divided into 100 sec bins |
 |
|
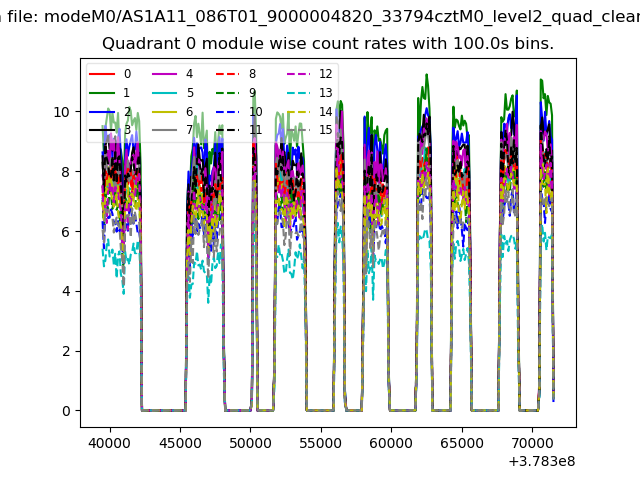
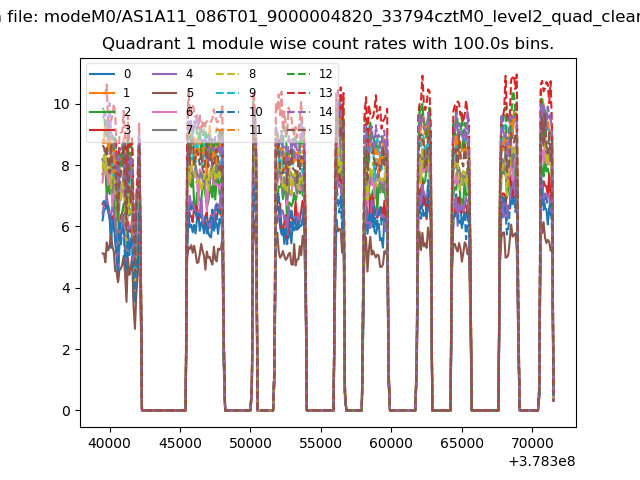
| Module-wise count rates for Quadrant A Data is divided into 100 sec bins |
 |
 |
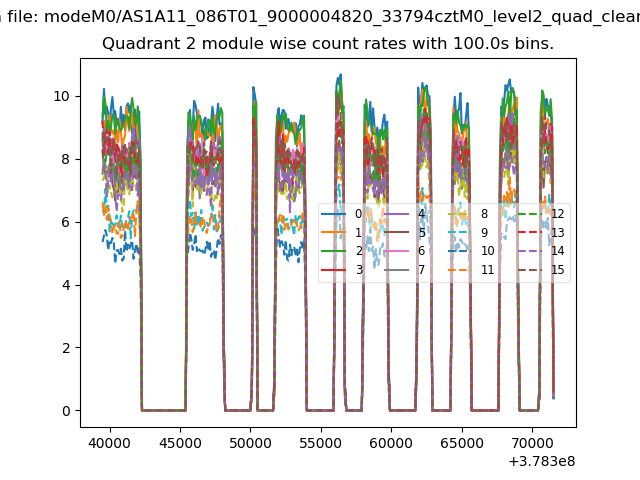
| Module-wise count rates for Quadrant B Data is divided into 100 sec bins |
 |
 |
| Module-wise count rates for Quadrant C Data is divided into 100 sec bins |
 |
 |
| Module-wise count rates for Quadrant D Data is divided into 100 sec bins |
 |
 |
| Parameter | Plot |
|---|---|
| CZT HV Monitor | 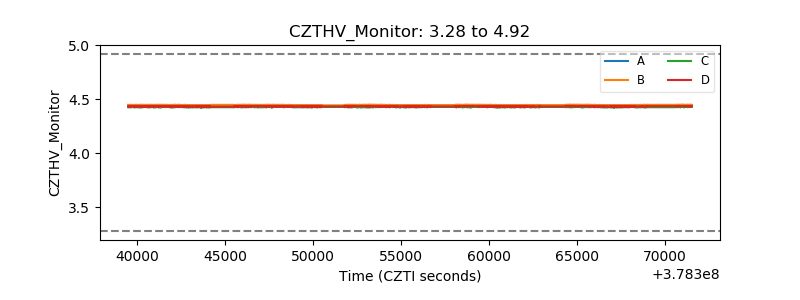 |
| D_VDD | 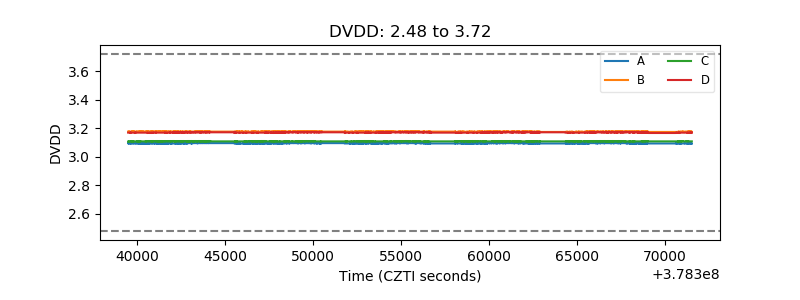 |
| Temperature 1 | 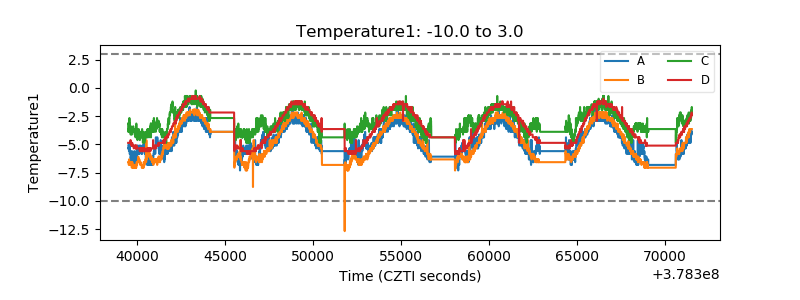 |
| Veto HV Monitor | 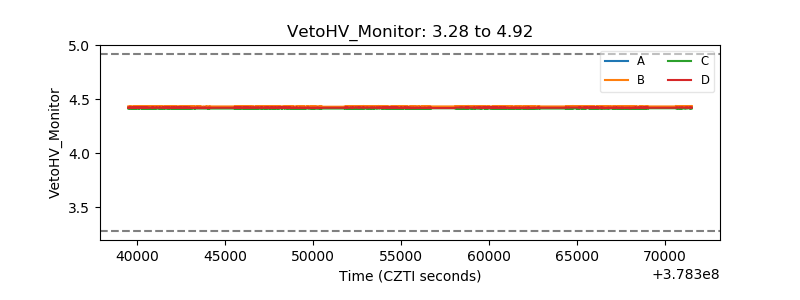 |
| Veto LLD | 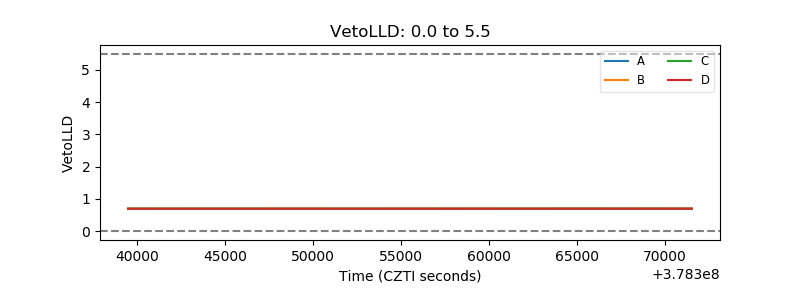 |
| Alpha Counter | 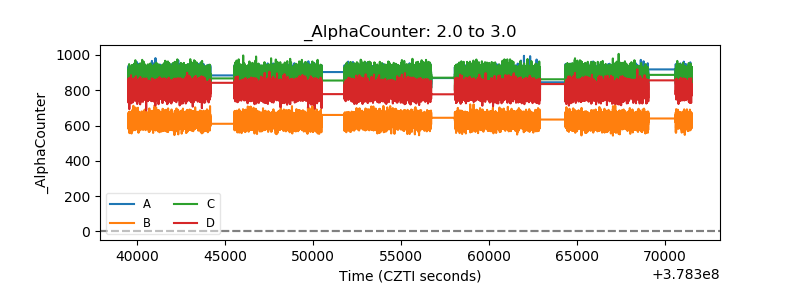 |
| _CPM_Rate | 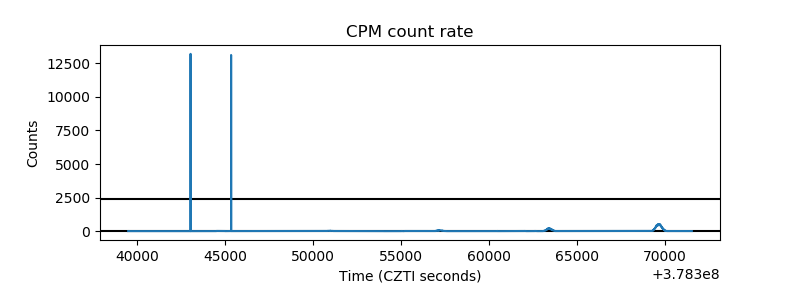 |
| CZT Counter | 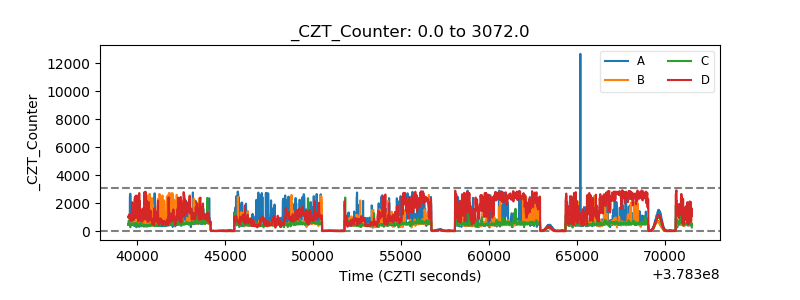 |
| +2.5 Volts monitor |  |
| +5 Volts monitor |  |
| _ROLL_ROT | 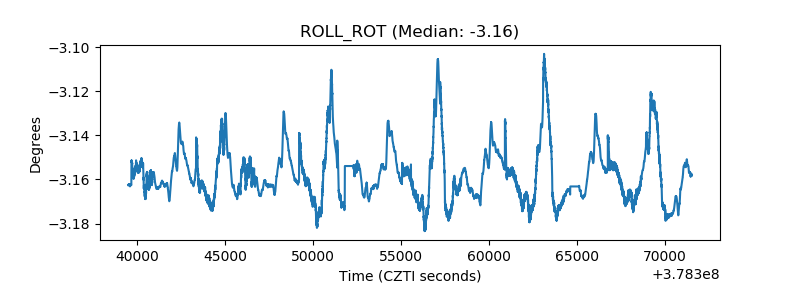 |
| _Roll_DEC | 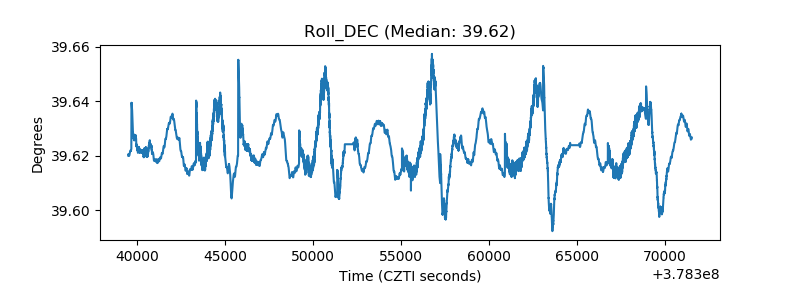 |
| _Roll_RA |  |
| Veto Counter | 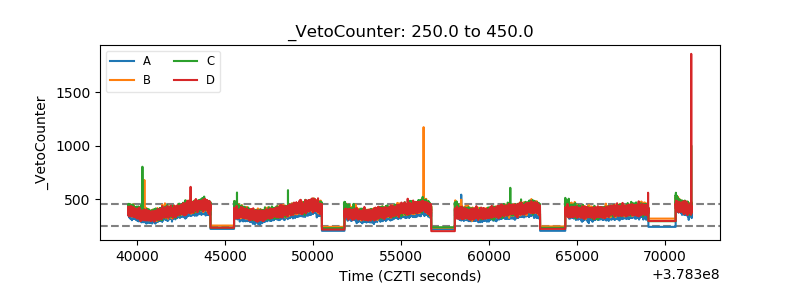 |