| Param | Original file | Final file |
|---|---|---|
| Filename | modeM0/AS1A11_086T01_9000004820_33797cztM0_level2.evt | modeM0/AS1A11_086T01_9000004820_33797cztM0_level2_quad_clean.evt |
| Size (bytes) | 546,635,520 | 45,126,720 |
| Size | 521.3 MB | 43.0 MB |
| Events in quadrant A | 3,222,750 | 269,781 |
| Events in quadrant B | 2,801,874 | 280,665 |
| Events in quadrant C | 2,430,003 | 281,120 |
| Events in quadrant D | 7,819,375 | 242,080 |
| Mode M9 | |||
|---|---|---|---|
| Quadrant | BADHDUFLAG | Total packets | Discarded packets |
| A | 0 | 8 | 0 |
| B | 0 | 8 | 0 |
| C | 0 | 8 | 0 |
| D | 0 | 9 | 0 |
| Mode SS | |||
|---|---|---|---|
| Quadrant | BADHDUFLAG | Total packets | Discarded packets |
| A | 0 | 82 | 0 |
| B | 0 | 82 | 0 |
| C | 0 | 82 | 0 |
| D | 0 | 82 | 0 |
| Mode M0 | |||
|---|---|---|---|
| Quadrant | BADHDUFLAG | Total packets | Discarded packets |
| A | 0 | 12162 | 1 |
| B | 0 | 10855 | 1 |
| C | 0 | 9555 | 1 |
| D | 0 | 26103 | 1 |
| Quadrant | Total seconds | Saturated seconds | Saturation percentage |
|---|---|---|---|
| A | 4148 | 427 | 10.294118% |
| B | 4148 | 204 | 4.918033% |
| C | 4148 | 32 | 0.771456% |
| D | 4148 | 2281 | 54.990357% |
Noise dominated data is calculated using 1-second bins in cleaned event files. If a bin has >2000 counts, and if more than 50% of those come from <1% of pixels, then it is considered to be noise-dominated and hence unusable.
| Quadrant | # 1 sec bins | Bins with >0 counts | Bins with >2000 counts | High rate bins dominated by noise | Noise dominated (total time) | Noise dominated (detector-on time) | Marked lightcurve |
|---|---|---|---|---|---|---|---|
| A | 4148 | 4148 | 299 | 299 | 7.21% | 7.21% | 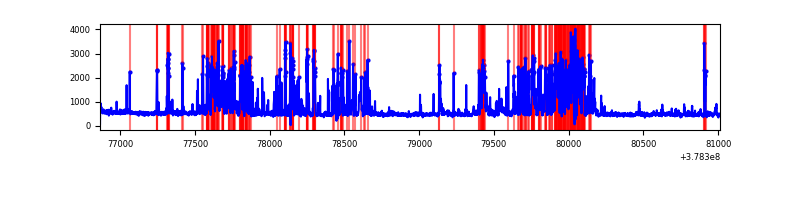 |
| B | 4148 | 4148 | 157 | 157 | 3.78% | 3.78% | 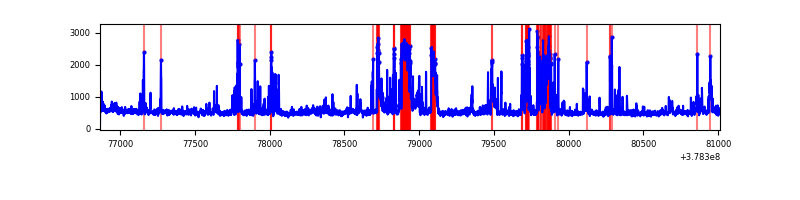 |
| C | 4148 | 4148 | 32 | 32 | 0.77% | 0.77% | 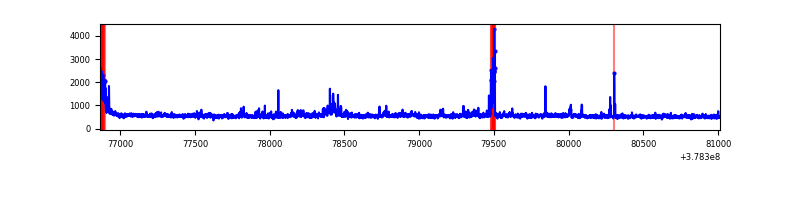 |
| D | 4148 | 4148 | 2248 | 2248 | 54.19% | 54.19% | 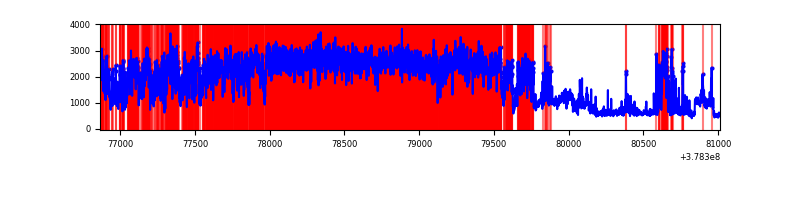 |
Top three noisy pixels from each quadrant. If the there are fewer than three noisy pixels in the level2.evt file, extra rows are filled as -1
| Pixel properties | Quadrant properties | ||||||
|---|---|---|---|---|---|---|---|
| Quadrant | DetID | PixID | Counts | Sigma | Mean | Median | Sigma |
| A | 15 | 237 | 1313461 | 13442.83 | 484 | 476 | 97.7 |
| A | 13 | 6 | 11795 | 115.89 | 484 | 476 | 97.7 |
| A | 12 | 16 | 10621 | 103.87 | 484 | 476 | 97.7 |
| B | 5 | 172 | 585742 | 6153.21 | 492 | 480 | 95.1 |
| B | 5 | 255 | 122742 | 1285.41 | 492 | 480 | 95.1 |
| B | 3 | 112 | 31411 | 325.2 | 492 | 480 | 95.1 |
| C | 15 | 214 | 178916 | 1580.88 | 489 | 492 | 112.9 |
| C | 3 | 233 | 126523 | 1116.67 | 489 | 492 | 112.9 |
| C | 4 | 254 | 81425 | 717.09 | 489 | 492 | 112.9 |
| D | 12 | 235 | 5103892 | 54802.65 | 375 | 363 | 93.1 |
| D | 8 | 195 | 556716 | 5974.22 | 375 | 363 | 93.1 |
| D | 2 | 250 | 478045 | 5129.44 | 375 | 363 | 93.1 |
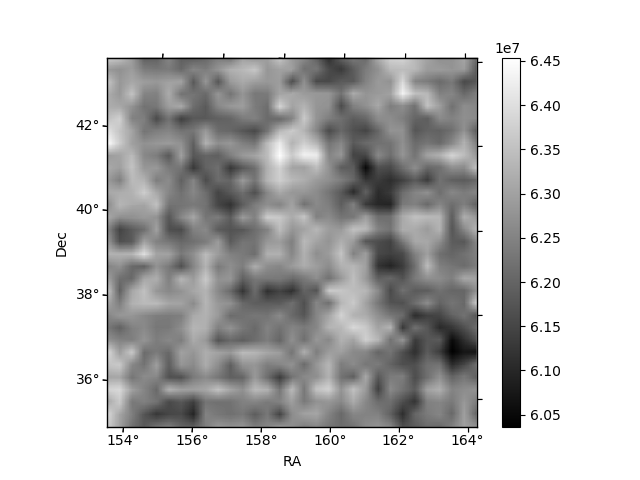
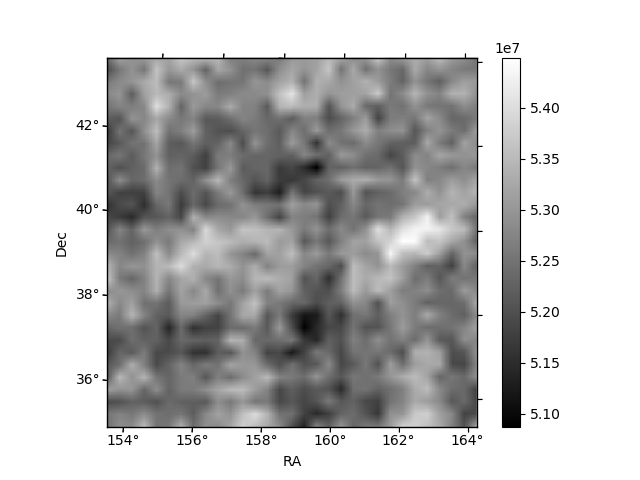
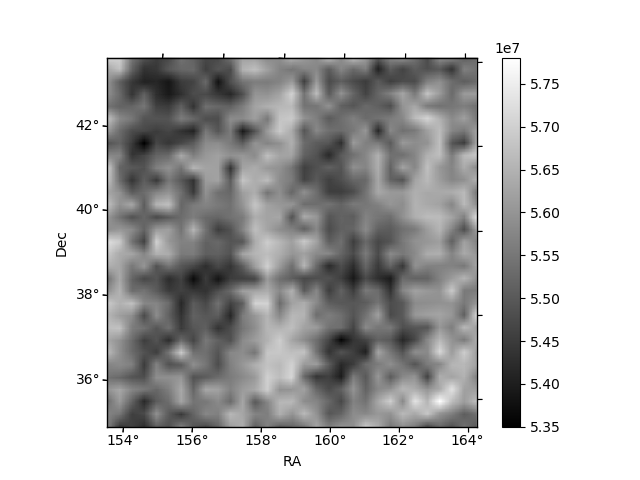
Histogram calculated using DETX and DETY for each event in the final _common_clean file
| Quadrant A | 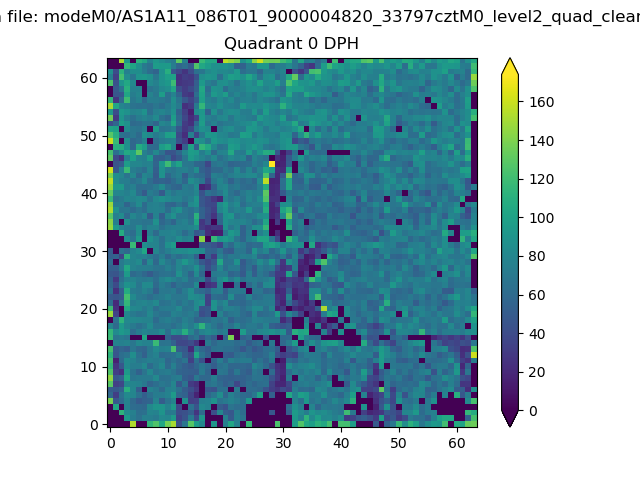 |
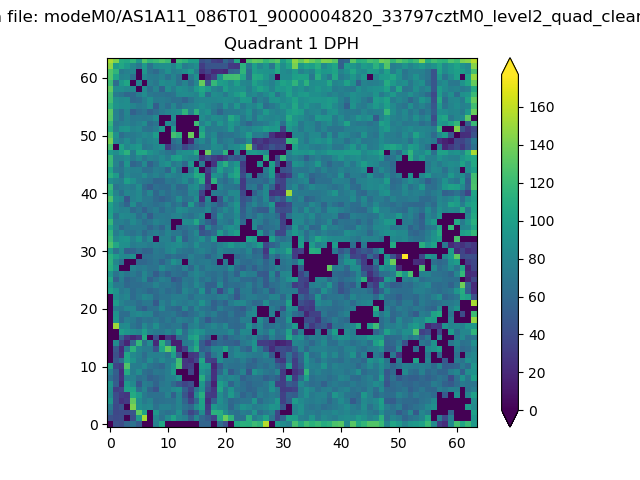 |
Quadrant B |
|---|---|---|---|
| Quadrant D | 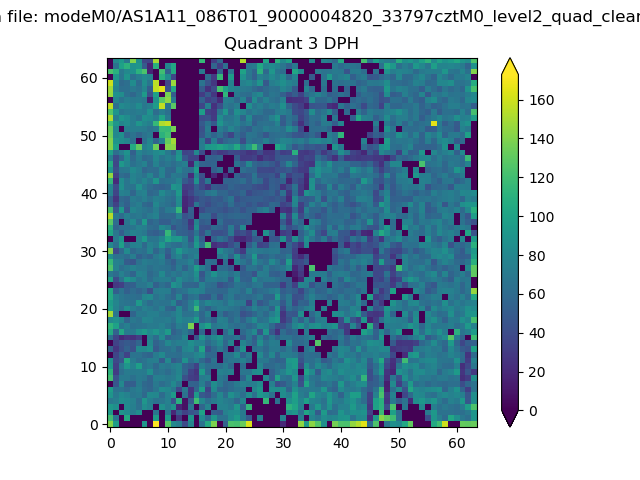 |
 |
Quadrant C |
| Plot type | Count rate plots | Images |
|---|---|---|
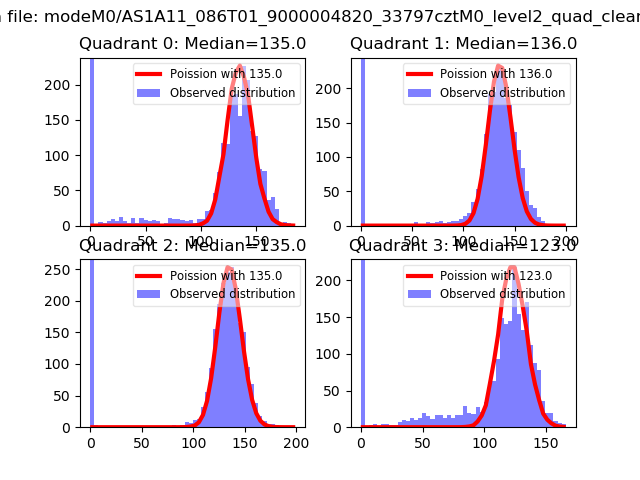
| Comparison with Poisson distribution Blue bars denote a histogram of data divided into 1 sec bins. Red curve is a Poisson curve with rate = median count rate of data. |
 |
 |
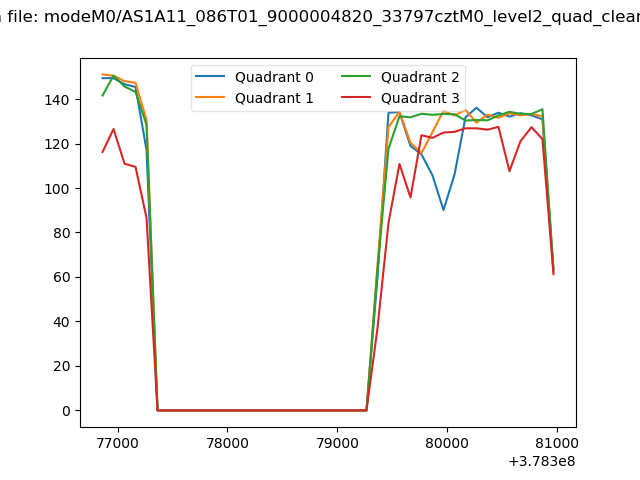
| Quadrant-wise count rates Data is divided into 100 sec bins |
 |
|
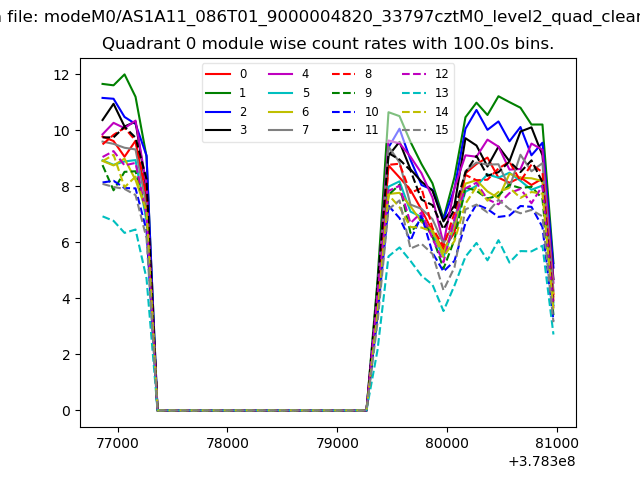
| Module-wise count rates for Quadrant A Data is divided into 100 sec bins |
 |
 |
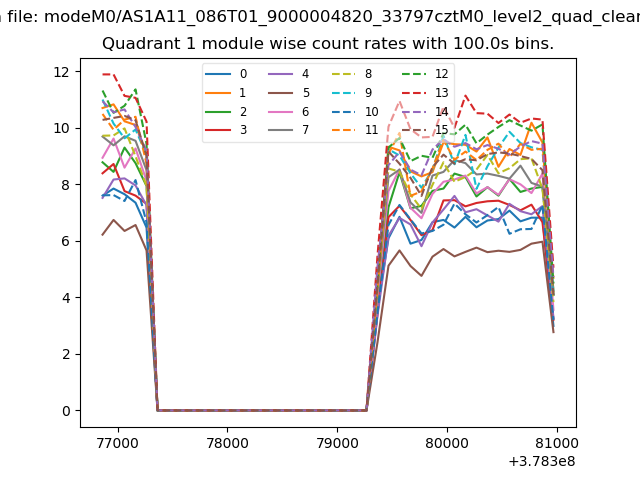
| Module-wise count rates for Quadrant B Data is divided into 100 sec bins |
 |
 |
| Module-wise count rates for Quadrant C Data is divided into 100 sec bins |
 |
 |
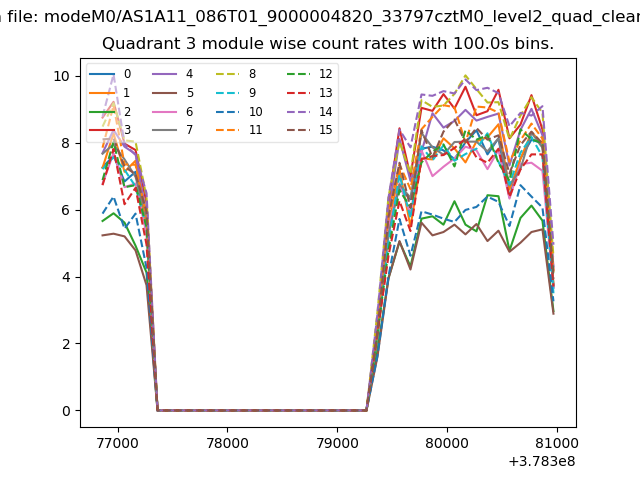
| Module-wise count rates for Quadrant D Data is divided into 100 sec bins |
 |
 |
| Parameter | Plot |
|---|---|
| CZT HV Monitor | 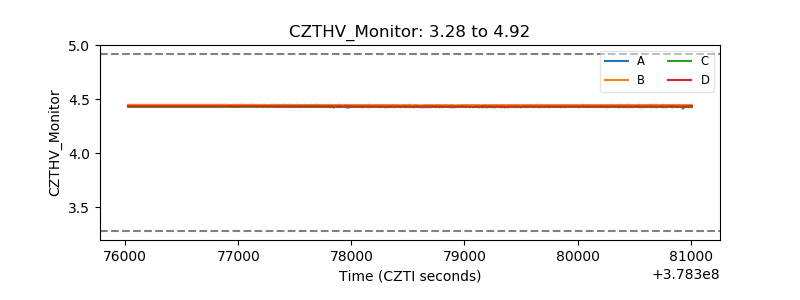 |
| D_VDD | 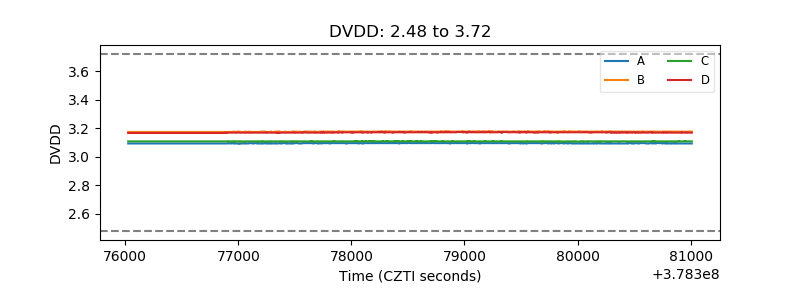 |
| Temperature 1 | 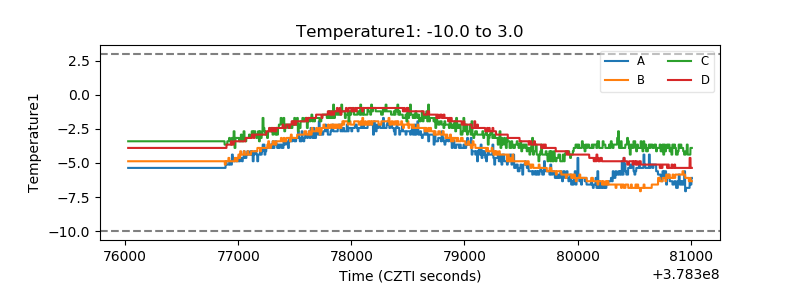 |
| Veto HV Monitor | 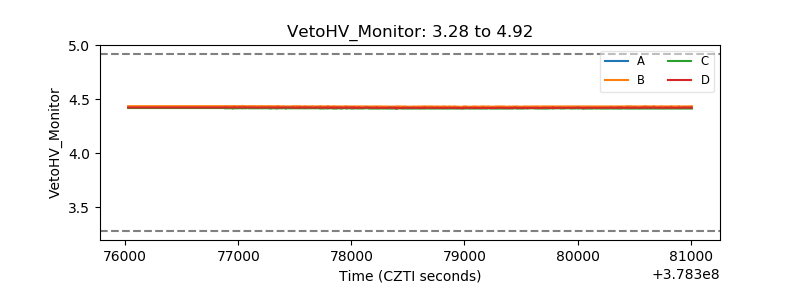 |
| Veto LLD | 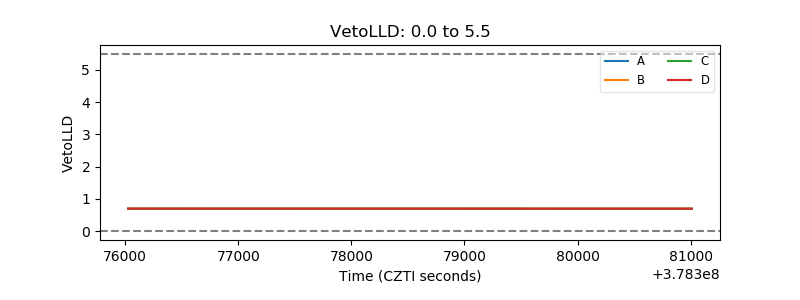 |
| Alpha Counter | 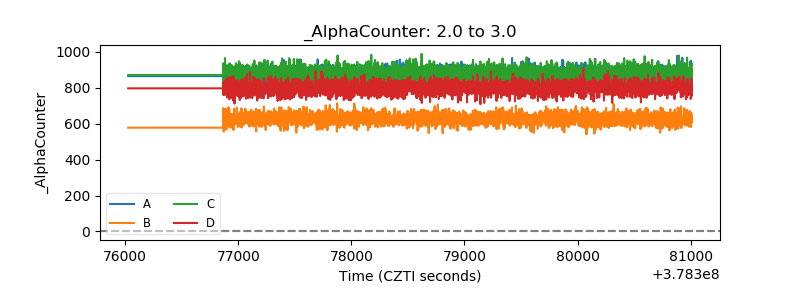 |
| _CPM_Rate | 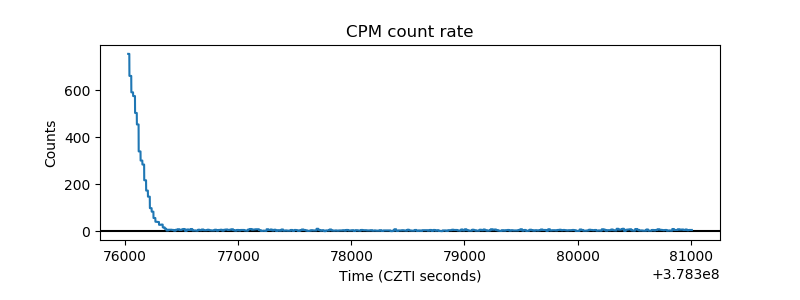 |
| CZT Counter | 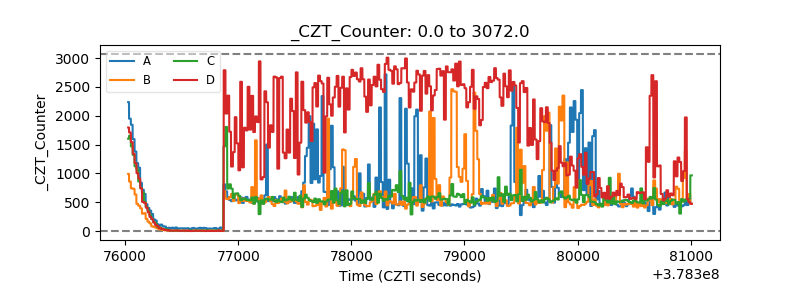 |
| +2.5 Volts monitor |  |
| +5 Volts monitor | 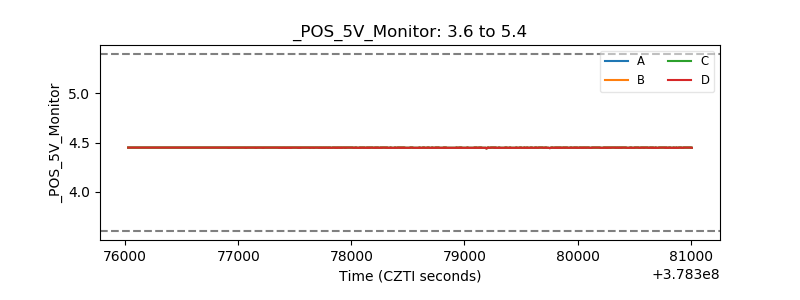 |
| _ROLL_ROT | 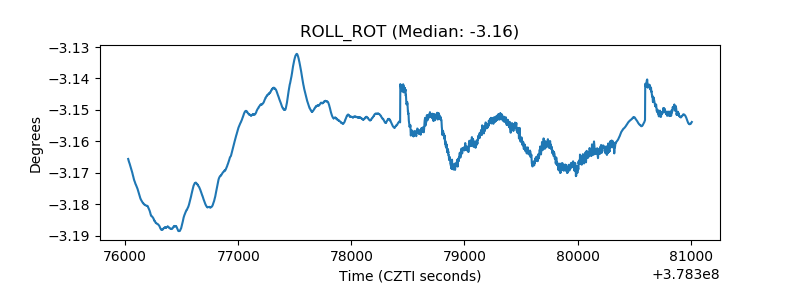 |
| _Roll_DEC | 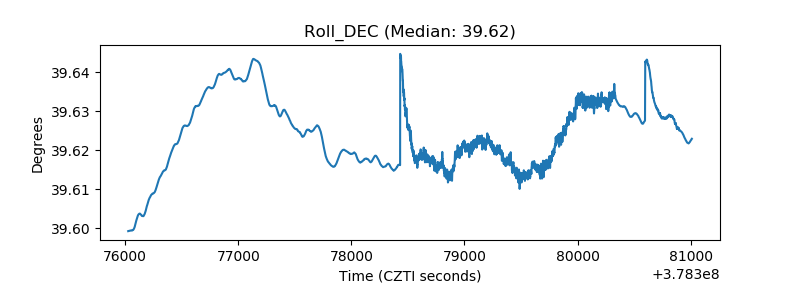 |
| _Roll_RA |  |
| Veto Counter | 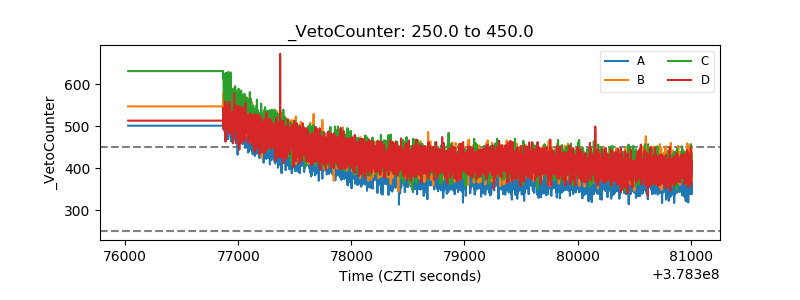 |