| Param | Original file | Final file |
|---|---|---|
| Filename | modeM0/AS1A11_086T01_9000004820_33939cztM0_level2.evt | modeM0/AS1A11_086T01_9000004820_33939cztM0_level2_quad_clean.evt |
| Size (bytes) | 20,134,080 | 5,100,480 |
| Size | 19.2 MB | 4.9 MB |
| Events in quadrant A | 147,688 | 38,403 |
| Events in quadrant B | 148,713 | 37,150 |
| Events in quadrant C | 148,286 | 27,946 |
| Events in quadrant D | 145,149 | 25,529 |
| Mode M9 | |||
|---|---|---|---|
| Quadrant | BADHDUFLAG | Total packets | Discarded packets |
| A | 0 | 16 | 9 |
| B | 0 | 16 | 8 |
| C | 0 | 16 | 7 |
| D | 0 | 16 | 10 |
| Mode SS | |||
|---|---|---|---|
| Quadrant | BADHDUFLAG | Total packets | Discarded packets |
| A | 0 | 51 | 47 |
| B | 0 | 51 | 49 |
| C | 0 | 55 | 55 |
| D | 0 | 55 | 45 |
| Mode M0 | |||
|---|---|---|---|
| Quadrant | BADHDUFLAG | Total packets | Discarded packets |
| A | 0 | 5099 | 4517 |
| B | 0 | 5551 | 4965 |
| C | 0 | 5948 | 5376 |
| D | 0 | 7202 | 6648 |
| Quadrant | Total seconds | Saturated seconds | Saturation percentage |
|---|---|---|---|
| A | 287 | 3 | 1.045296% |
| B | 279 | 1 | 0.358423% |
| C | 221 | 1 | 0.452489% |
| D | 212 | 6 | 2.830189% |
Noise dominated data is calculated using 1-second bins in cleaned event files. If a bin has >2000 counts, and if more than 50% of those come from <1% of pixels, then it is considered to be noise-dominated and hence unusable.
| Quadrant | # 1 sec bins | Bins with >0 counts | Bins with >2000 counts | High rate bins dominated by noise | Noise dominated (total time) | Noise dominated (detector-on time) | Marked lightcurve |
|---|---|---|---|---|---|---|---|
| A | 3467 | 412 | 0 | 0 | 0.00% | 0.00% | 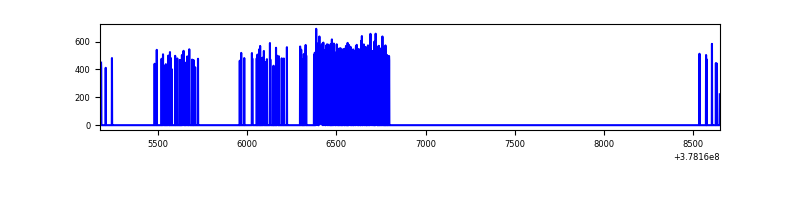 |
| B | 3464 | 395 | 0 | 0 | 0.00% | 0.00% | 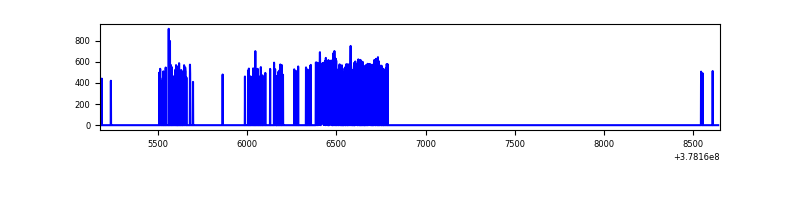 |
| C | 3461 | 353 | 0 | 0 | 0.00% | 0.00% | 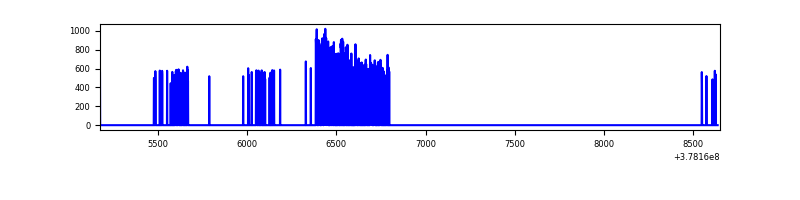 |
| D | 3165 | 328 | 4 | 4 | 0.13% | 1.22% | 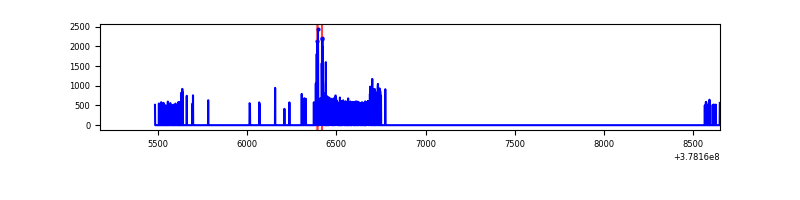 |
Top three noisy pixels from each quadrant. If the there are fewer than three noisy pixels in the level2.evt file, extra rows are filled as -1
| Pixel properties | Quadrant properties | ||||||
|---|---|---|---|---|---|---|---|
| Quadrant | DetID | PixID | Counts | Sigma | Mean | Median | Sigma |
| A | 13 | 254 | 500 | 46.23 | 38 | 37 | 10.0 |
| A | 9 | 191 | 427 | 38.94 | 38 | 37 | 10.0 |
| A | 3 | 137 | 380 | 34.25 | 38 | 37 | 10.0 |
| B | 5 | 172 | 2834 | 297.43 | 36 | 35 | 9.4 |
| B | 0 | 199 | 1781 | 185.53 | 36 | 35 | 9.4 |
| B | 11 | 111 | 846 | 86.18 | 36 | 35 | 9.4 |
| C | 3 | 233 | 23106 | 2737.78 | 28 | 28 | 8.4 |
| C | 15 | 214 | 9411 | 1113.12 | 28 | 28 | 8.4 |
| C | 14 | 67 | 3766 | 443.44 | 28 | 28 | 8.4 |
| D | 13 | 249 | 18331 | 2127.05 | 27 | 26 | 8.6 |
| D | 8 | 195 | 14233 | 1650.86 | 27 | 26 | 8.6 |
| D | 2 | 250 | 4457 | 514.88 | 27 | 26 | 8.6 |
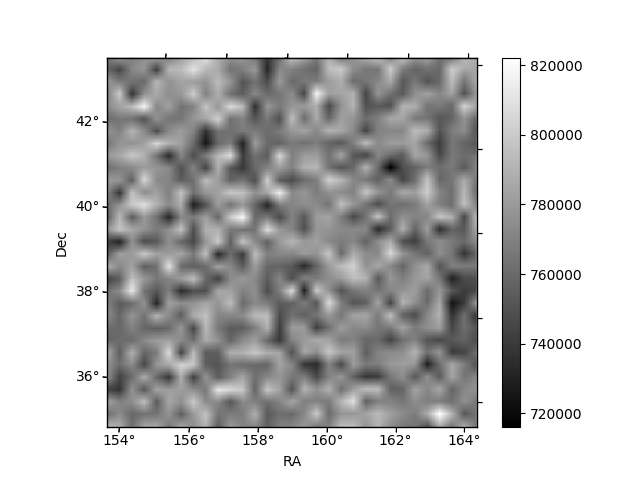
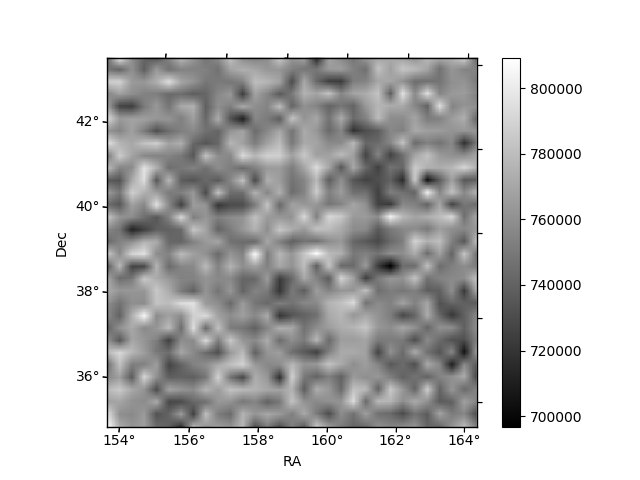
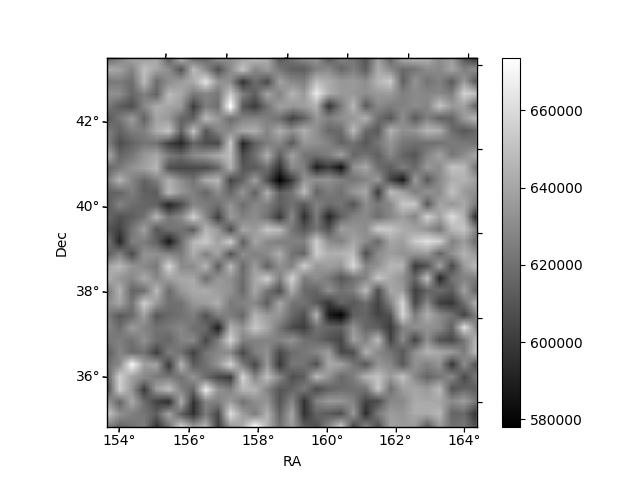
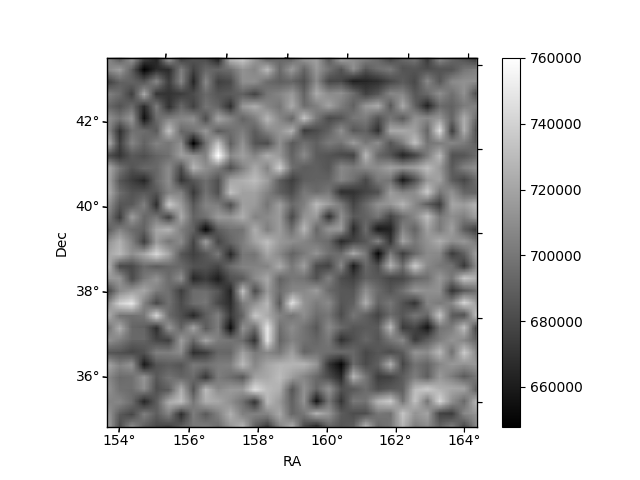
Histogram calculated using DETX and DETY for each event in the final _common_clean file
| Quadrant A | 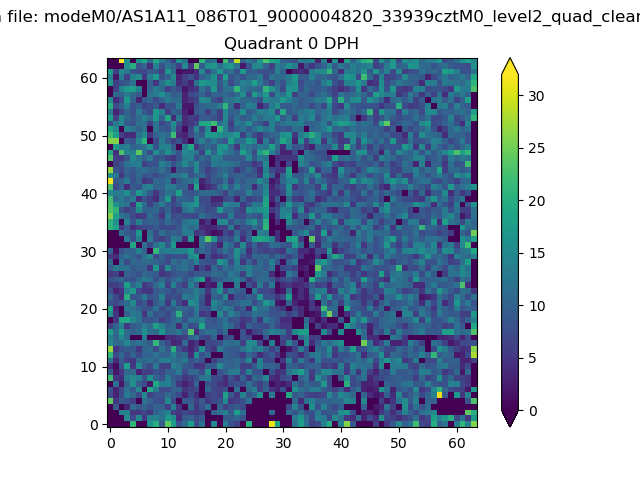 |
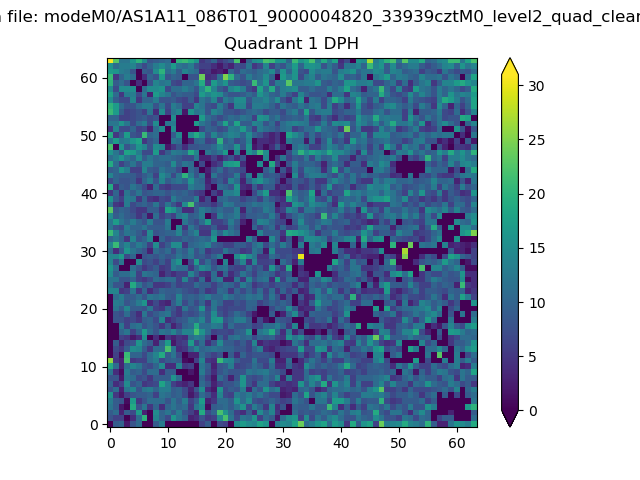 |
Quadrant B |
|---|---|---|---|
| Quadrant D | 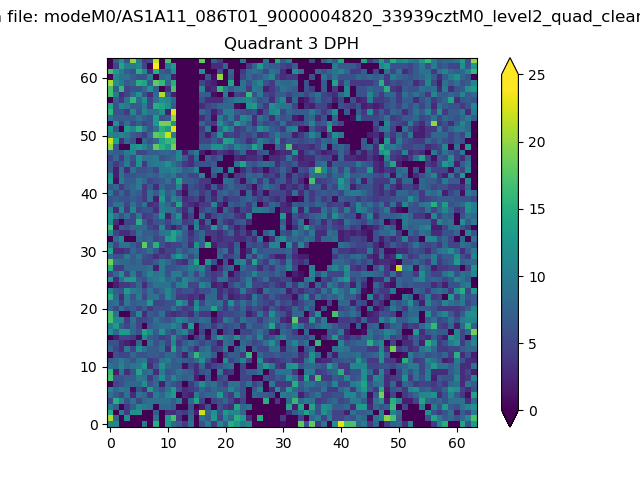 |
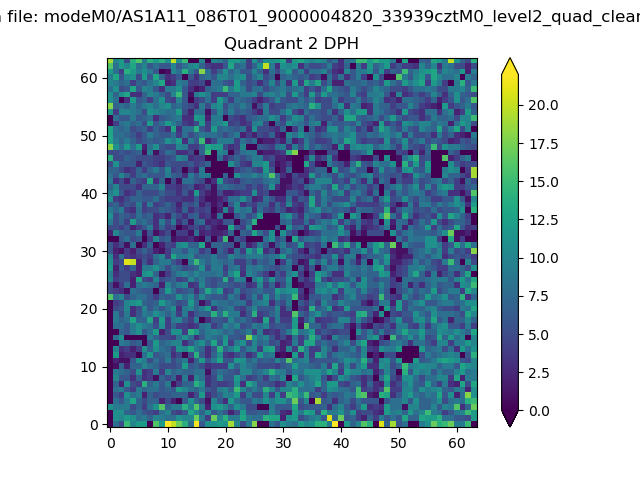 |
Quadrant C |
| Plot type | Count rate plots | Images |
|---|---|---|
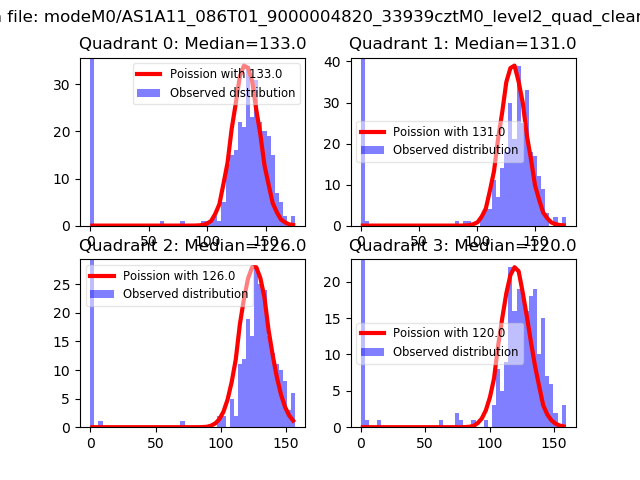
| Comparison with Poisson distribution Blue bars denote a histogram of data divided into 1 sec bins. Red curve is a Poisson curve with rate = median count rate of data. |
 |
 |
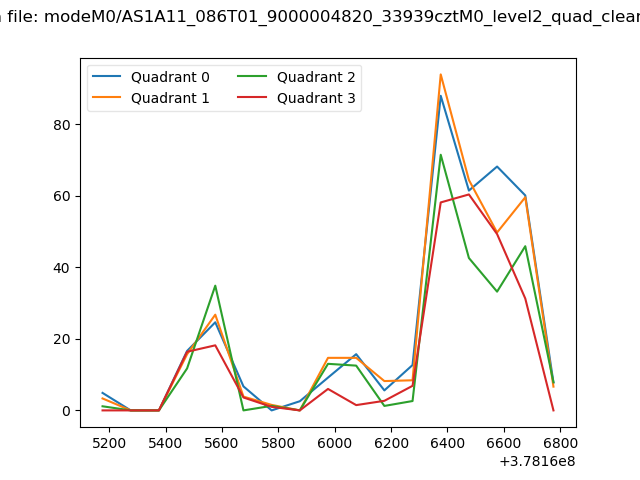
| Quadrant-wise count rates Data is divided into 100 sec bins |
 |
|
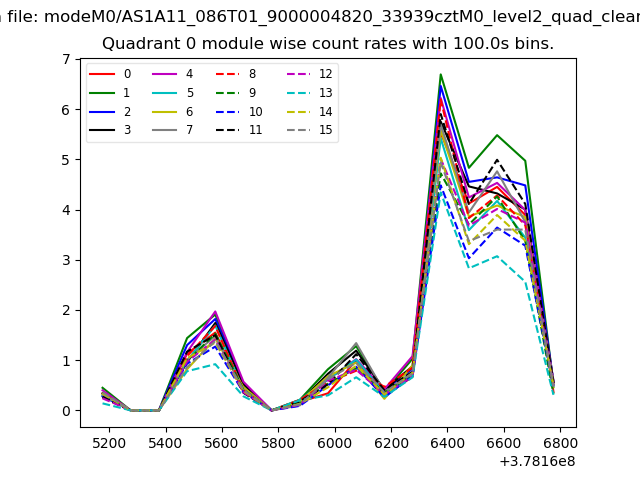
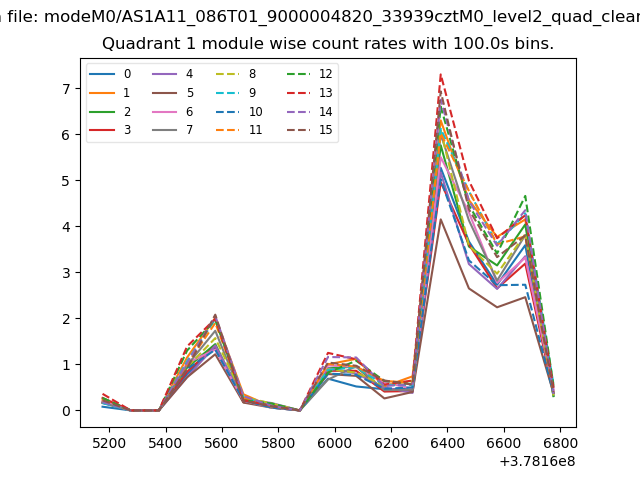
| Module-wise count rates for Quadrant A Data is divided into 100 sec bins |
 |
 |
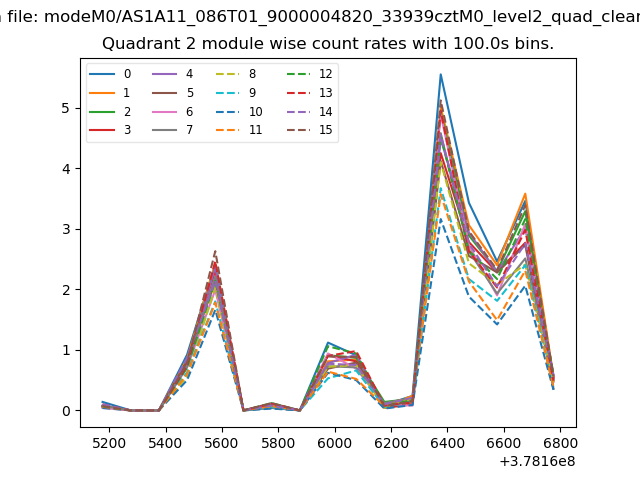
| Module-wise count rates for Quadrant B Data is divided into 100 sec bins |
 |
 |
| Module-wise count rates for Quadrant C Data is divided into 100 sec bins |
 |
 |
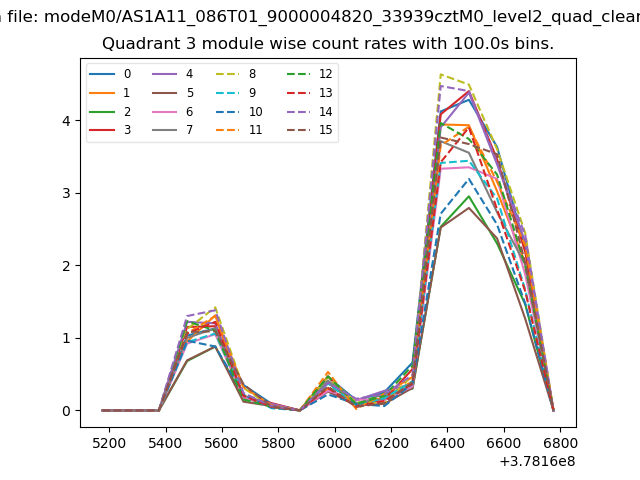
| Module-wise count rates for Quadrant D Data is divided into 100 sec bins |
 |
 |
| Parameter | Plot |
|---|---|
| CZT HV Monitor | 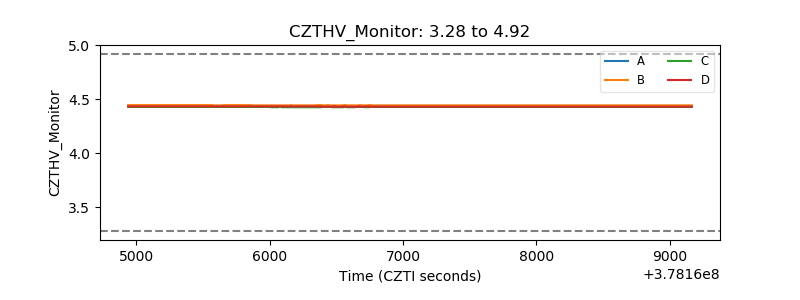 |
| D_VDD | 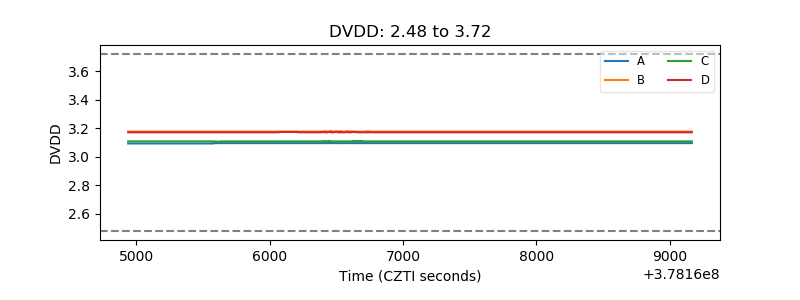 |
| Temperature 1 | 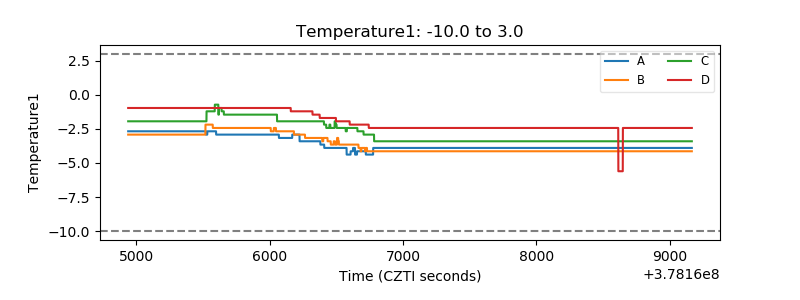 |
| Veto HV Monitor | 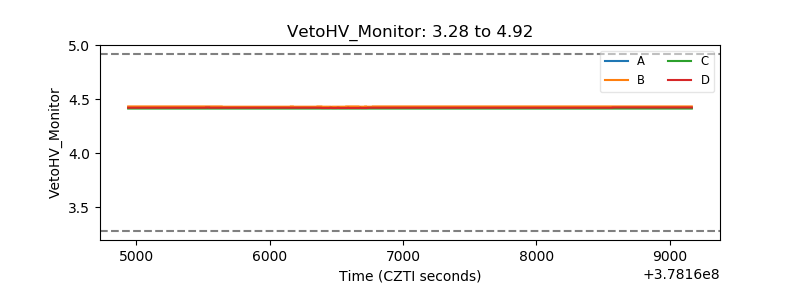 |
| Veto LLD | 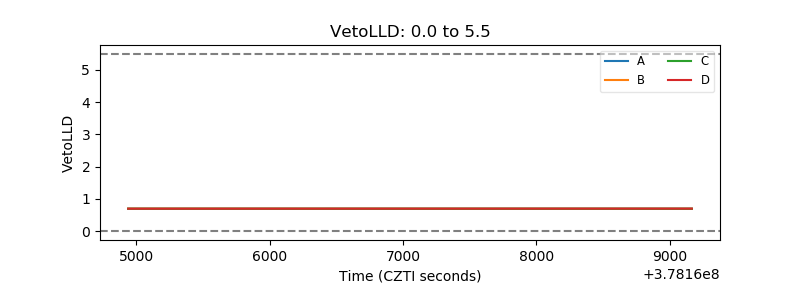 |
| Alpha Counter | 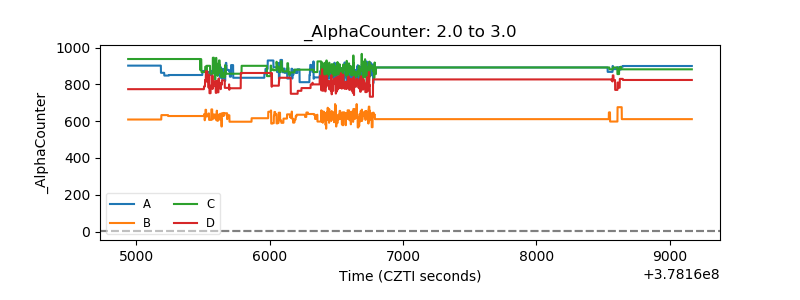 |
| _CPM_Rate | 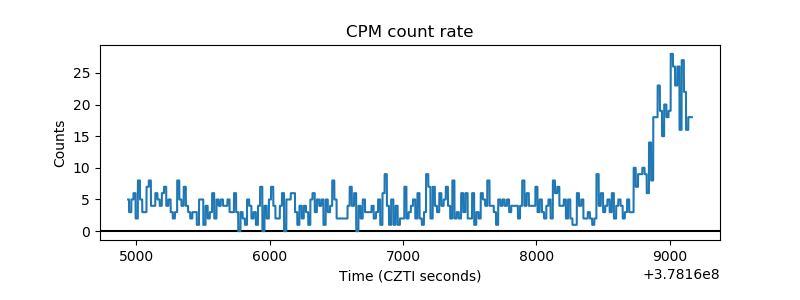 |
| CZT Counter | 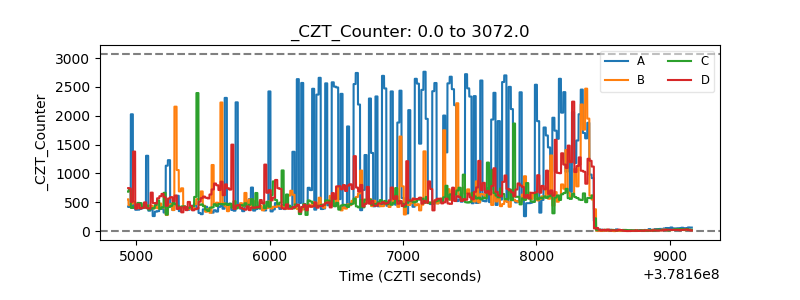 |
| +2.5 Volts monitor |  |
| +5 Volts monitor | 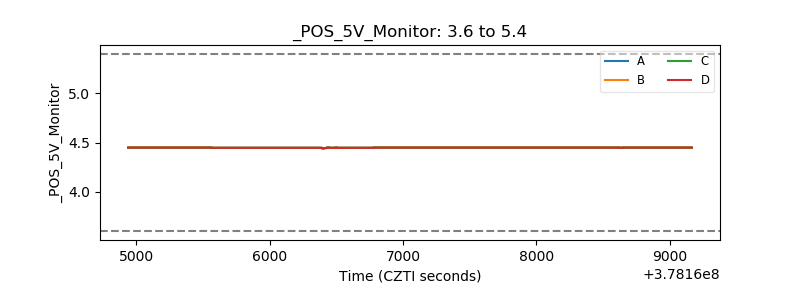 |
| _ROLL_ROT | 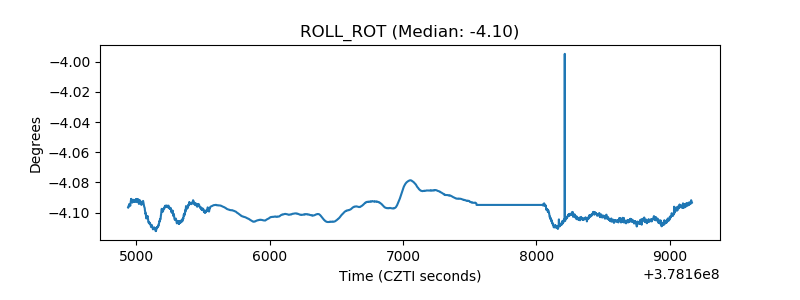 |
| _Roll_DEC | 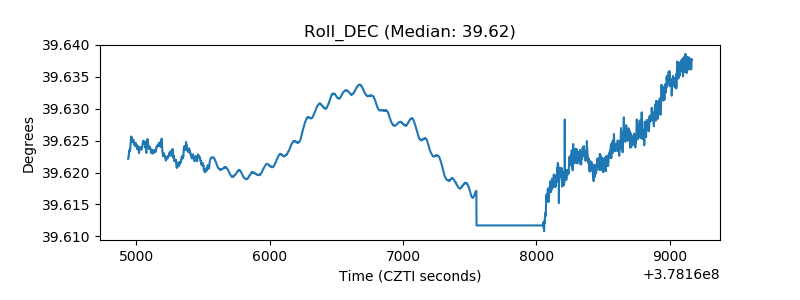 |
| _Roll_RA | 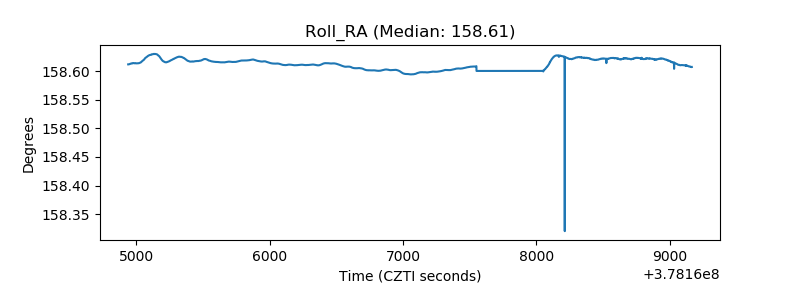 |
| Veto Counter | 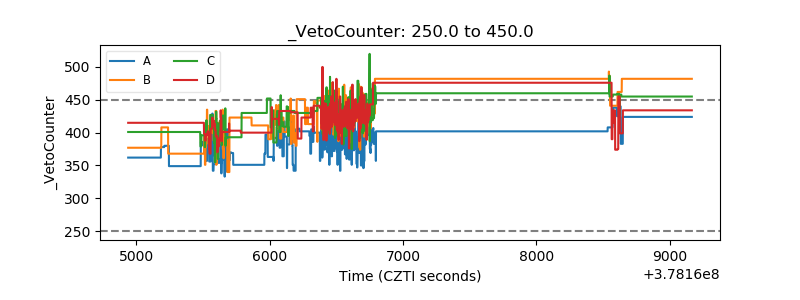 |