| Param | Original file | Final file |
|---|---|---|
| Filename | modeM0/AS1T04_077T01_9000004824cztM0_level2.fits | modeM0/AS1T04_077T01_9000004824cztM0_level2_quad_clean.evt |
| Size (bytes) | 409,115,520 | 335,831,040 |
| Size | 390.2 MB | 320.3 MB |
| Events in quadrant A | 2,505,626 | 1,865,057 |
| Events in quadrant B | 2,478,300 | 2,015,335 |
| Events in quadrant C | 2,585,946 | 1,981,727 |
| Events in quadrant D | 1,865,334 | 1,359,860 |
| Mode M9 | |||
|---|---|---|---|
| Quadrant | BADHDUFLAG | Total packets | Discarded packets |
| A | 0 | 148 | 0 |
| B | 0 | 148 | 0 |
| C | 0 | 148 | 0 |
| D | 0 | 148 | 0 |
| Mode M0 | |||
|---|---|---|---|
| Quadrant | BADHDUFLAG | Total packets | Discarded packets |
| A | 0 | 111075 | 0 |
| B | 0 | 107001 | 0 |
| C | 0 | 98742 | 0 |
| D | 0 | 233556 | 0 |
| Mode SS | |||
|---|---|---|---|
| Quadrant | BADHDUFLAG | Total packets | Discarded packets |
| A | 0 | 878 | 0 |
| B | 0 | 878 | 0 |
| C | 0 | 878 | 0 |
| D | 0 | 878 | 0 |
| Quadrant | Total seconds | Saturated seconds | Saturation percentage |
|---|---|---|---|
| A | 42915 | 3580 | 8.342072% |
| B | 42915 | 1382 | 3.220319% |
| C | 42916 | 369 | 0.859819% |
| D | 42915 | 14388 | 33.526739% |
Noise dominated data is calculated using 1-second bins in cleaned event files. If a bin has >2000 counts, and if more than 50% of those come from <1% of pixels, then it is considered to be noise-dominated and hence unusable.
| Quadrant | # 1 sec bins | Bins with >0 counts | Bins with >2000 counts | High rate bins dominated by noise | Noise dominated (total time) | Noise dominated (detector-on time) | Marked lightcurve |
|---|---|---|---|---|---|---|---|
| A | 58177 | 42699 | 0 | 0 | 0.00% | 0.00% | 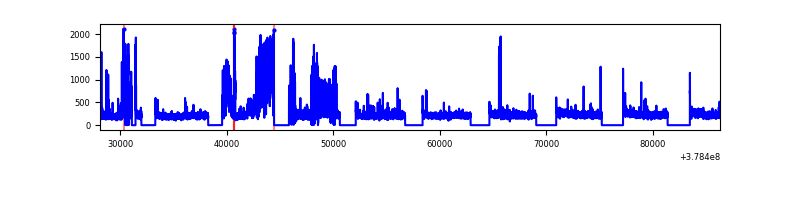 |
| B | 58177 | 42910 | 0 | 0 | 0.00% | 0.00% | 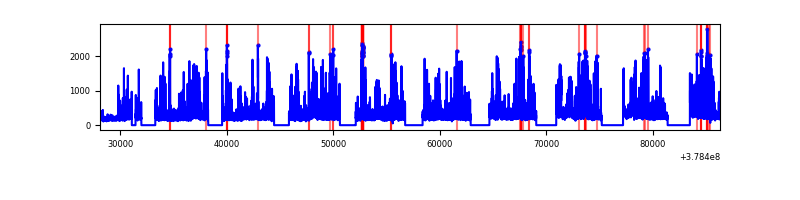 |
| C | 58177 | 42913 | 0 | 0 | 0.00% | 0.00% | 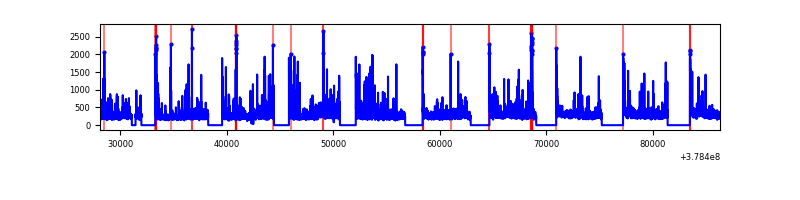 |
| D | 58176 | 42781 | 0 | 0 | 0.00% | 0.00% | 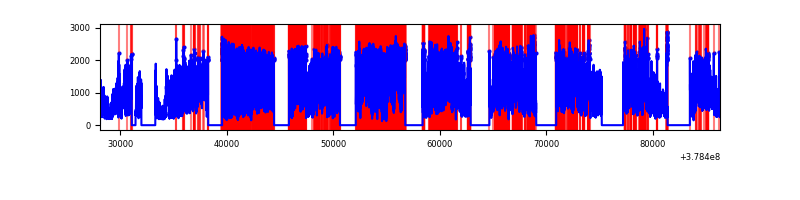 |
Top three noisy pixels from each quadrant. If the there are fewer than three noisy pixels in the level2.evt file, extra rows are filled as -1
| Pixel properties | Quadrant properties | ||||||
|---|---|---|---|---|---|---|---|
| Quadrant | DetID | PixID | Counts | Sigma | Mean | Median | Sigma |
| A | 7 | 110 | 1993 | 8.64 | 654 | 615 | 159.6 |
| A | 9 | 19 | 1948 | 8.35 | 654 | 615 | 159.6 |
| A | 0 | 29 | 1897 | 8.03 | 654 | 615 | 159.6 |
| B | 2 | 9 | 2226 | 12.16 | 658 | 629 | 131.3 |
| B | 3 | 80 | 1924 | 9.86 | 658 | 629 | 131.3 |
| B | 2 | 8 | 1762 | 8.63 | 658 | 629 | 131.3 |
| C | 1 | 81 | 2166 | 8.81 | 685 | 645 | 172.7 |
| C | 1 | 80 | 2105 | 8.46 | 685 | 645 | 172.7 |
| C | 3 | 187 | 1736 | 6.32 | 685 | 645 | 172.7 |
| D | 10 | 113 | 1384 | 6.39 | 534 | 489 | 140.1 |
| D | 7 | 3 | 1355 | 6.18 | 534 | 489 | 140.1 |
| D | 10 | 189 | 1348 | 6.13 | 534 | 489 | 140.1 |
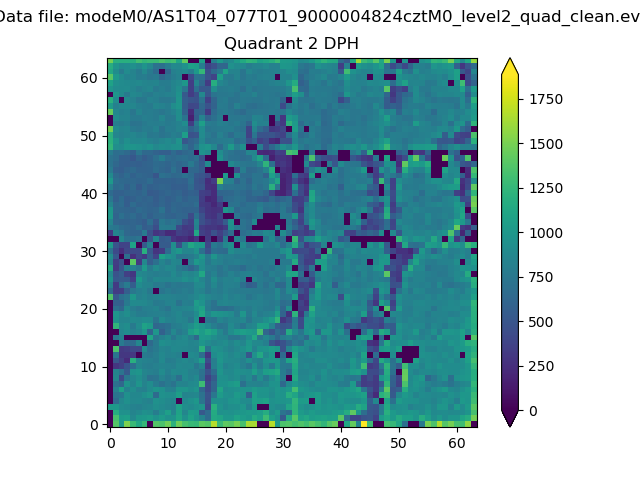
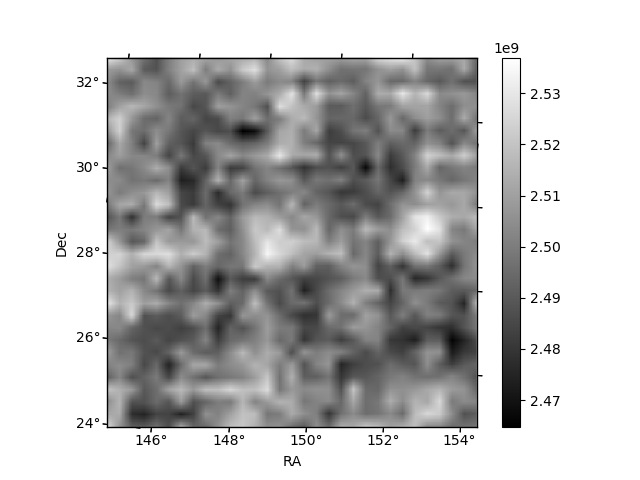
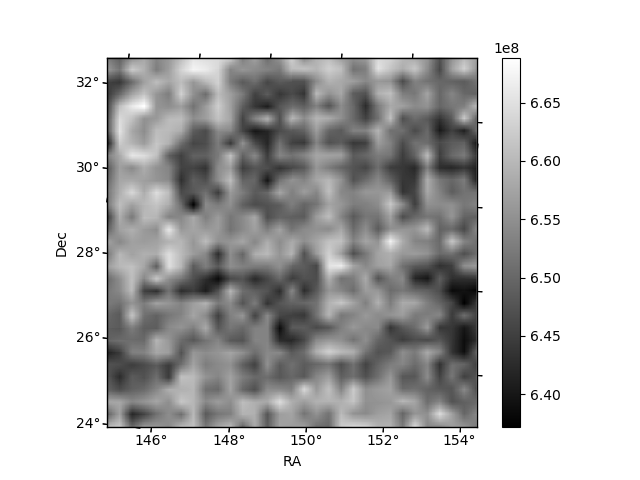
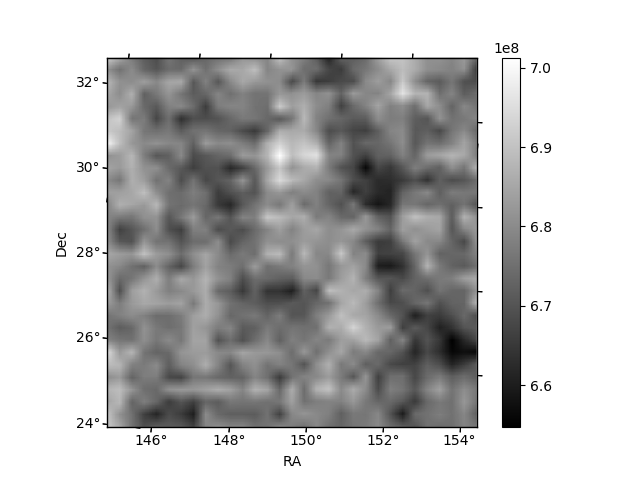
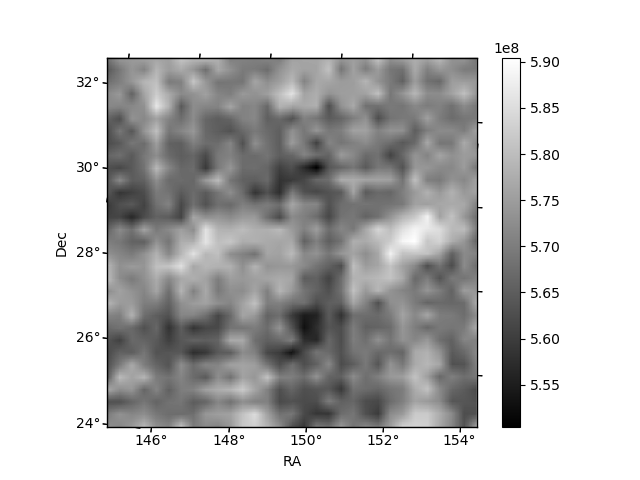
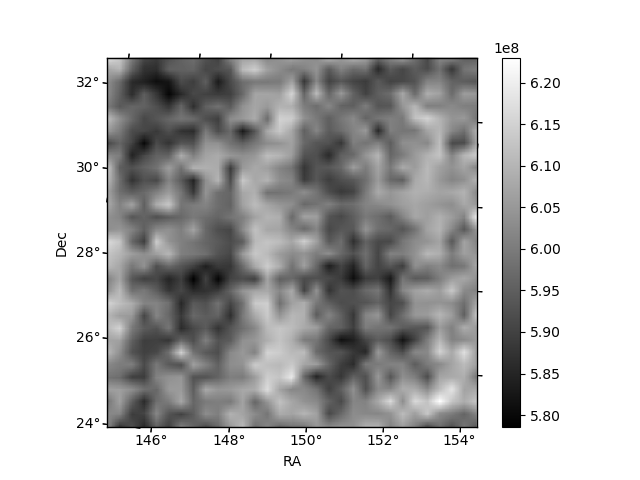
Histogram calculated using DETX and DETY for each event in the final _common_clean file
| Quadrant A | 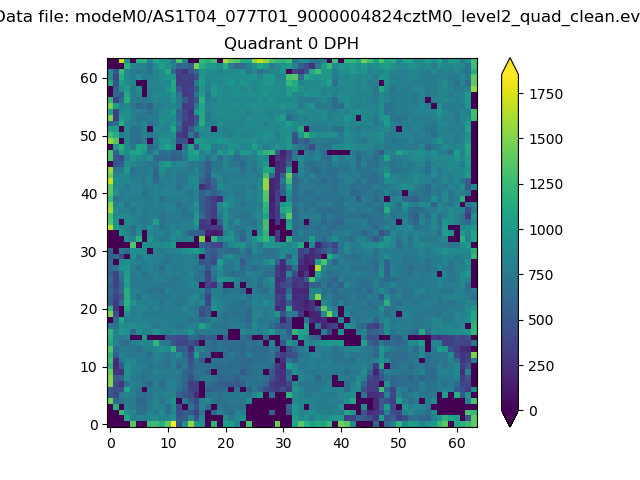 |
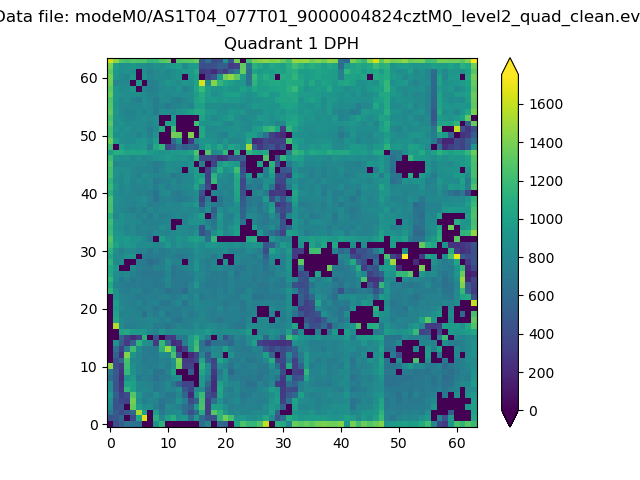 |
Quadrant B |
|---|---|---|---|
| Quadrant D | 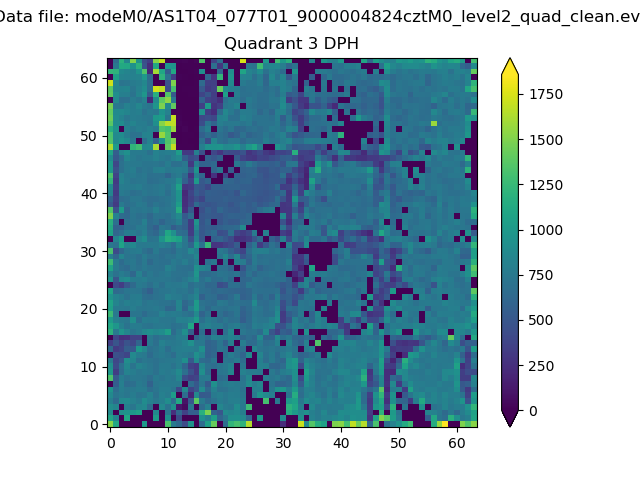 |
 |
Quadrant C |
| Plot type | Count rate plots | Images |
|---|---|---|
| Comparison with Poisson distribution Blue bars denote a histogram of data divided into 1 sec bins. Red curve is a Poisson curve with rate = median count rate of data. |
 |
 |
| Quadrant-wise count rates Data is divided into 100 sec bins |
 |
|
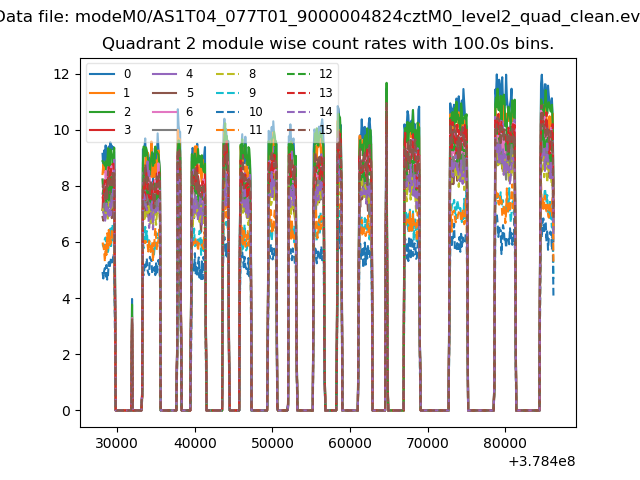
| Module-wise count rates for Quadrant A Data is divided into 100 sec bins |
 |
 |
| Module-wise count rates for Quadrant B Data is divided into 100 sec bins |
 |
 |
| Module-wise count rates for Quadrant C Data is divided into 100 sec bins |
 |
 |
| Module-wise count rates for Quadrant D Data is divided into 100 sec bins |
 |
 |
| Parameter | Plot |
|---|---|
| CZT HV Monitor |  |
| D_VDD | 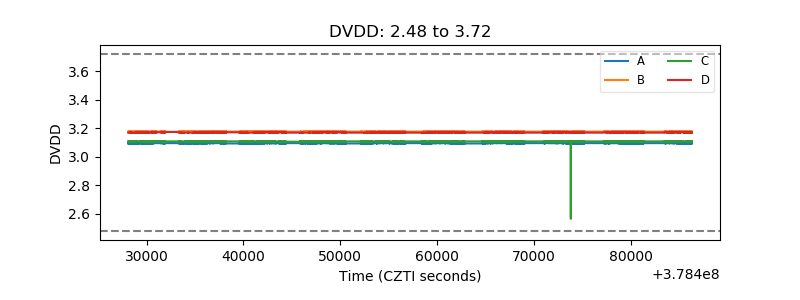 |
| Temperature 1 |  |
| Veto HV Monitor |  |
| Veto LLD | 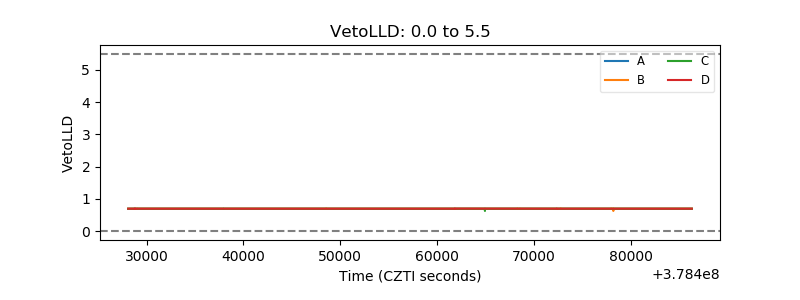 |
| Alpha Counter |  |
| _CPM_Rate | 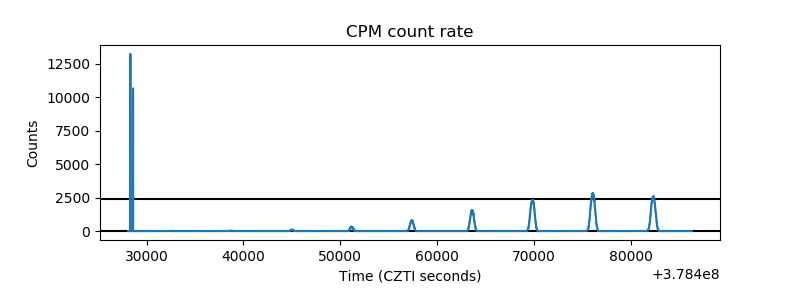 |
| CZT Counter | 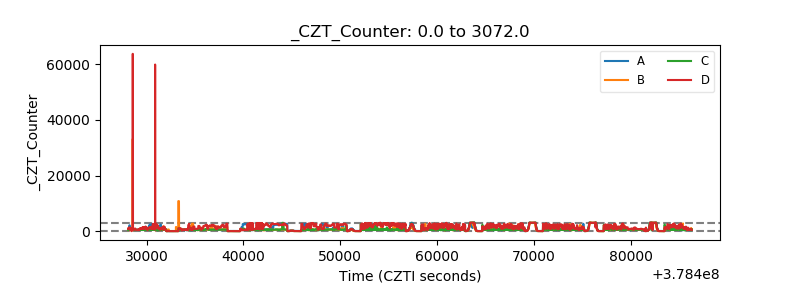 |
| +2.5 Volts monitor | 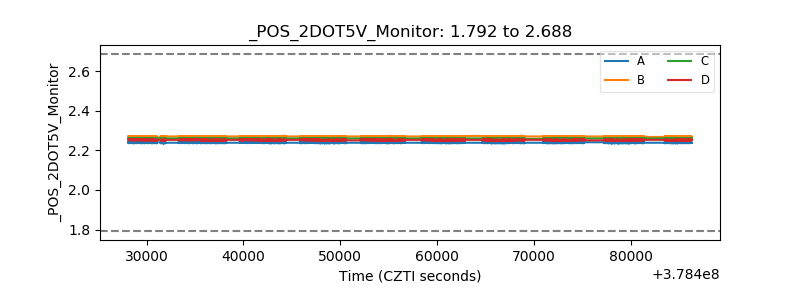 |
| +5 Volts monitor | 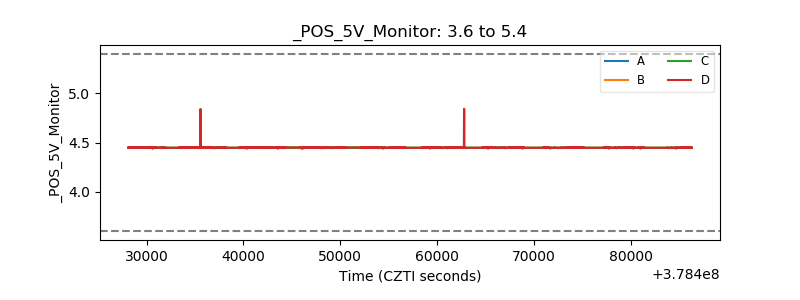 |
| _ROLL_ROT | 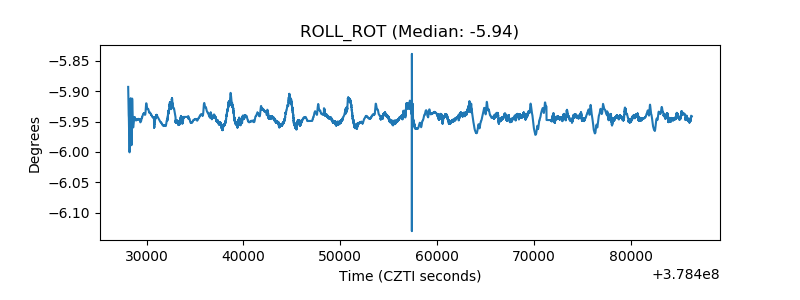 |
| _Roll_DEC | 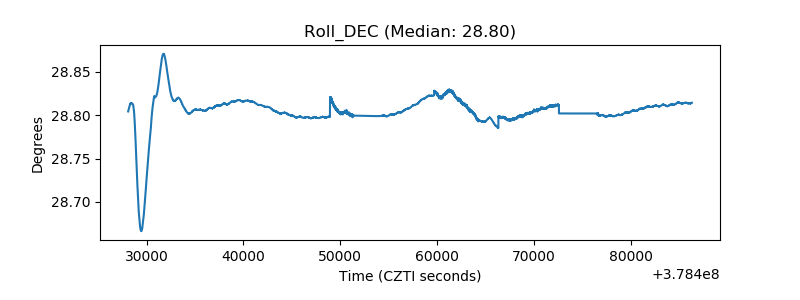 |
| _Roll_RA | 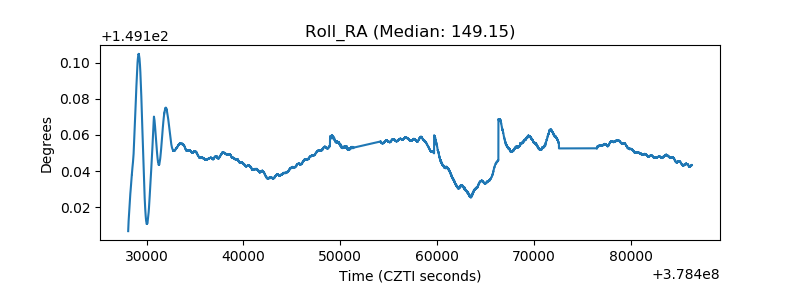 |
| Veto Counter |  |