| Param | Original file | Final file |
|---|---|---|
| Filename | modeM0/AS1T04_077T01_9000004824_33808cztM0_level2.evt | modeM0/AS1T04_077T01_9000004824_33808cztM0_level2_quad_clean.evt |
| Size (bytes) | 2,307,395,520 | 203,762,880 |
| Size | 2.1 GB | 194.3 MB |
| Events in quadrant A | 16,285,630 | 1,130,342 |
| Events in quadrant B | 11,008,300 | 1,342,116 |
| Events in quadrant C | 10,533,243 | 1,332,274 |
| Events in quadrant D | 30,767,380 | 1,045,052 |
| Mode M9 | |||
|---|---|---|---|
| Quadrant | BADHDUFLAG | Total packets | Discarded packets |
| A | 0 | 55 | 0 |
| B | 0 | 55 | 0 |
| C | 0 | 55 | 0 |
| D | 0 | 55 | 0 |
| Mode M0 | |||
|---|---|---|---|
| Quadrant | BADHDUFLAG | Total packets | Discarded packets |
| A | 0 | 60995 | 5 |
| B | 0 | 45136 | 4 |
| C | 0 | 43176 | 4 |
| D | 0 | 104584 | 6 |
| Mode SS | |||
|---|---|---|---|
| Quadrant | BADHDUFLAG | Total packets | Discarded packets |
| A | 0 | 390 | 0 |
| B | 0 | 390 | 0 |
| C | 0 | 390 | 0 |
| D | 0 | 390 | 0 |
| Quadrant | Total seconds | Saturated seconds | Saturation percentage |
|---|---|---|---|
| A | 19140 | 3460 | 18.077325% |
| B | 19140 | 477 | 2.492163% |
| C | 19141 | 131 | 0.684395% |
| D | 19140 | 7281 | 38.040752% |
Noise dominated data is calculated using 1-second bins in cleaned event files. If a bin has >2000 counts, and if more than 50% of those come from <1% of pixels, then it is considered to be noise-dominated and hence unusable.
| Quadrant | # 1 sec bins | Bins with >0 counts | Bins with >2000 counts | High rate bins dominated by noise | Noise dominated (total time) | Noise dominated (detector-on time) | Marked lightcurve |
|---|---|---|---|---|---|---|---|
| A | 25017 | 19145 | 2860 | 2860 | 11.43% | 14.94% | 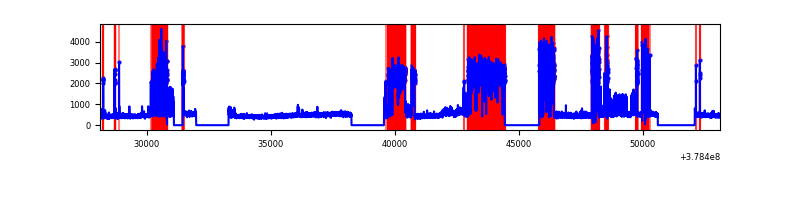 |
| B | 25017 | 19145 | 280 | 280 | 1.12% | 1.46% | 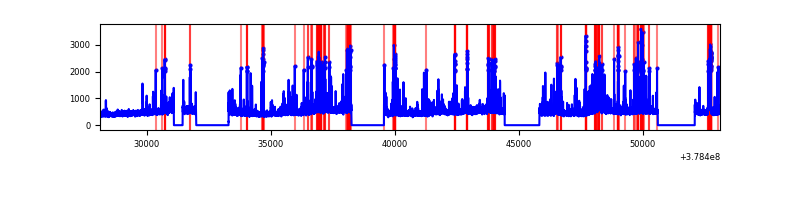 |
| C | 25017 | 19146 | 102 | 102 | 0.41% | 0.53% | 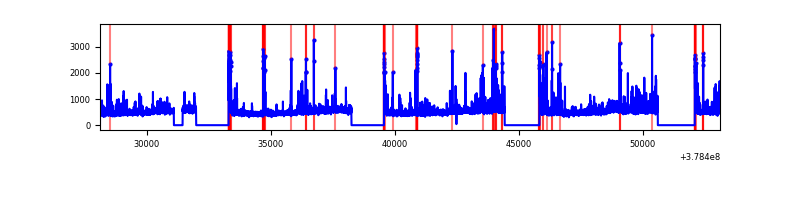 |
| D | 25017 | 19145 | 6838 | 6838 | 27.33% | 35.72% | 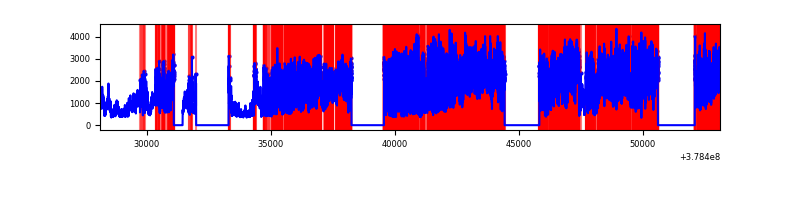 |
Top three noisy pixels from each quadrant. If the there are fewer than three noisy pixels in the level2.evt file, extra rows are filled as -1
| Pixel properties | Quadrant properties | ||||||
|---|---|---|---|---|---|---|---|
| Quadrant | DetID | PixID | Counts | Sigma | Mean | Median | Sigma |
| A | 15 | 169 | 7790985 | 19870.1 | 1980 | 1945 | 392.0 |
| A | 15 | 237 | 766034 | 1949.22 | 1980 | 1945 | 392.0 |
| A | 13 | 6 | 69424 | 172.14 | 1980 | 1945 | 392.0 |
| B | 5 | 172 | 627454 | 1473.92 | 2221 | 2158 | 424.2 |
| B | 5 | 255 | 583168 | 1369.53 | 2221 | 2158 | 424.2 |
| B | 0 | 190 | 230955 | 539.31 | 2221 | 2158 | 424.2 |
| C | 15 | 214 | 605868 | 1208.73 | 2179 | 2194 | 499.4 |
| C | 14 | 254 | 331127 | 658.62 | 2179 | 2194 | 499.4 |
| C | 3 | 233 | 305745 | 607.8 | 2179 | 2194 | 499.4 |
| D | 12 | 235 | 16288460 | 37014.62 | 1828 | 1779 | 440.0 |
| D | 8 | 195 | 4363187 | 9912.14 | 1828 | 1779 | 440.0 |
| D | 2 | 250 | 1697538 | 3853.94 | 1828 | 1779 | 440.0 |
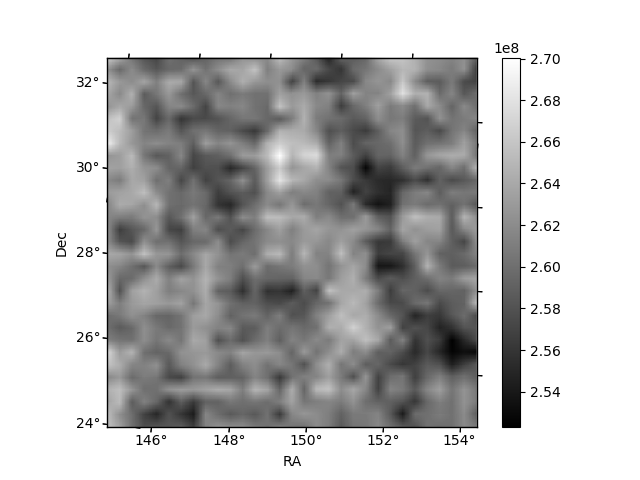
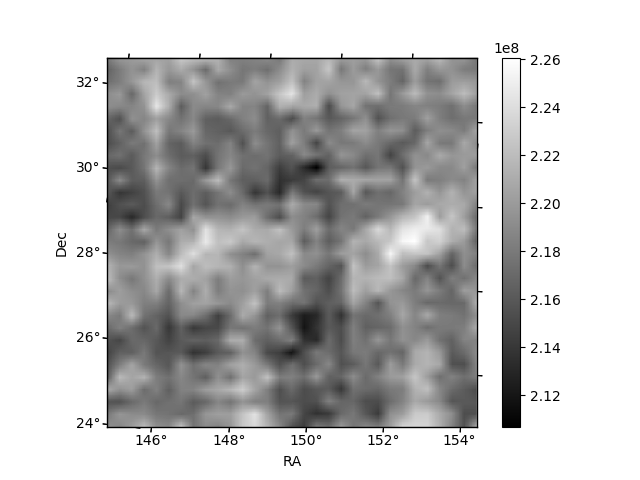
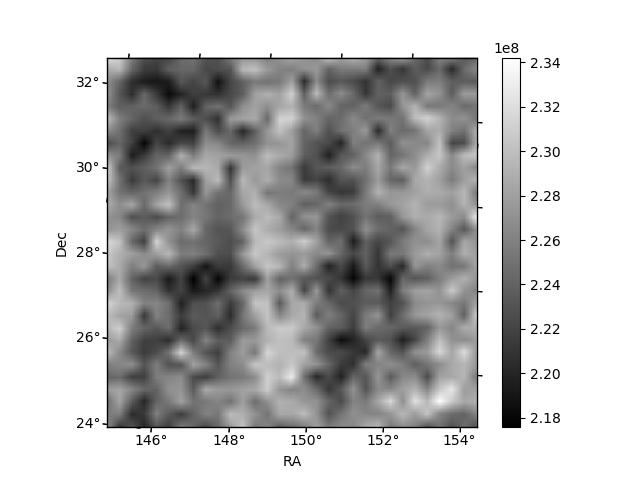
Histogram calculated using DETX and DETY for each event in the final _common_clean file
| Quadrant A | 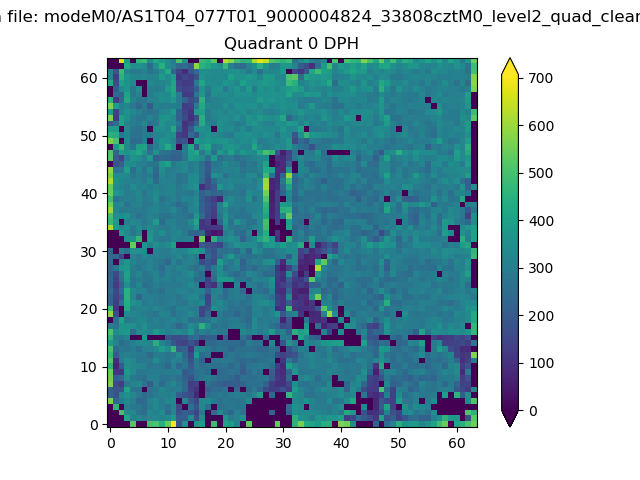 |
 |
Quadrant B |
|---|---|---|---|
| Quadrant D | 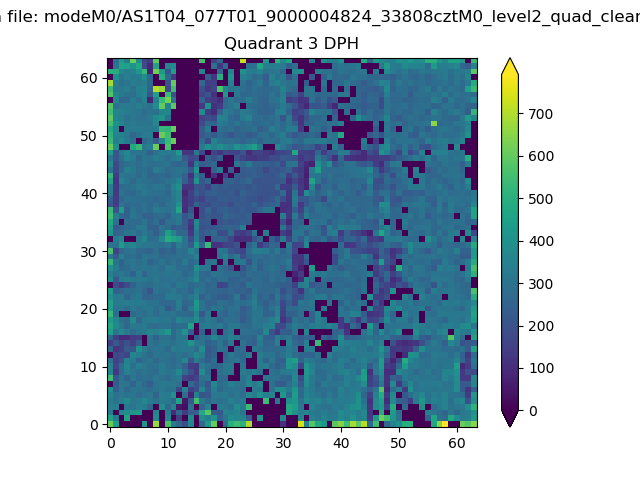 |
 |
Quadrant C |
| Plot type | Count rate plots | Images |
|---|---|---|
| Comparison with Poisson distribution Blue bars denote a histogram of data divided into 1 sec bins. Red curve is a Poisson curve with rate = median count rate of data. |
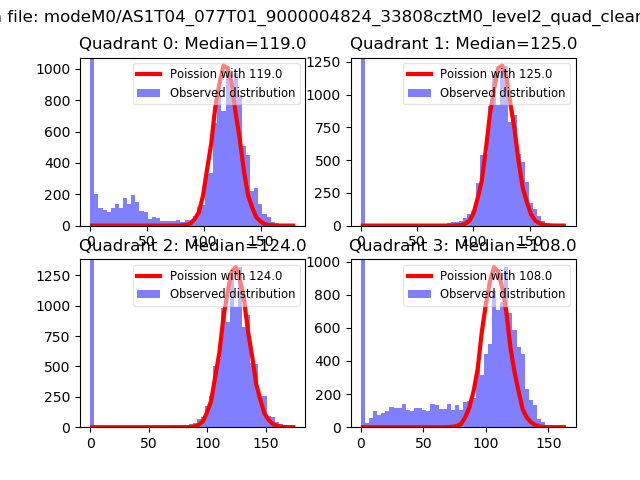 |
 |
| Quadrant-wise count rates Data is divided into 100 sec bins |
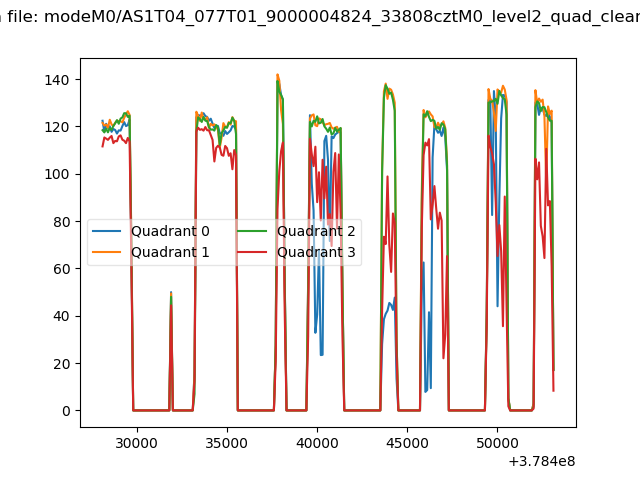 |
|
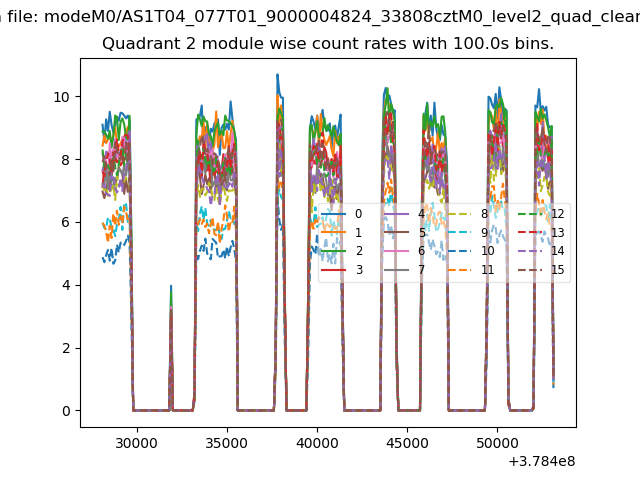
| Module-wise count rates for Quadrant A Data is divided into 100 sec bins |
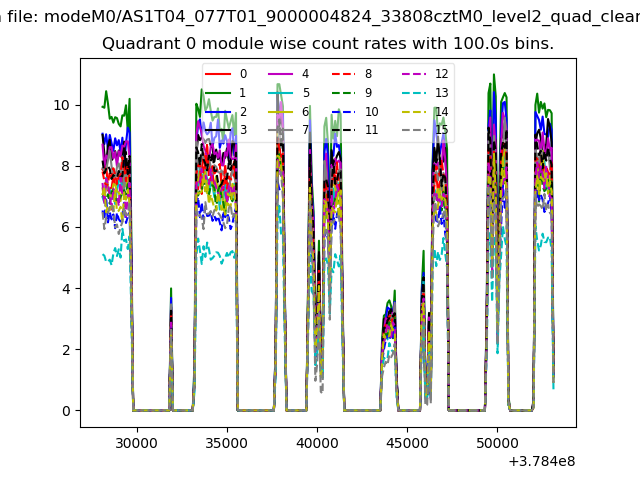 |
 |
| Module-wise count rates for Quadrant B Data is divided into 100 sec bins |
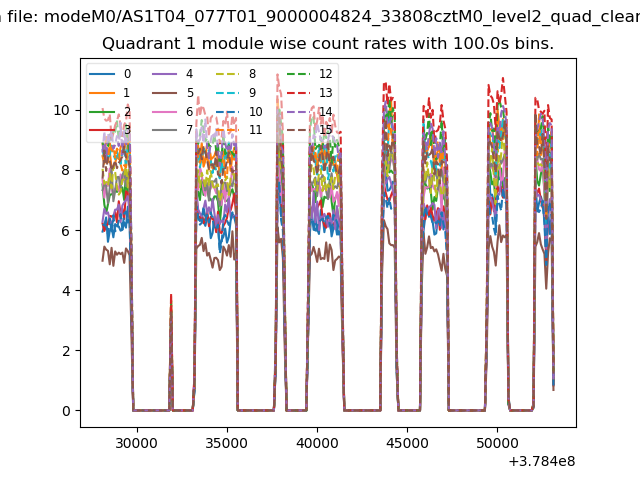 |
 |
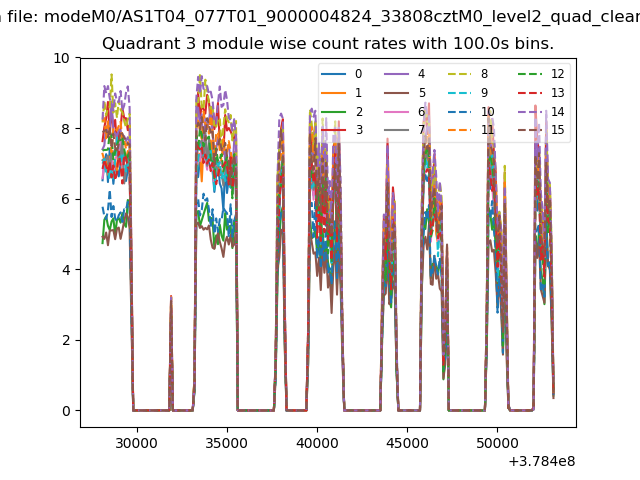
| Module-wise count rates for Quadrant C Data is divided into 100 sec bins |
 |
 |
| Module-wise count rates for Quadrant D Data is divided into 100 sec bins |
 |
 |
| Parameter | Plot |
|---|---|
| CZT HV Monitor | 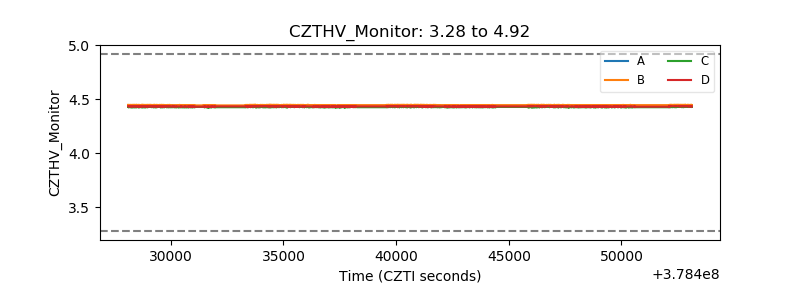 |
| D_VDD | 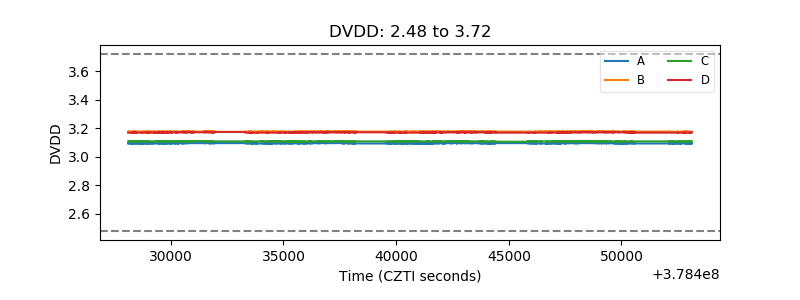 |
| Temperature 1 | 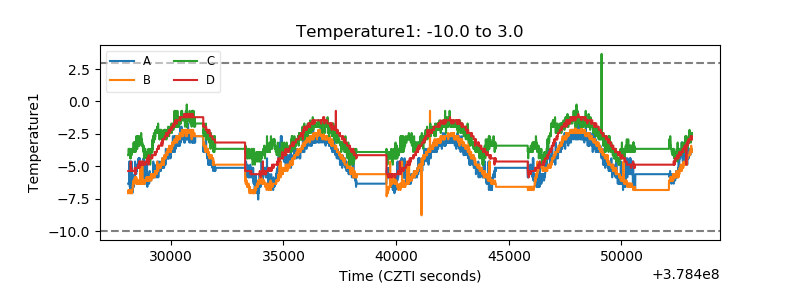 |
| Veto HV Monitor | 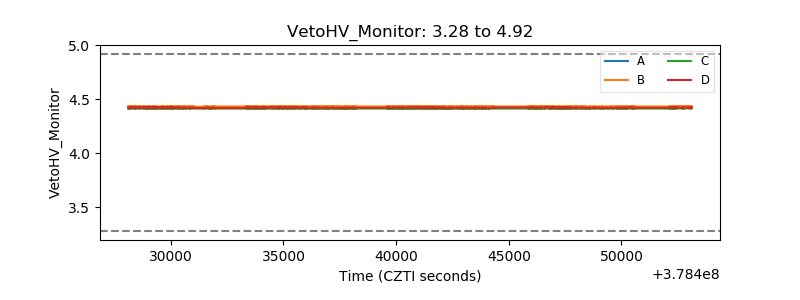 |
| Veto LLD |  |
| Alpha Counter | 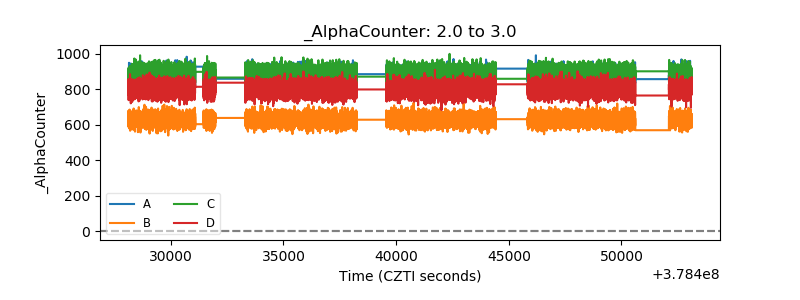 |
| _CPM_Rate | 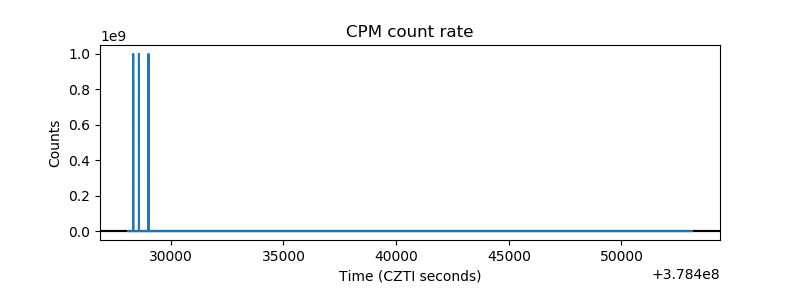 |
| CZT Counter |  |
| +2.5 Volts monitor |  |
| +5 Volts monitor | 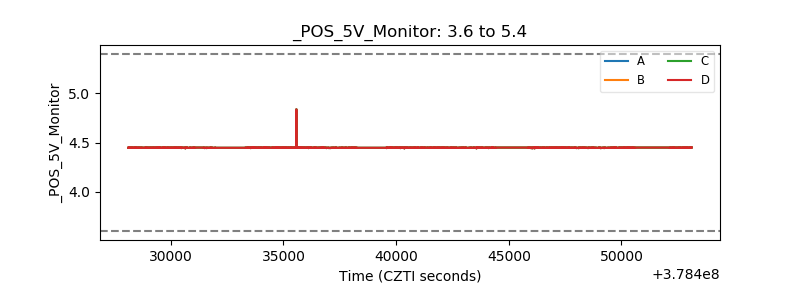 |
| _ROLL_ROT | 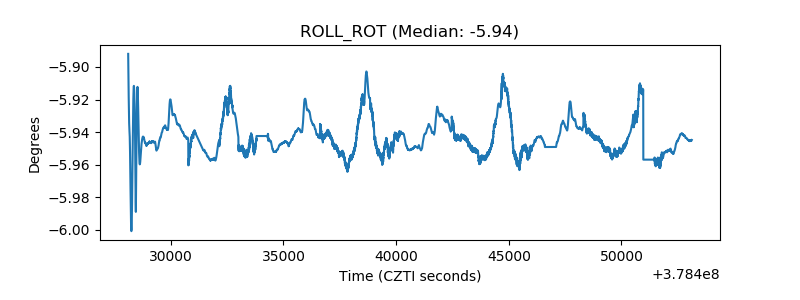 |
| _Roll_DEC | 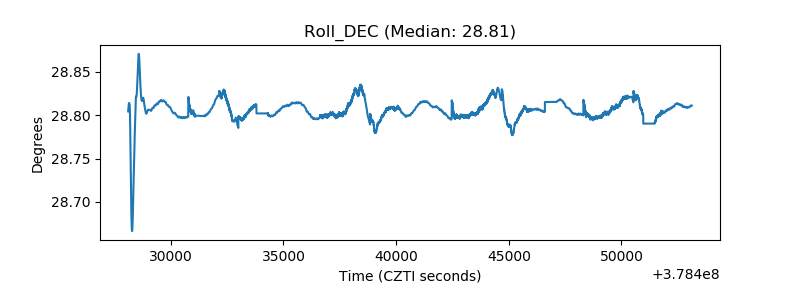 |
| _Roll_RA | 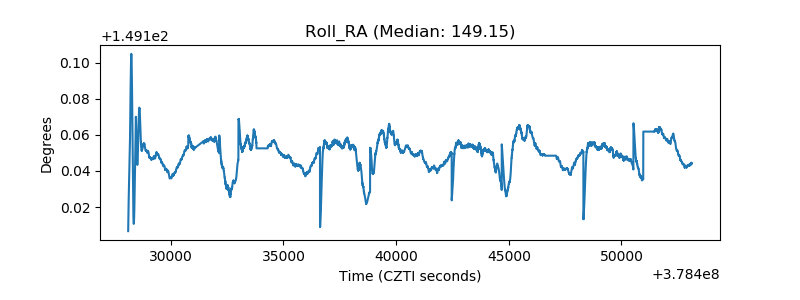 |
| Veto Counter | 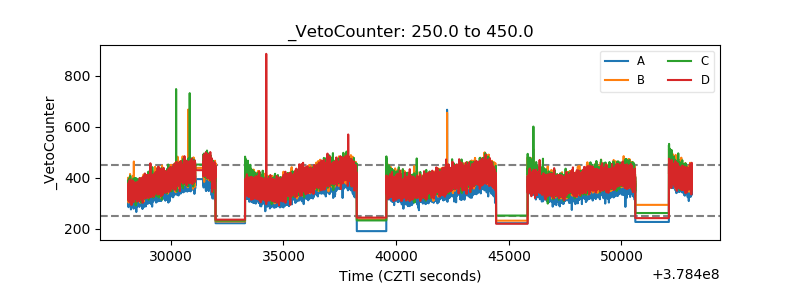 |