| Param | Original file | Final file |
|---|---|---|
| Filename | modeM0/AS1T04_077T01_9000004824_33809cztM0_level2.evt | modeM0/AS1T04_077T01_9000004824_33809cztM0_level2_quad_clean.evt |
| Size (bytes) | 698,973,120 | 61,848,000 |
| Size | 666.6 MB | 59.0 MB |
| Events in quadrant A | 2,750,888 | 400,886 |
| Events in quadrant B | 3,172,015 | 400,352 |
| Events in quadrant C | 3,183,606 | 398,903 |
| Events in quadrant D | 11,687,270 | 284,175 |
| Mode M9 | |||
|---|---|---|---|
| Quadrant | BADHDUFLAG | Total packets | Discarded packets |
| A | 0 | 21 | 0 |
| B | 0 | 21 | 0 |
| C | 0 | 21 | 0 |
| D | 0 | 22 | 0 |
| Mode M0 | |||
|---|---|---|---|
| Quadrant | BADHDUFLAG | Total packets | Discarded packets |
| A | 0 | 11533 | 3 |
| B | 0 | 12767 | 2 |
| C | 0 | 12622 | 2 |
| D | 0 | 38568 | 2 |
| Mode SS | |||
|---|---|---|---|
| Quadrant | BADHDUFLAG | Total packets | Discarded packets |
| A | 0 | 114 | 0 |
| B | 0 | 114 | 0 |
| C | 0 | 114 | 0 |
| D | 0 | 114 | 0 |
| Quadrant | Total seconds | Saturated seconds | Saturation percentage |
|---|---|---|---|
| A | 5532 | 74 | 1.337672% |
| B | 5532 | 126 | 2.277657% |
| C | 5532 | 40 | 0.723066% |
| D | 5532 | 3656 | 66.088214% |
Noise dominated data is calculated using 1-second bins in cleaned event files. If a bin has >2000 counts, and if more than 50% of those come from <1% of pixels, then it is considered to be noise-dominated and hence unusable.
| Quadrant | # 1 sec bins | Bins with >0 counts | Bins with >2000 counts | High rate bins dominated by noise | Noise dominated (total time) | Noise dominated (detector-on time) | Marked lightcurve |
|---|---|---|---|---|---|---|---|
| A | 7175 | 5533 | 48 | 48 | 0.67% | 0.87% | 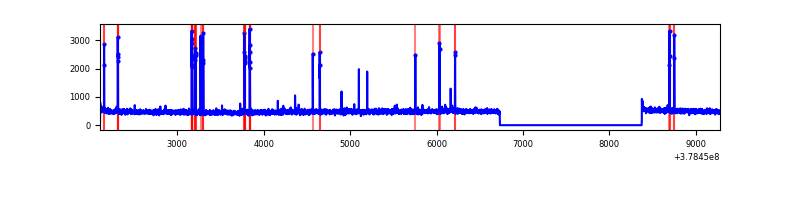 |
| B | 7175 | 5533 | 99 | 99 | 1.38% | 1.79% | 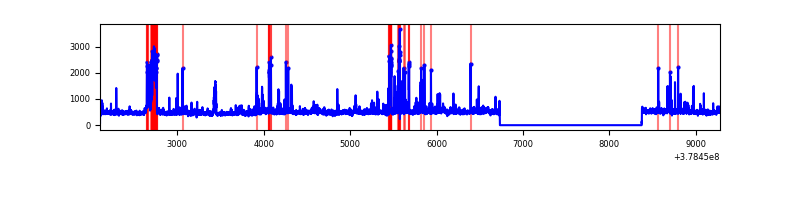 |
| C | 7175 | 5533 | 37 | 37 | 0.52% | 0.67% | 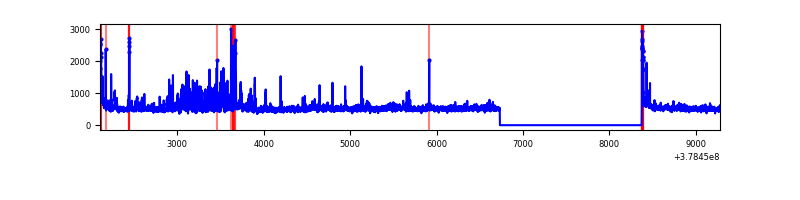 |
| D | 7175 | 5533 | 3600 | 3600 | 50.17% | 65.06% | 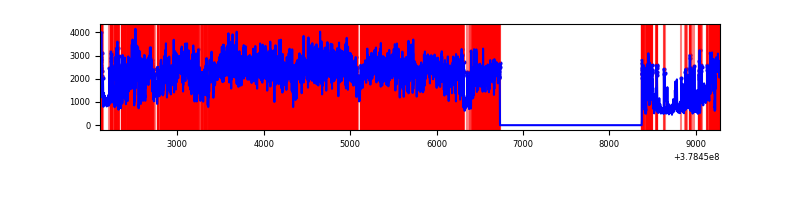 |
Top three noisy pixels from each quadrant. If the there are fewer than three noisy pixels in the level2.evt file, extra rows are filled as -1
| Pixel properties | Quadrant properties | ||||||
|---|---|---|---|---|---|---|---|
| Quadrant | DetID | PixID | Counts | Sigma | Mean | Median | Sigma |
| A | 15 | 169 | 159701 | 1187.49 | 661 | 648 | 133.9 |
| A | 13 | 6 | 27924 | 203.64 | 661 | 648 | 133.9 |
| A | 10 | 83 | 10335 | 72.32 | 661 | 648 | 133.9 |
| B | 5 | 172 | 248949 | 1957.08 | 652 | 635 | 126.9 |
| B | 5 | 200 | 162963 | 1279.38 | 652 | 635 | 126.9 |
| B | 0 | 213 | 41551 | 322.48 | 652 | 635 | 126.9 |
| C | 10 | 49 | 217001 | 1455.19 | 641 | 646 | 148.7 |
| C | 15 | 214 | 179358 | 1202.01 | 641 | 646 | 148.7 |
| C | 14 | 254 | 97720 | 652.91 | 641 | 646 | 148.7 |
| D | 12 | 235 | 8097161 | 72612.64 | 449 | 435 | 111.5 |
| D | 8 | 195 | 979004 | 8775.95 | 449 | 435 | 111.5 |
| D | 2 | 250 | 430544 | 3857.28 | 449 | 435 | 111.5 |
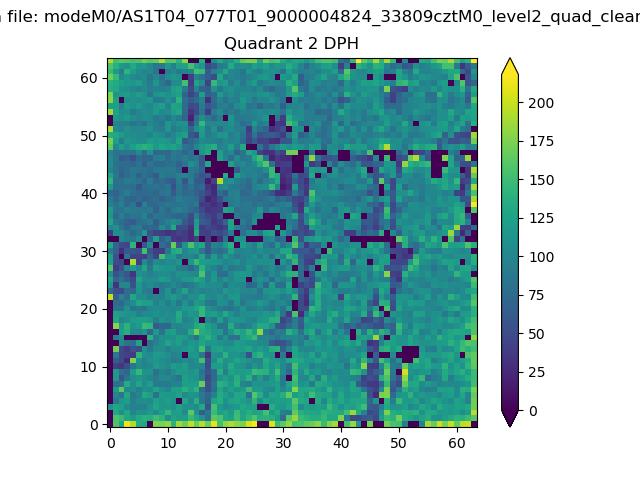
Histogram calculated using DETX and DETY for each event in the final _common_clean file
| Quadrant A |  |
 |
Quadrant B |
|---|---|---|---|
| Quadrant D | 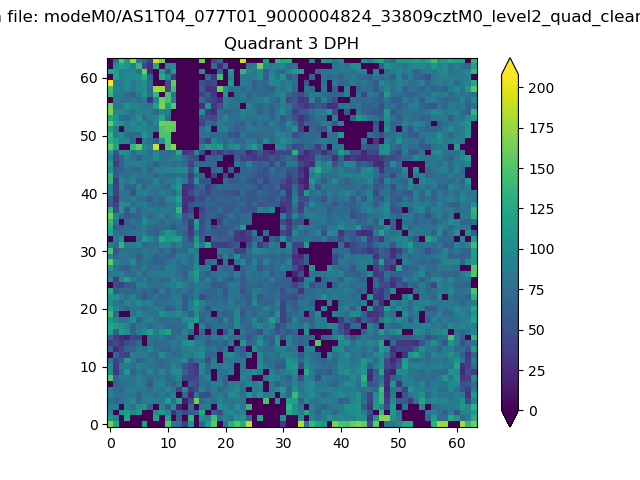 |
 |
Quadrant C |
| Plot type | Count rate plots | Images |
|---|---|---|
| Comparison with Poisson distribution Blue bars denote a histogram of data divided into 1 sec bins. Red curve is a Poisson curve with rate = median count rate of data. |
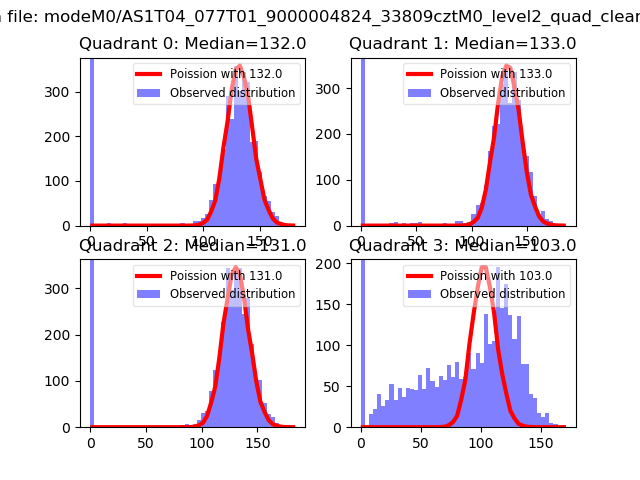 |
 |
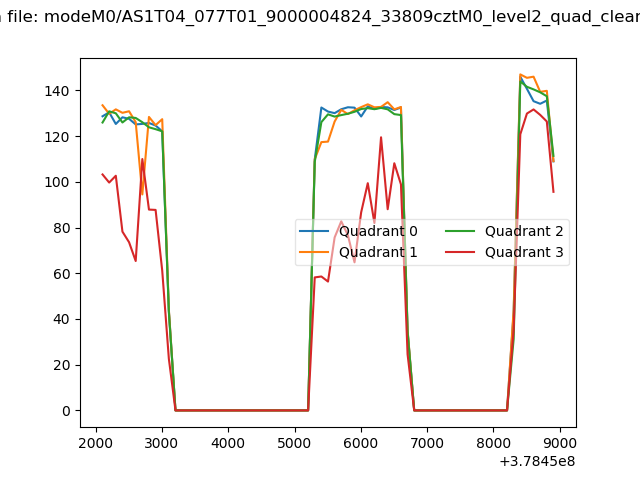
| Quadrant-wise count rates Data is divided into 100 sec bins |
 |
|
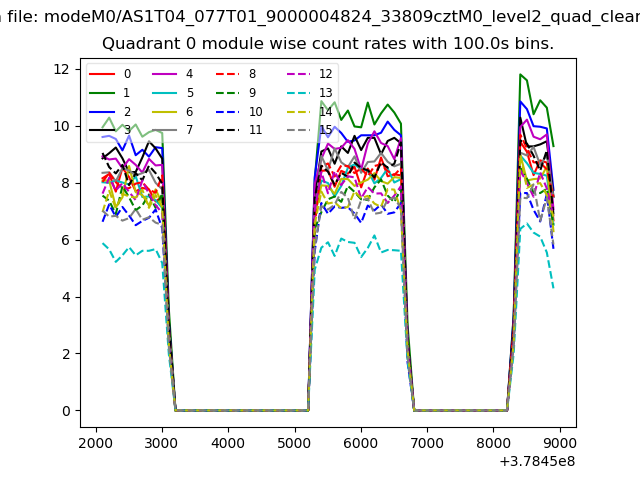
| Module-wise count rates for Quadrant A Data is divided into 100 sec bins |
 |
 |
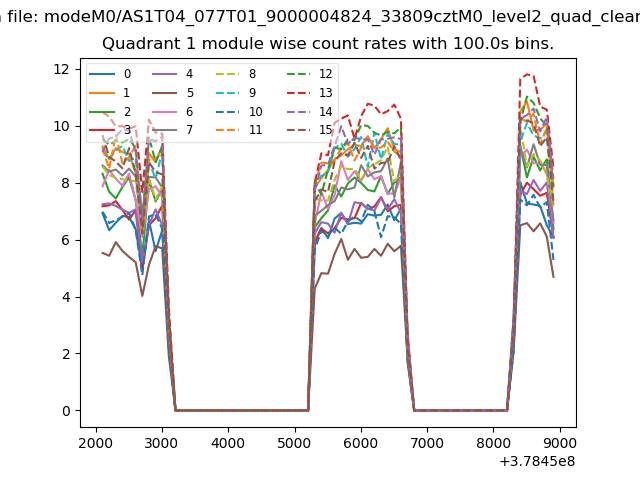
| Module-wise count rates for Quadrant B Data is divided into 100 sec bins |
 |
 |
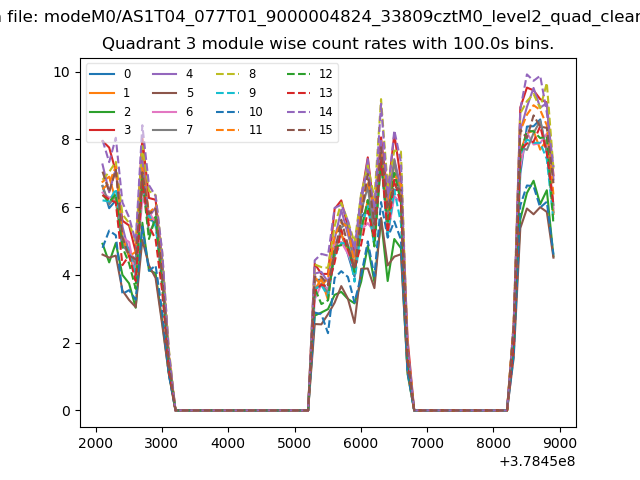
| Module-wise count rates for Quadrant C Data is divided into 100 sec bins |
 |
 |
| Module-wise count rates for Quadrant D Data is divided into 100 sec bins |
 |
 |
| Parameter | Plot |
|---|---|
| CZT HV Monitor | 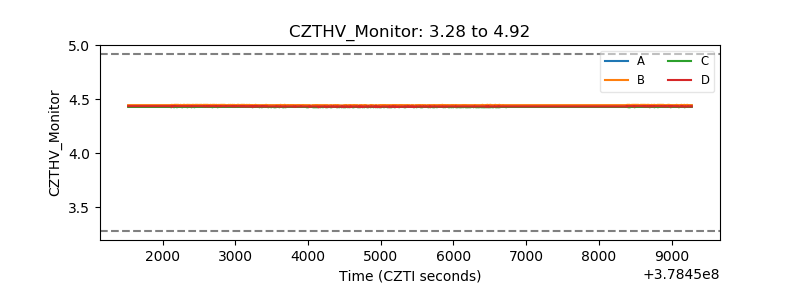 |
| D_VDD | 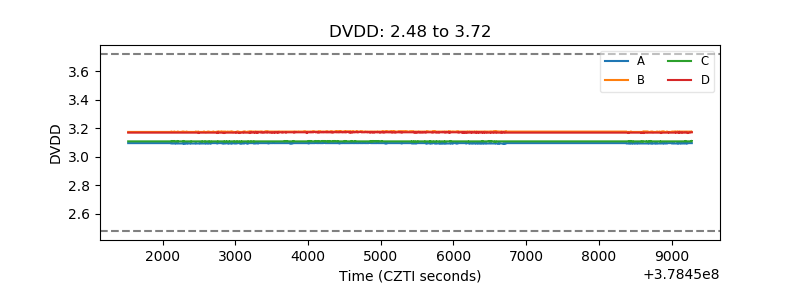 |
| Temperature 1 | 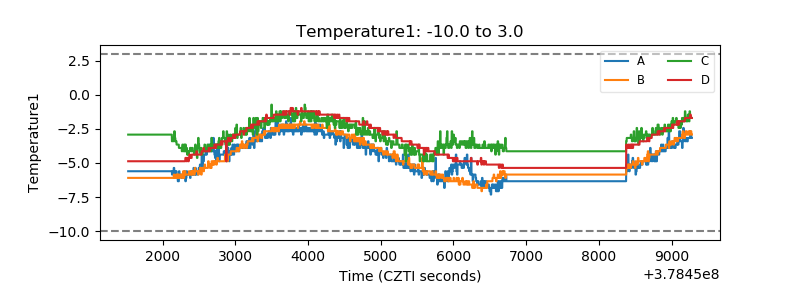 |
| Veto HV Monitor | 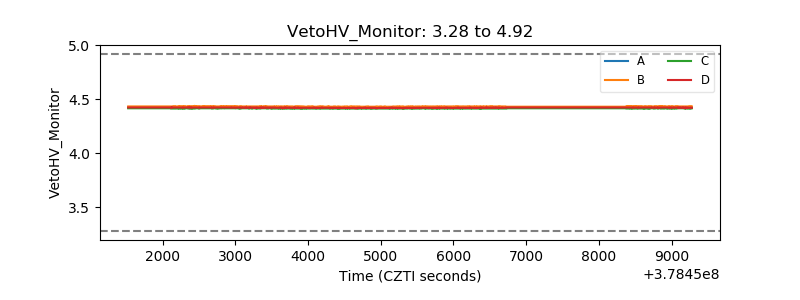 |
| Veto LLD | 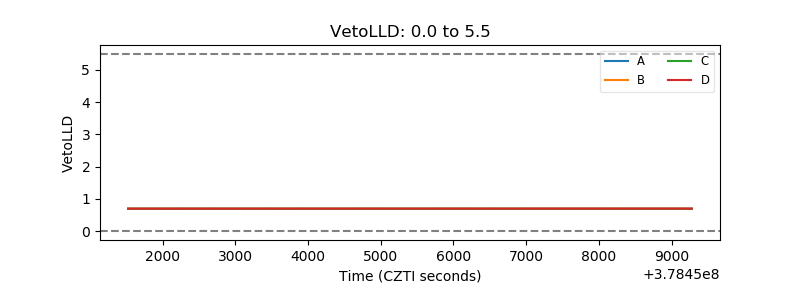 |
| Alpha Counter | 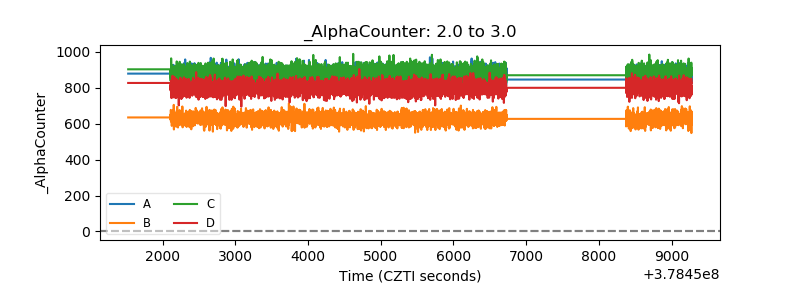 |
| _CPM_Rate | 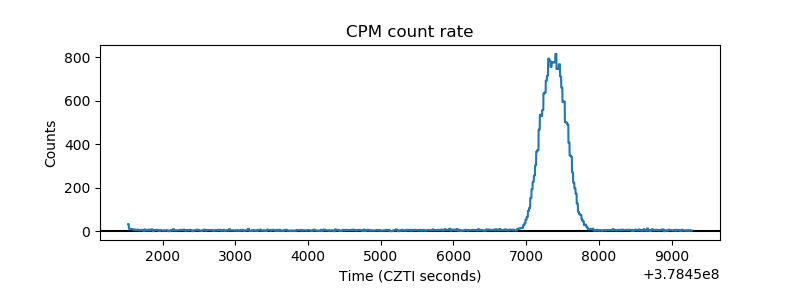 |
| CZT Counter | 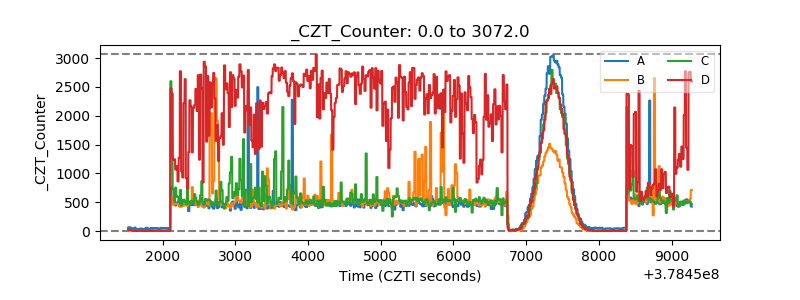 |
| +2.5 Volts monitor |  |
| +5 Volts monitor | 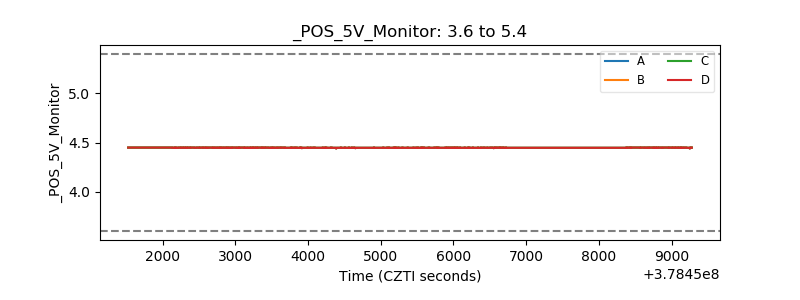 |
| _ROLL_ROT | 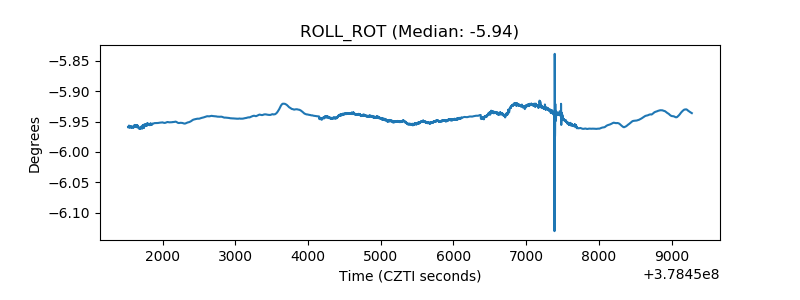 |
| _Roll_DEC | 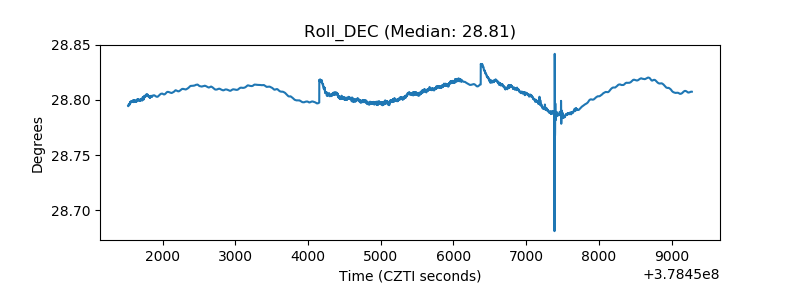 |
| _Roll_RA | 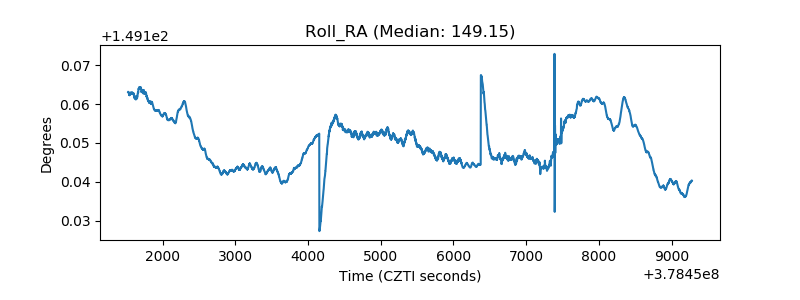 |
| Veto Counter | 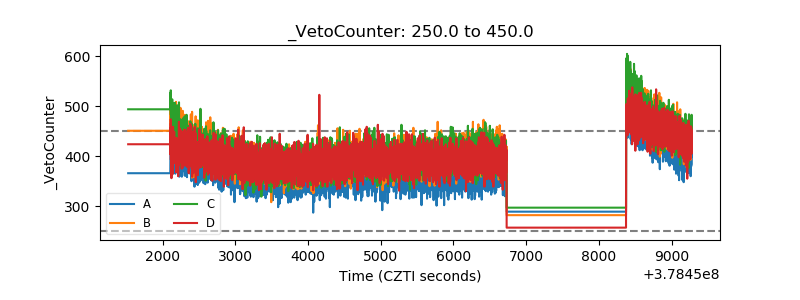 |