| Param | Original file | Final file |
|---|---|---|
| Filename | modeM0/AS1T04_077T01_9000004824_33811cztM0_level2.evt | modeM0/AS1T04_077T01_9000004824_33811cztM0_level2_quad_clean.evt |
| Size (bytes) | 564,857,280 | 56,208,960 |
| Size | 538.7 MB | 53.6 MB |
| Events in quadrant A | 2,611,525 | 344,214 |
| Events in quadrant B | 3,027,496 | 344,608 |
| Events in quadrant C | 2,985,692 | 338,004 |
| Events in quadrant D | 8,123,270 | 303,532 |
| Mode M9 | |||
|---|---|---|---|
| Quadrant | BADHDUFLAG | Total packets | Discarded packets |
| A | 0 | 19 | 0 |
| B | 0 | 19 | 0 |
| C | 0 | 19 | 0 |
| D | 0 | 20 | 0 |
| Mode M0 | |||
|---|---|---|---|
| Quadrant | BADHDUFLAG | Total packets | Discarded packets |
| A | 0 | 10873 | 3 |
| B | 0 | 12115 | 2 |
| C | 0 | 11921 | 2 |
| D | 0 | 27862 | 2 |
| Mode SS | |||
|---|---|---|---|
| Quadrant | BADHDUFLAG | Total packets | Discarded packets |
| A | 0 | 108 | 0 |
| B | 0 | 108 | 0 |
| C | 0 | 108 | 0 |
| D | 0 | 108 | 0 |
| Quadrant | Total seconds | Saturated seconds | Saturation percentage |
|---|---|---|---|
| A | 5301 | 18 | 0.339559% |
| B | 5301 | 64 | 1.207319% |
| C | 5301 | 34 | 0.641388% |
| D | 5301 | 1436 | 27.089228% |
Noise dominated data is calculated using 1-second bins in cleaned event files. If a bin has >2000 counts, and if more than 50% of those come from <1% of pixels, then it is considered to be noise-dominated and hence unusable.
| Quadrant | # 1 sec bins | Bins with >0 counts | Bins with >2000 counts | High rate bins dominated by noise | Noise dominated (total time) | Noise dominated (detector-on time) | Marked lightcurve |
|---|---|---|---|---|---|---|---|
| A | 7064 | 5302 | 8 | 8 | 0.11% | 0.15% | 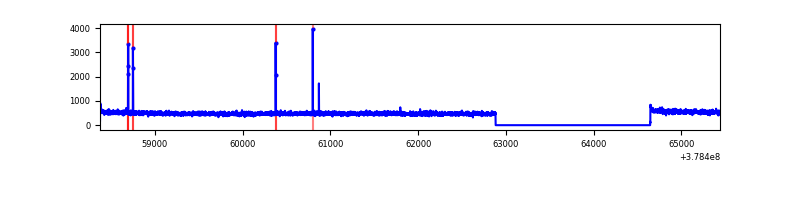 |
| B | 7064 | 5302 | 32 | 32 | 0.45% | 0.60% | 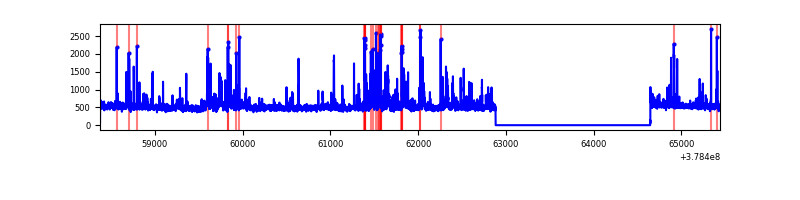 |
| C | 7064 | 5302 | 31 | 31 | 0.44% | 0.58% |  |
| D | 7064 | 5302 | 1474 | 1474 | 20.87% | 27.80% | 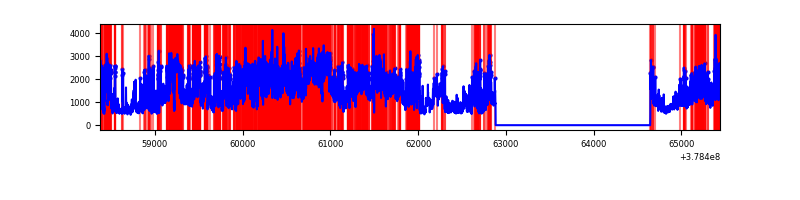 |
Top three noisy pixels from each quadrant. If the there are fewer than three noisy pixels in the level2.evt file, extra rows are filled as -1
| Pixel properties | Quadrant properties | ||||||
|---|---|---|---|---|---|---|---|
| Quadrant | DetID | PixID | Counts | Sigma | Mean | Median | Sigma |
| A | 15 | 169 | 44937 | 336.09 | 657 | 645 | 131.8 |
| A | 13 | 6 | 20531 | 150.89 | 657 | 645 | 131.8 |
| A | 10 | 83 | 10222 | 72.67 | 657 | 645 | 131.8 |
| B | 5 | 172 | 276172 | 2208.72 | 647 | 630 | 124.8 |
| B | 4 | 251 | 60987 | 483.82 | 647 | 630 | 124.8 |
| B | 0 | 190 | 32235 | 253.34 | 647 | 630 | 124.8 |
| C | 15 | 214 | 174298 | 1187.93 | 633 | 639 | 146.2 |
| C | 10 | 49 | 127956 | 870.92 | 633 | 639 | 146.2 |
| C | 0 | 10 | 116688 | 793.84 | 633 | 639 | 146.2 |
| D | 12 | 235 | 3791108 | 26154.72 | 585 | 568 | 144.9 |
| D | 8 | 195 | 1091188 | 7525.27 | 585 | 568 | 144.9 |
| D | 2 | 250 | 384559 | 2649.54 | 585 | 568 | 144.9 |
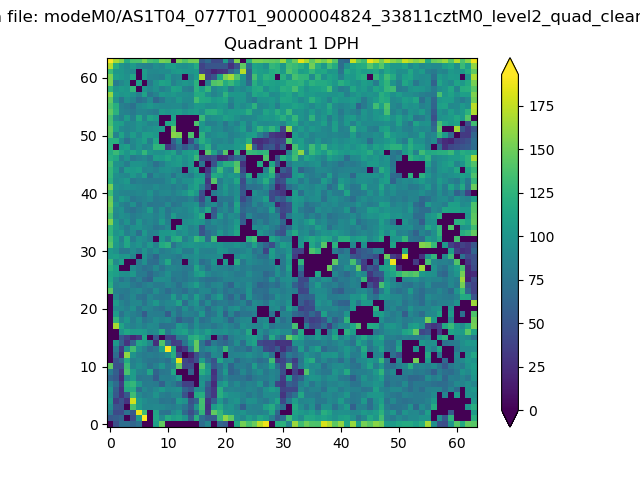
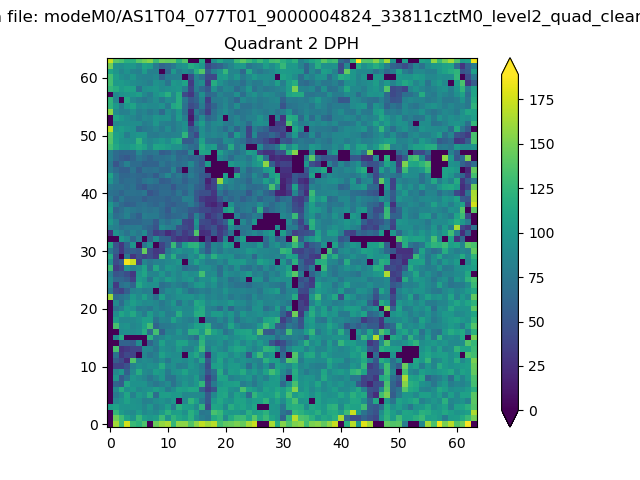
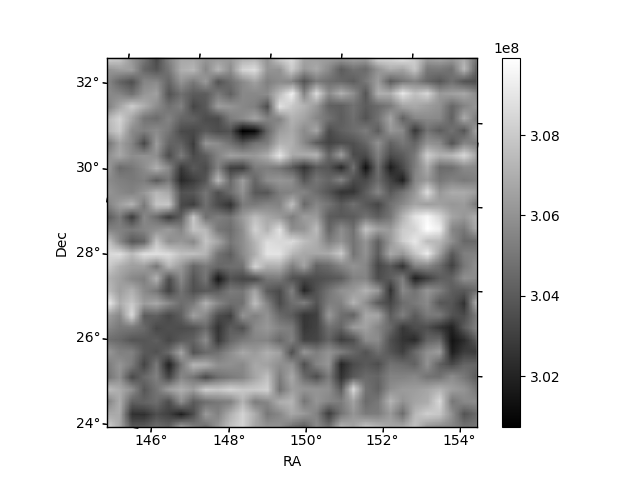
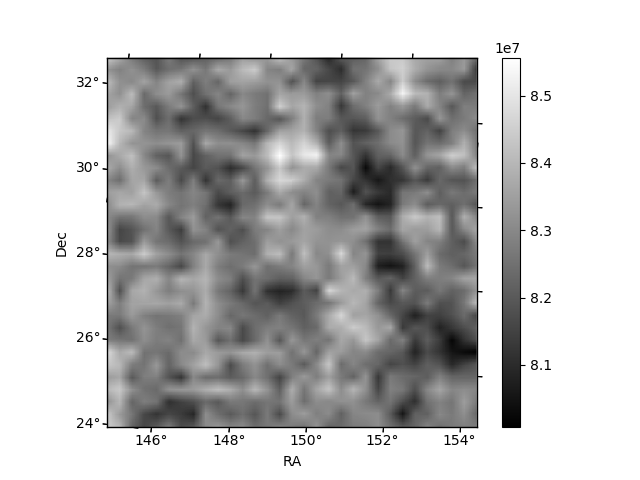
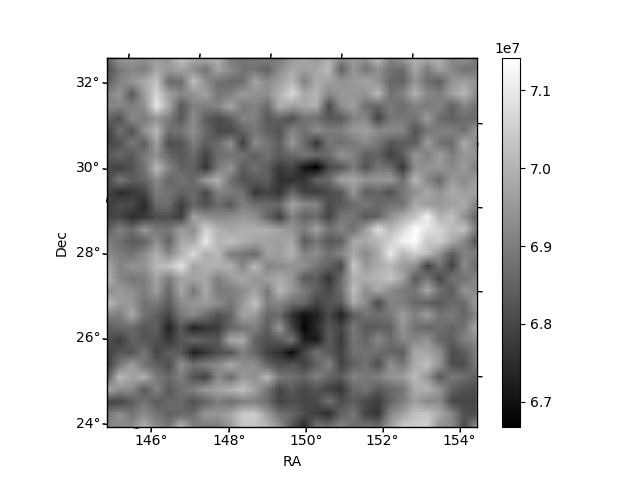
Histogram calculated using DETX and DETY for each event in the final _common_clean file
| Quadrant A | 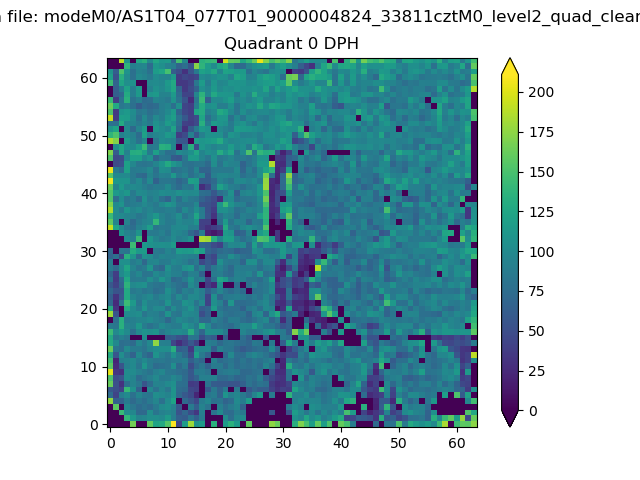 |
 |
Quadrant B |
|---|---|---|---|
| Quadrant D | 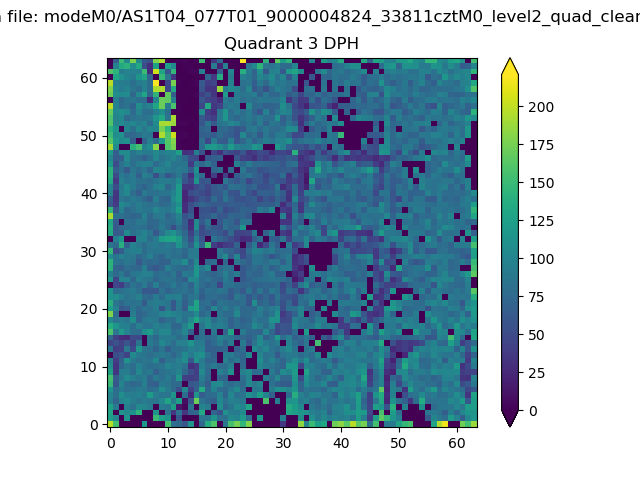 |
 |
Quadrant C |
| Plot type | Count rate plots | Images |
|---|---|---|
| Comparison with Poisson distribution Blue bars denote a histogram of data divided into 1 sec bins. Red curve is a Poisson curve with rate = median count rate of data. |
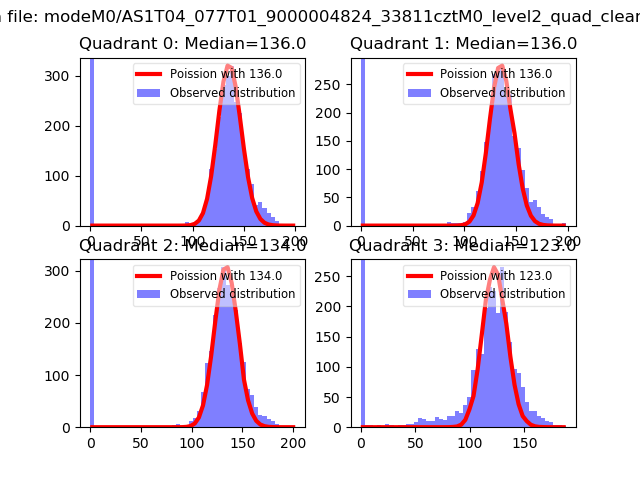 |
 |
| Quadrant-wise count rates Data is divided into 100 sec bins |
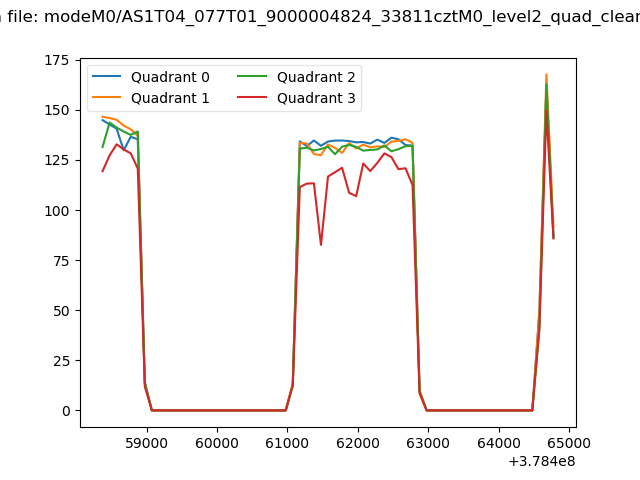 |
|
| Module-wise count rates for Quadrant A Data is divided into 100 sec bins |
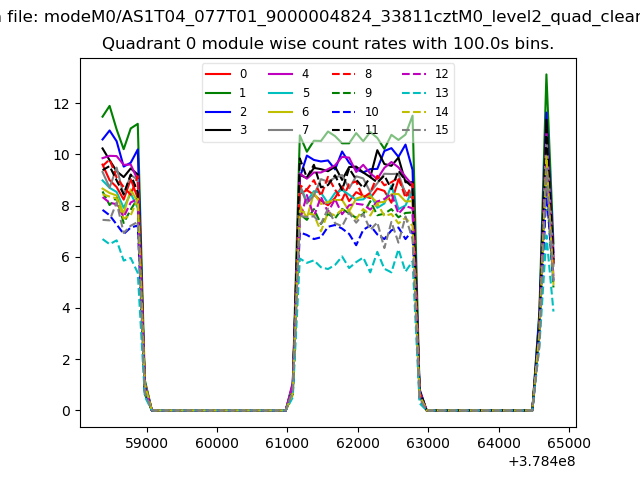 |
 |
| Module-wise count rates for Quadrant B Data is divided into 100 sec bins |
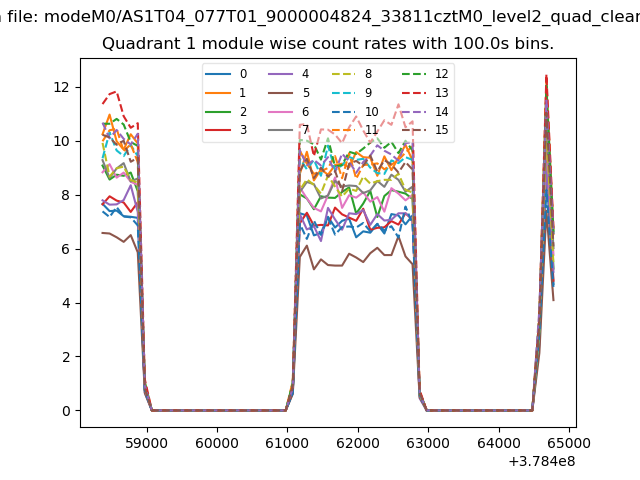 |
 |
| Module-wise count rates for Quadrant C Data is divided into 100 sec bins |
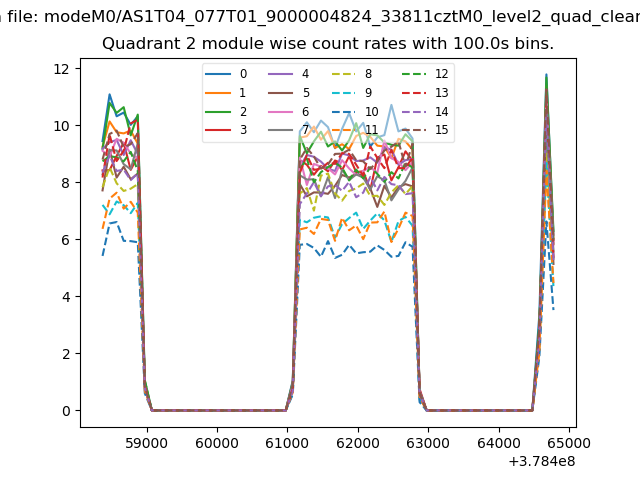 |
 |
| Module-wise count rates for Quadrant D Data is divided into 100 sec bins |
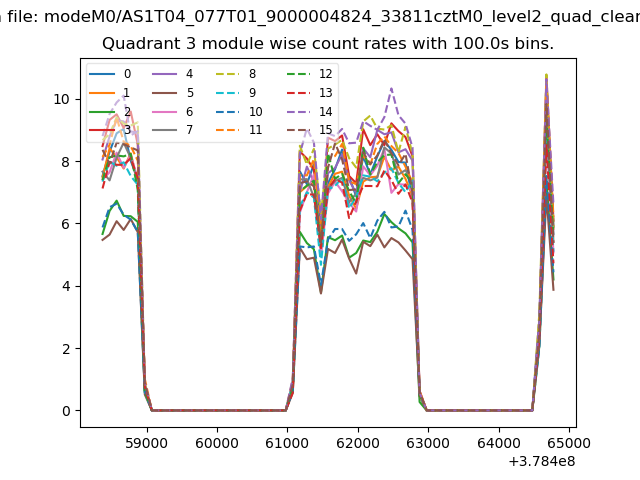 |
 |
| Parameter | Plot |
|---|---|
| CZT HV Monitor | 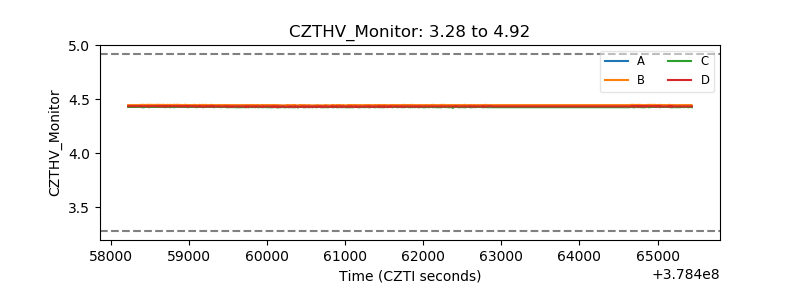 |
| D_VDD | 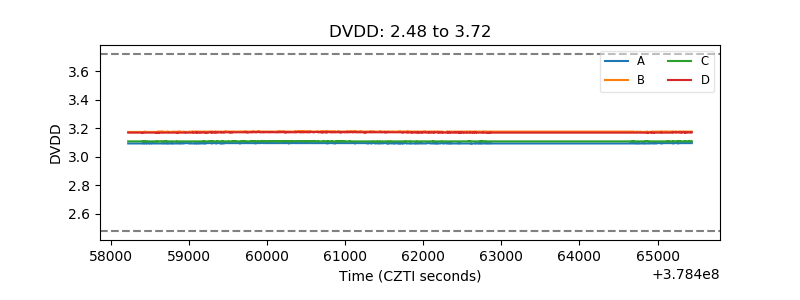 |
| Temperature 1 |  |
| Veto HV Monitor |  |
| Veto LLD | 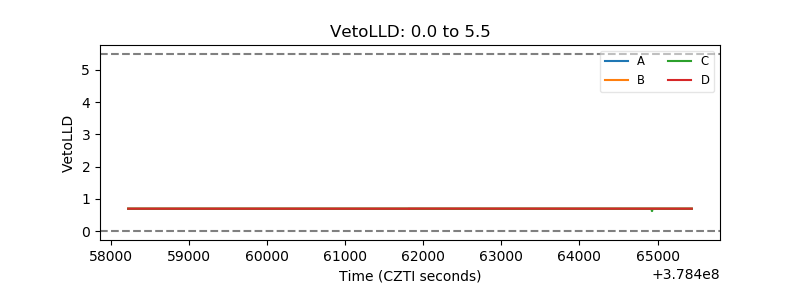 |
| Alpha Counter | 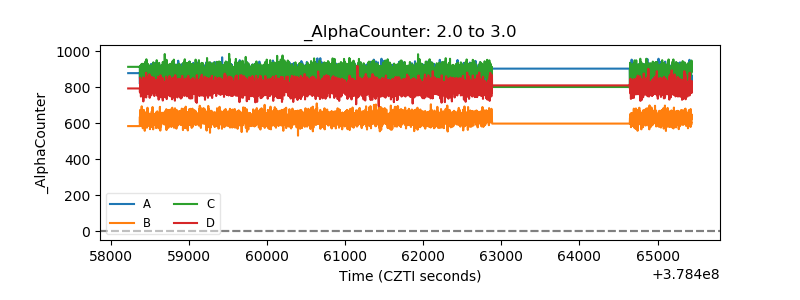 |
| _CPM_Rate | 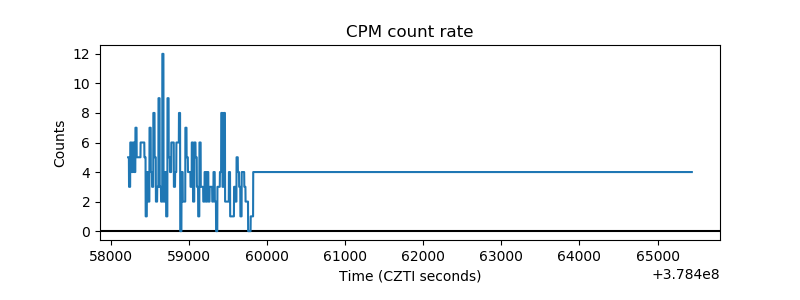 |
| CZT Counter | 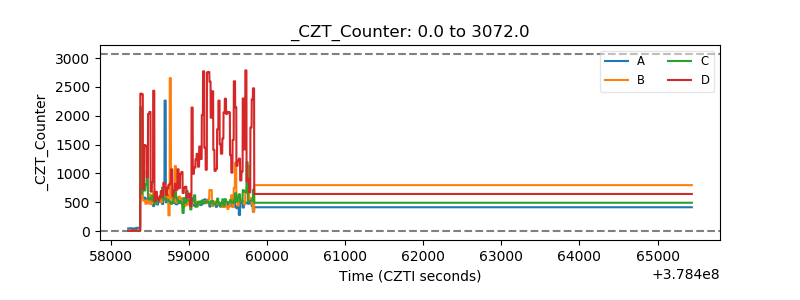 |
| +2.5 Volts monitor |  |
| +5 Volts monitor | 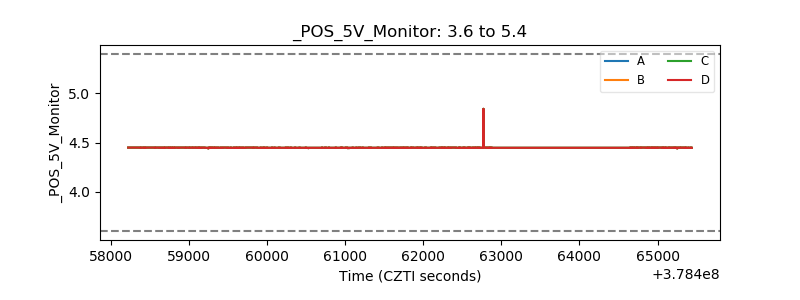 |
| _ROLL_ROT | 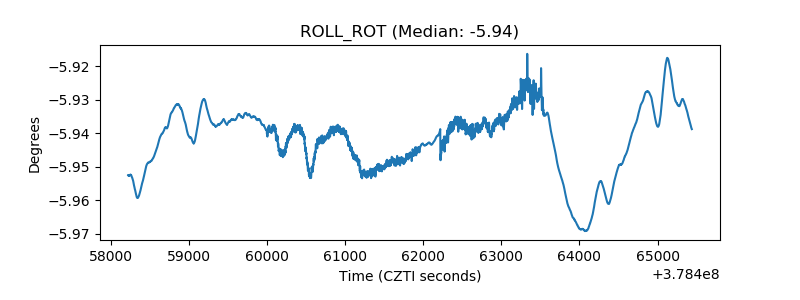 |
| _Roll_DEC | 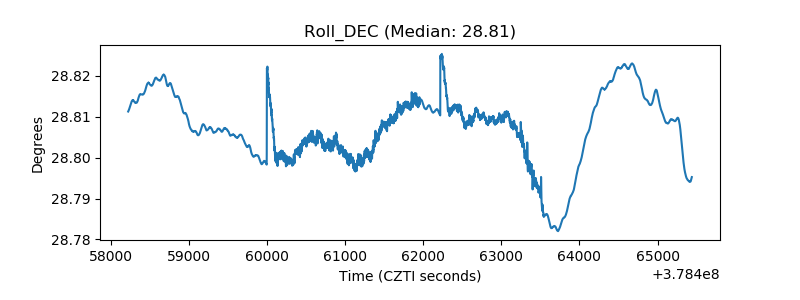 |
| _Roll_RA | 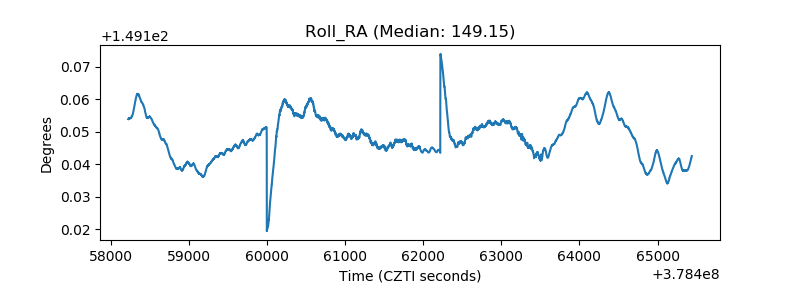 |
| Veto Counter | 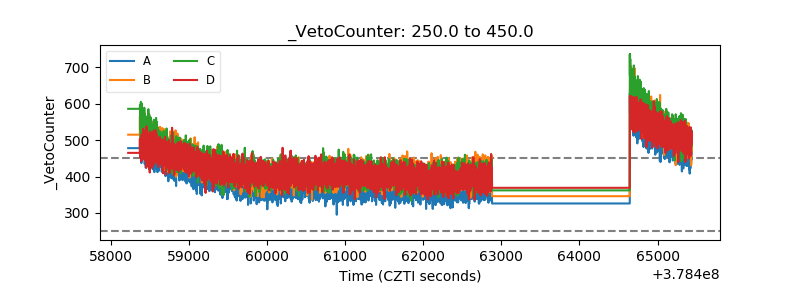 |