| Param | Original file | Final file |
|---|---|---|
| Filename | modeM0/AS1T04_077T01_9000004824_33812cztM0_level2.evt | modeM0/AS1T04_077T01_9000004824_33812cztM0_level2_quad_clean.evt |
| Size (bytes) | 641,805,120 | 51,373,440 |
| Size | 612.1 MB | 49.0 MB |
| Events in quadrant A | 2,917,343 | 310,170 |
| Events in quadrant B | 3,749,483 | 299,313 |
| Events in quadrant C | 3,358,988 | 301,924 |
| Events in quadrant D | 9,041,936 | 260,447 |
| Mode M9 | |||
|---|---|---|---|
| Quadrant | BADHDUFLAG | Total packets | Discarded packets |
| A | 0 | 24 | 0 |
| B | 0 | 24 | 0 |
| C | 0 | 24 | 0 |
| D | 0 | 25 | 0 |
| Mode M0 | |||
|---|---|---|---|
| Quadrant | BADHDUFLAG | Total packets | Discarded packets |
| A | 0 | 11933 | 3 |
| B | 0 | 14529 | 2 |
| C | 0 | 13322 | 2 |
| D | 0 | 30690 | 2 |
| Mode SS | |||
|---|---|---|---|
| Quadrant | BADHDUFLAG | Total packets | Discarded packets |
| A | 0 | 112 | 0 |
| B | 0 | 112 | 0 |
| C | 0 | 112 | 0 |
| D | 0 | 112 | 0 |
| Quadrant | Total seconds | Saturated seconds | Saturation percentage |
|---|---|---|---|
| A | 5469 | 27 | 0.493692% |
| B | 5469 | 248 | 4.534650% |
| C | 5469 | 88 | 1.609069% |
| D | 5469 | 1622 | 29.658073% |
Noise dominated data is calculated using 1-second bins in cleaned event files. If a bin has >2000 counts, and if more than 50% of those come from <1% of pixels, then it is considered to be noise-dominated and hence unusable.
| Quadrant | # 1 sec bins | Bins with >0 counts | Bins with >2000 counts | High rate bins dominated by noise | Noise dominated (total time) | Noise dominated (detector-on time) | Marked lightcurve |
|---|---|---|---|---|---|---|---|
| A | 7352 | 5470 | 14 | 14 | 0.19% | 0.26% | 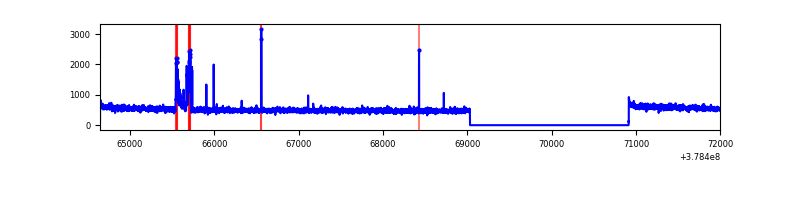 |
| B | 7352 | 5470 | 170 | 170 | 2.31% | 3.11% | 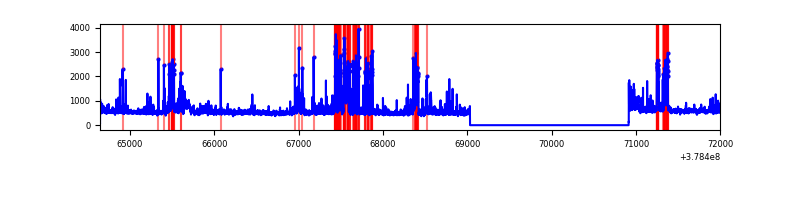 |
| C | 7352 | 5470 | 76 | 76 | 1.03% | 1.39% |  |
| D | 7352 | 5470 | 1638 | 1638 | 22.28% | 29.95% | 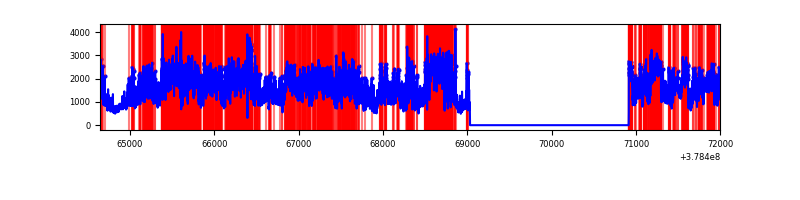 |
Top three noisy pixels from each quadrant. If the there are fewer than three noisy pixels in the level2.evt file, extra rows are filled as -1
| Pixel properties | Quadrant properties | ||||||
|---|---|---|---|---|---|---|---|
| Quadrant | DetID | PixID | Counts | Sigma | Mean | Median | Sigma |
| A | 15 | 169 | 137725 | 966.3 | 712 | 701 | 141.8 |
| A | 13 | 6 | 23121 | 158.11 | 712 | 701 | 141.8 |
| A | 10 | 83 | 10701 | 70.52 | 712 | 701 | 141.8 |
| B | 5 | 172 | 757841 | 5816.83 | 690 | 674 | 130.2 |
| B | 0 | 219 | 52700 | 399.68 | 690 | 674 | 130.2 |
| B | 4 | 81 | 50941 | 386.17 | 690 | 674 | 130.2 |
| C | 15 | 214 | 178952 | 1129.0 | 687 | 694 | 157.9 |
| C | 0 | 10 | 173920 | 1097.13 | 687 | 694 | 157.9 |
| C | 14 | 254 | 129717 | 817.17 | 687 | 694 | 157.9 |
| D | 12 | 235 | 3868816 | 25124.01 | 634 | 617 | 154.0 |
| D | 8 | 195 | 1217058 | 7900.8 | 634 | 617 | 154.0 |
| D | 13 | 249 | 569310 | 3693.67 | 634 | 617 | 154.0 |
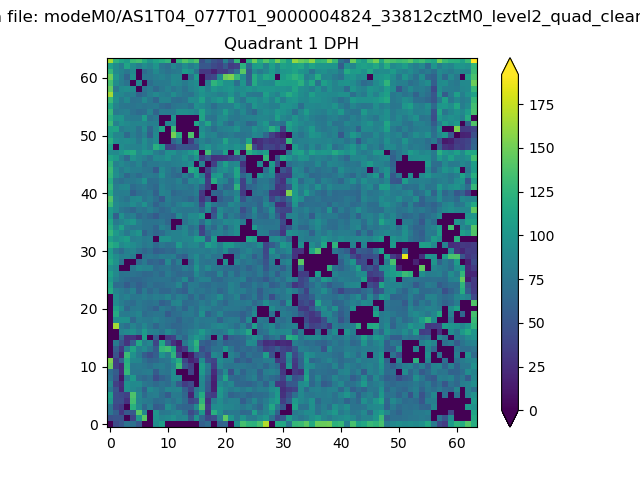
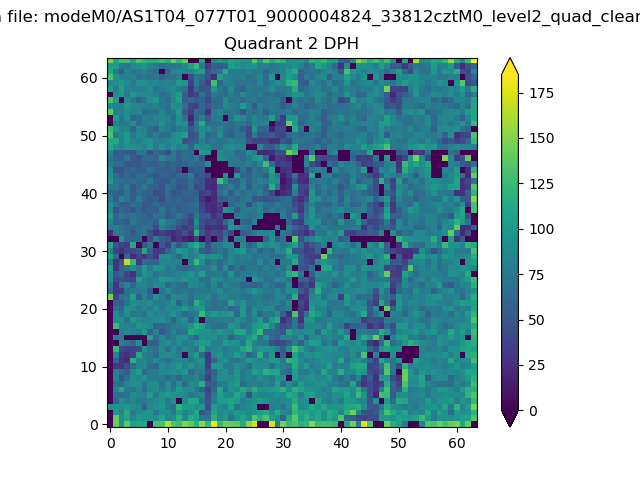
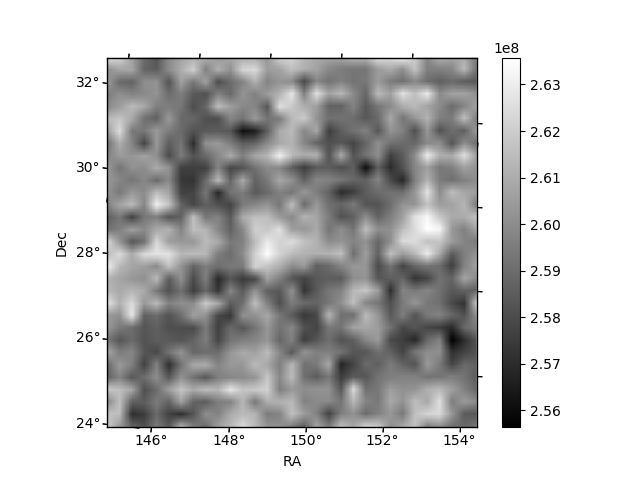
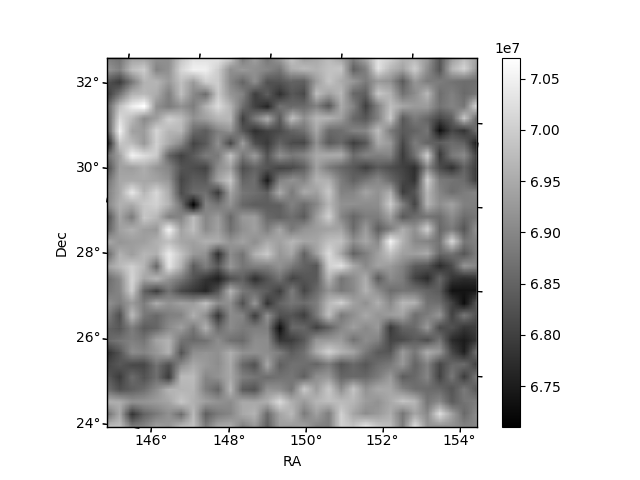
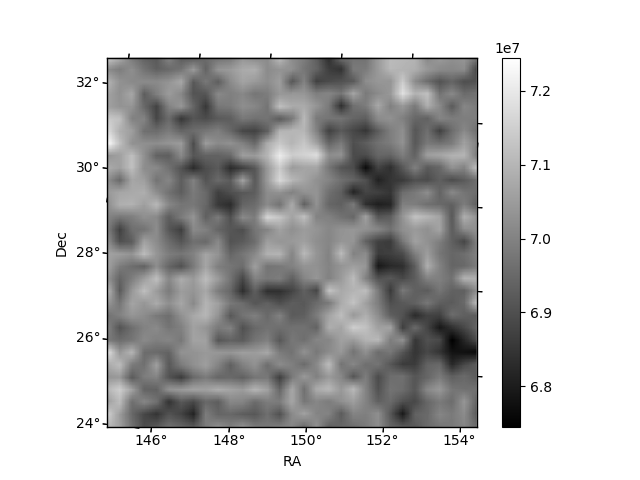
Histogram calculated using DETX and DETY for each event in the final _common_clean file
| Quadrant A | 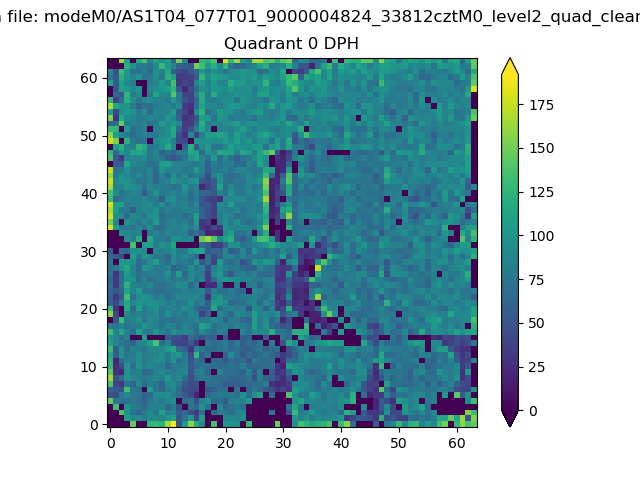 |
 |
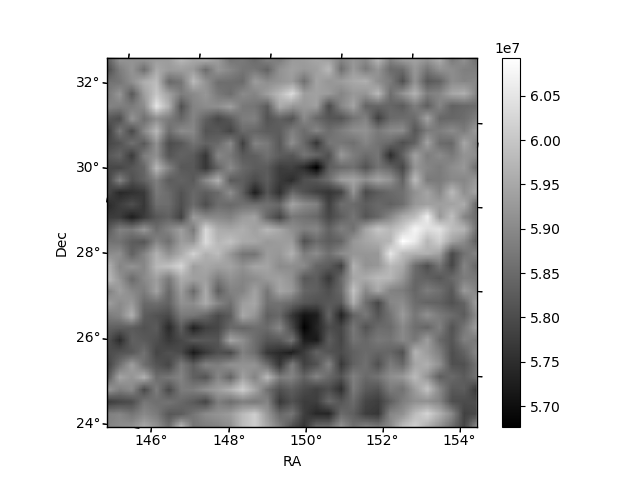
Quadrant B |
|---|---|---|---|
| Quadrant D | 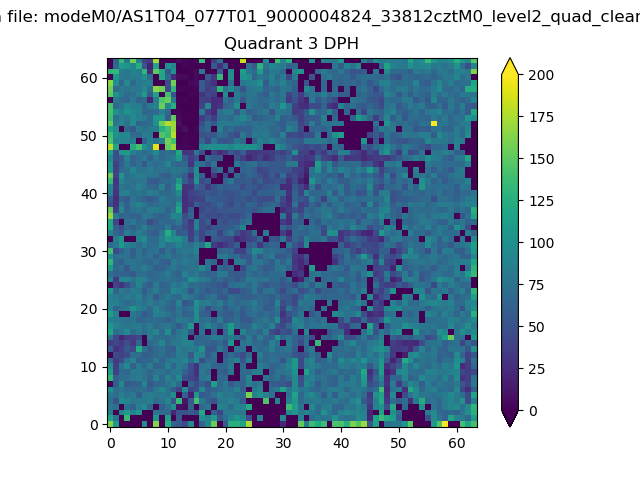 |
 |
Quadrant C |
| Plot type | Count rate plots | Images |
|---|---|---|
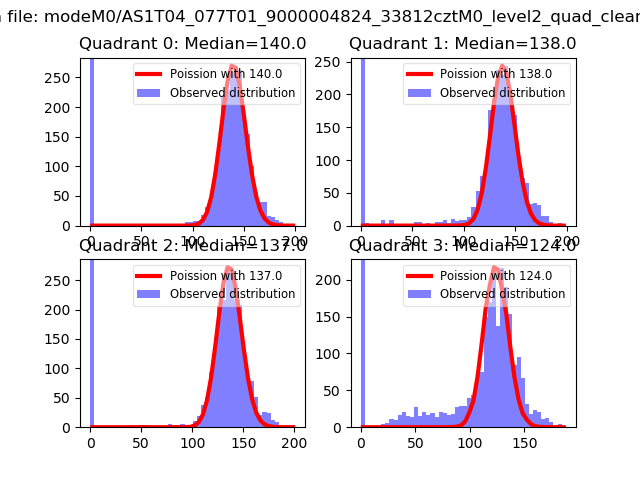
| Comparison with Poisson distribution Blue bars denote a histogram of data divided into 1 sec bins. Red curve is a Poisson curve with rate = median count rate of data. |
 |
 |
| Quadrant-wise count rates Data is divided into 100 sec bins |
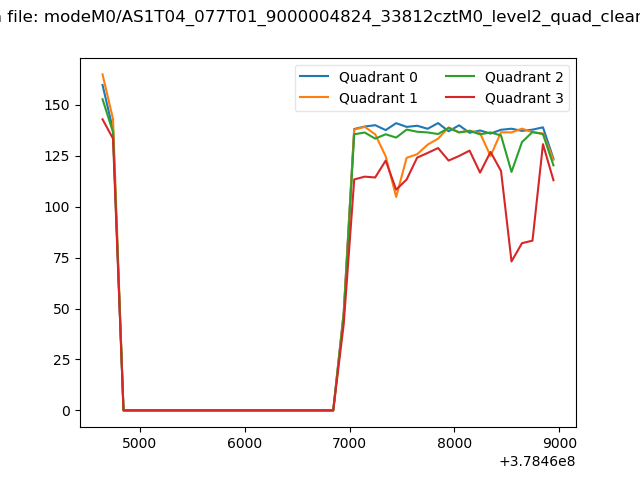 |
|
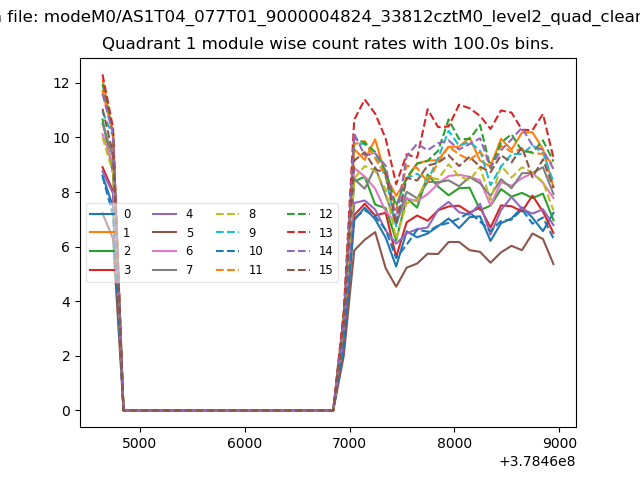
| Module-wise count rates for Quadrant A Data is divided into 100 sec bins |
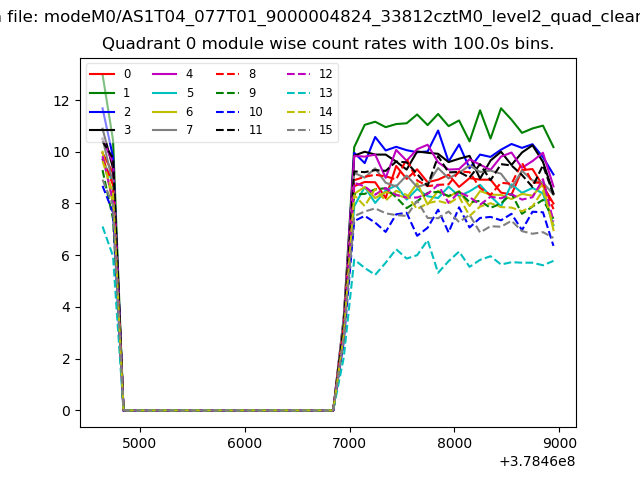 |
 |
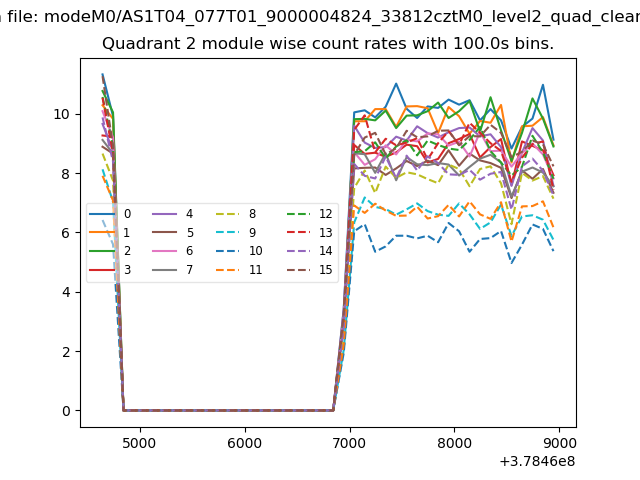
| Module-wise count rates for Quadrant B Data is divided into 100 sec bins |
 |
 |
| Module-wise count rates for Quadrant C Data is divided into 100 sec bins |
 |
 |
| Module-wise count rates for Quadrant D Data is divided into 100 sec bins |
 |
 |
| Parameter | Plot |
|---|---|
| CZT HV Monitor | 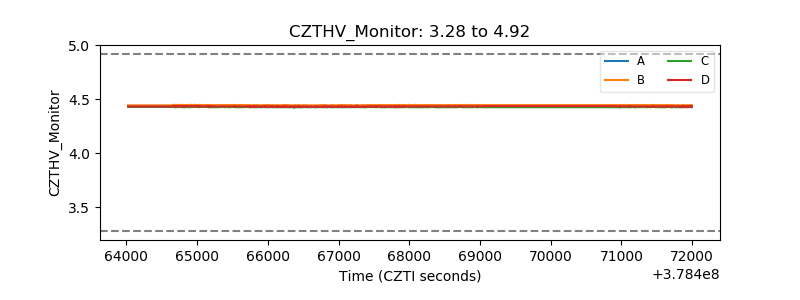 |
| D_VDD | 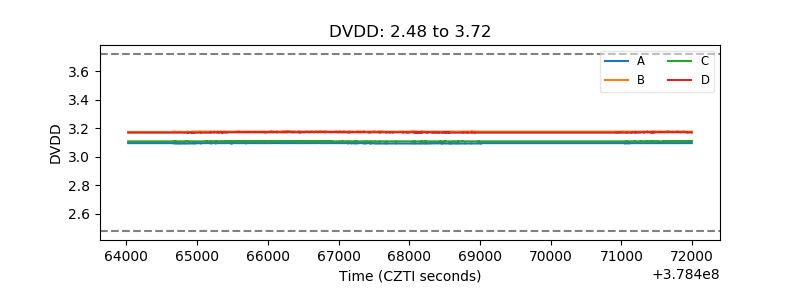 |
| Temperature 1 |  |
| Veto HV Monitor | 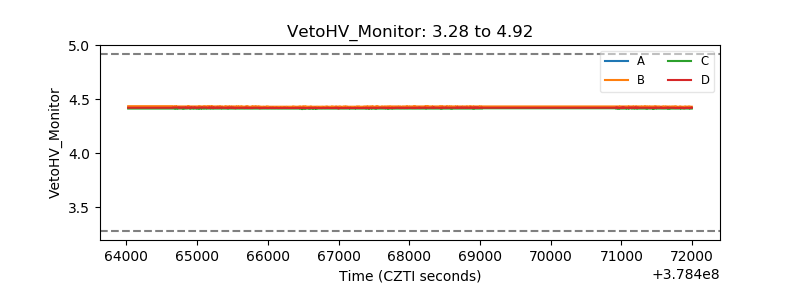 |
| Veto LLD | 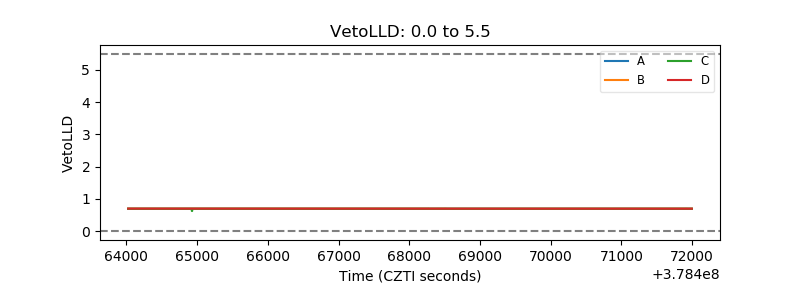 |
| Alpha Counter | 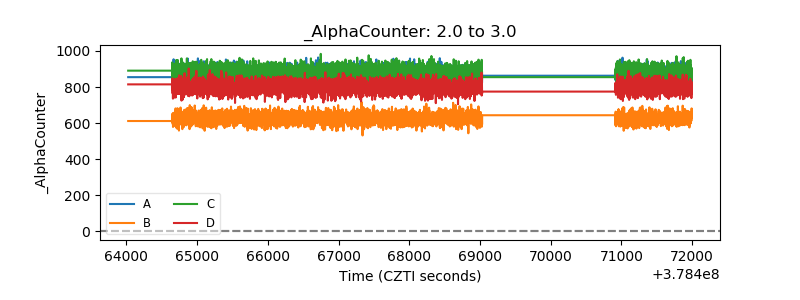 |
| _CPM_Rate | 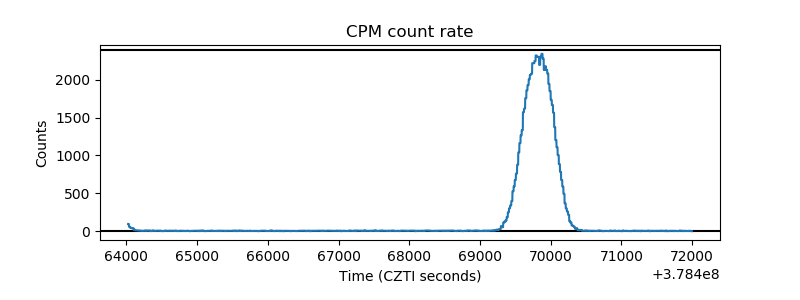 |
| CZT Counter | 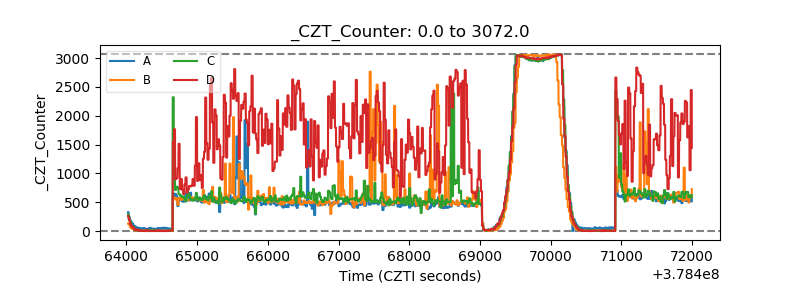 |
| +2.5 Volts monitor |  |
| +5 Volts monitor |  |
| _ROLL_ROT | 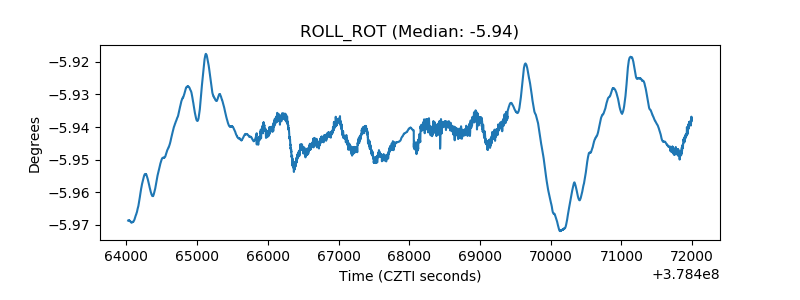 |
| _Roll_DEC |  |
| _Roll_RA | 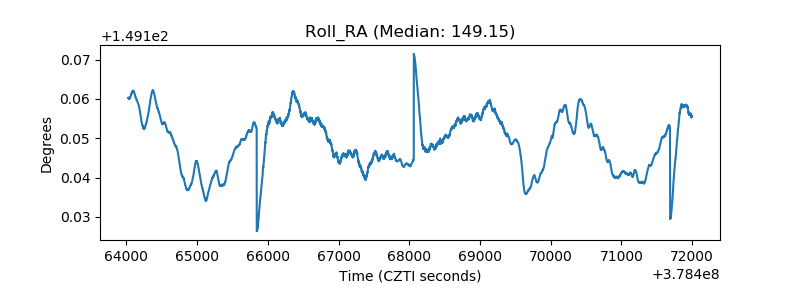 |
| Veto Counter | 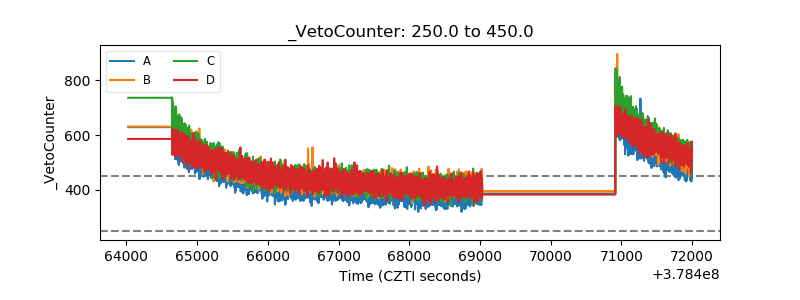 |