| Param | Original file | Final file |
|---|---|---|
| Filename | modeM0/AS1T04_077T01_9000004824_33814cztM0_level2.evt | modeM0/AS1T04_077T01_9000004824_33814cztM0_level2_quad_clean.evt |
| Size (bytes) | 539,608,320 | 62,496,000 |
| Size | 514.6 MB | 59.6 MB |
| Events in quadrant A | 2,709,729 | 397,762 |
| Events in quadrant B | 3,619,329 | 384,958 |
| Events in quadrant C | 3,229,409 | 394,430 |
| Events in quadrant D | 6,439,570 | 358,232 |
| Mode M9 | |||
|---|---|---|---|
| Quadrant | BADHDUFLAG | Total packets | Discarded packets |
| A | 0 | 33 | 0 |
| B | 0 | 33 | 0 |
| C | 0 | 33 | 0 |
| D | 0 | 34 | 0 |
| Mode M0 | |||
|---|---|---|---|
| Quadrant | BADHDUFLAG | Total packets | Discarded packets |
| A | 0 | 11146 | 3 |
| B | 0 | 14143 | 2 |
| C | 0 | 12935 | 2 |
| D | 0 | 22722 | 2 |
| Mode SS | |||
|---|---|---|---|
| Quadrant | BADHDUFLAG | Total packets | Discarded packets |
| A | 0 | 104 | 0 |
| B | 0 | 104 | 0 |
| C | 0 | 104 | 0 |
| D | 0 | 104 | 0 |
| Quadrant | Total seconds | Saturated seconds | Saturation percentage |
|---|---|---|---|
| A | 5089 | 12 | 0.235803% |
| B | 5089 | 201 | 3.949695% |
| C | 5089 | 104 | 2.043624% |
| D | 5089 | 664 | 13.047750% |
Noise dominated data is calculated using 1-second bins in cleaned event files. If a bin has >2000 counts, and if more than 50% of those come from <1% of pixels, then it is considered to be noise-dominated and hence unusable.
| Quadrant | # 1 sec bins | Bins with >0 counts | Bins with >2000 counts | High rate bins dominated by noise | Noise dominated (total time) | Noise dominated (detector-on time) | Marked lightcurve |
|---|---|---|---|---|---|---|---|
| A | 7182 | 5090 | 2 | 2 | 0.03% | 0.04% | 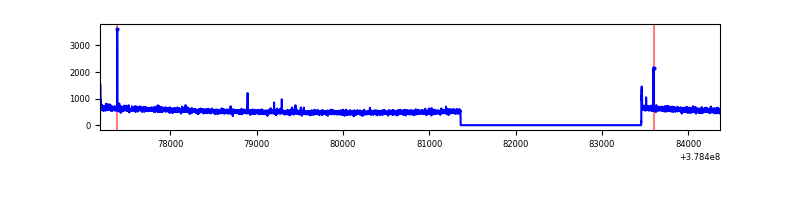 |
| B | 7182 | 5090 | 138 | 138 | 1.92% | 2.71% | 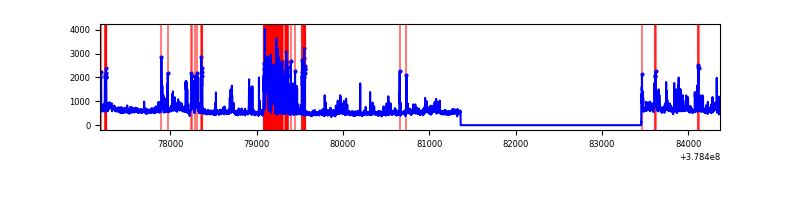 |
| C | 7182 | 5090 | 75 | 75 | 1.04% | 1.47% | 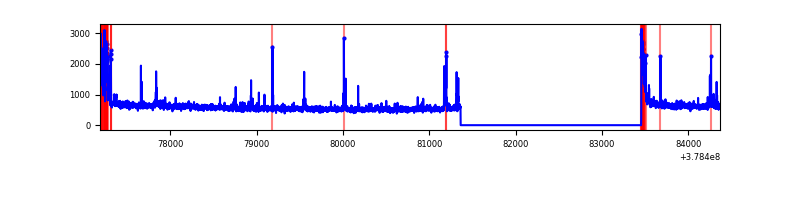 |
| D | 7182 | 5090 | 632 | 632 | 8.80% | 12.42% | 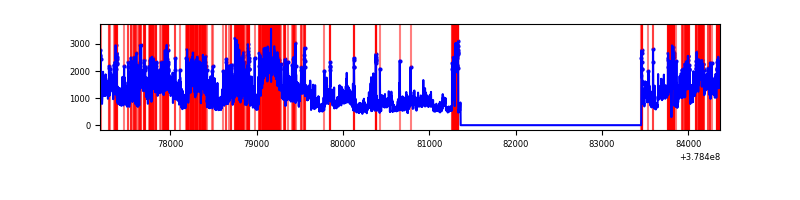 |
Top three noisy pixels from each quadrant. If the there are fewer than three noisy pixels in the level2.evt file, extra rows are filled as -1
| Pixel properties | Quadrant properties | ||||||
|---|---|---|---|---|---|---|---|
| Quadrant | DetID | PixID | Counts | Sigma | Mean | Median | Sigma |
| A | 15 | 169 | 19086 | 134.27 | 689 | 677 | 137.1 |
| A | 13 | 6 | 13686 | 94.89 | 689 | 677 | 137.1 |
| A | 10 | 83 | 11089 | 75.94 | 689 | 677 | 137.1 |
| B | 5 | 172 | 678723 | 5446.54 | 673 | 659 | 124.5 |
| B | 4 | 170 | 71211 | 566.71 | 673 | 659 | 124.5 |
| B | 0 | 229 | 52288 | 414.71 | 673 | 659 | 124.5 |
| C | 0 | 10 | 229341 | 1499.24 | 671 | 679 | 152.5 |
| C | 15 | 214 | 165305 | 1079.38 | 671 | 679 | 152.5 |
| C | 3 | 233 | 121632 | 793.04 | 671 | 679 | 152.5 |
| D | 12 | 235 | 1773481 | 11231.64 | 653 | 638 | 157.8 |
| D | 8 | 195 | 1307112 | 8277.01 | 653 | 638 | 157.8 |
| D | 2 | 250 | 210431 | 1329.12 | 653 | 638 | 157.8 |
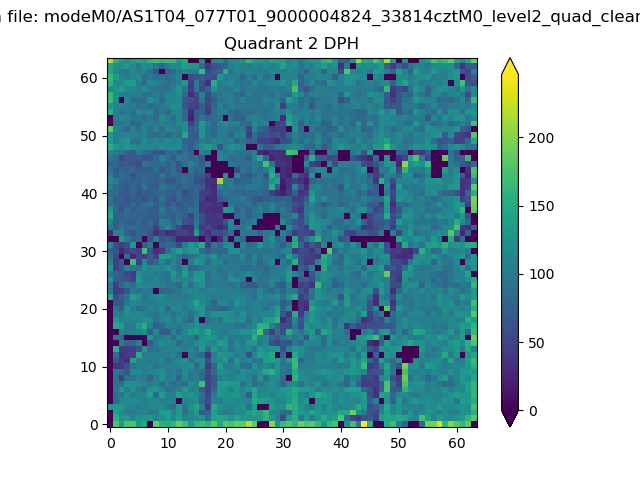
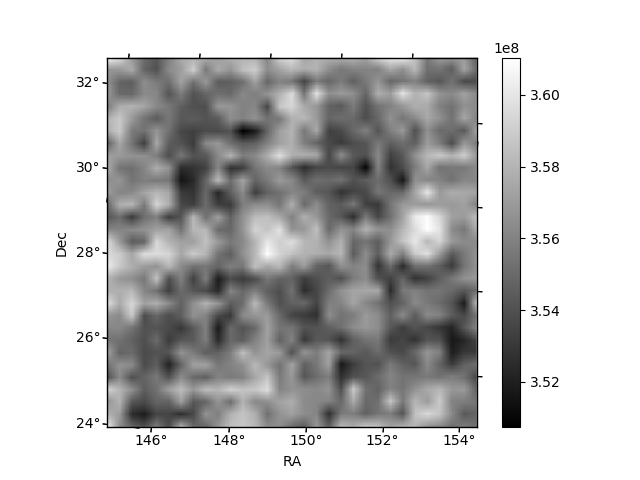
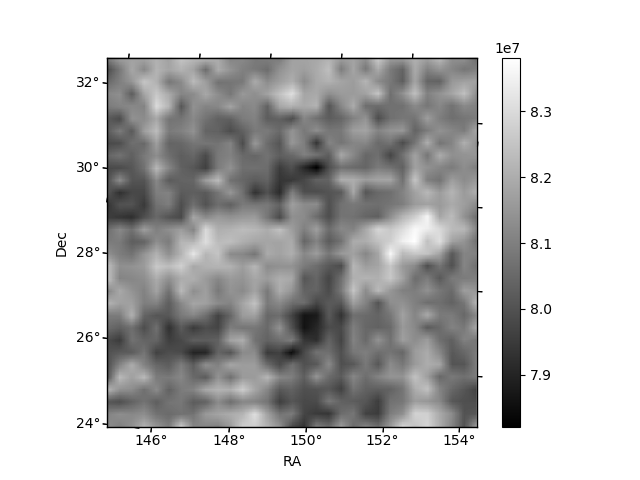
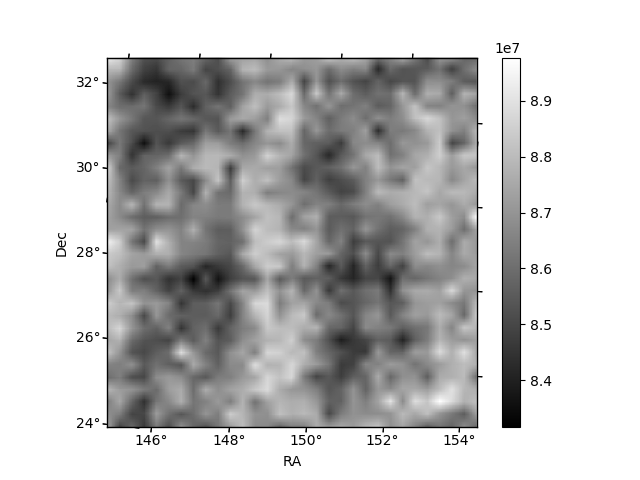
Histogram calculated using DETX and DETY for each event in the final _common_clean file
| Quadrant A | 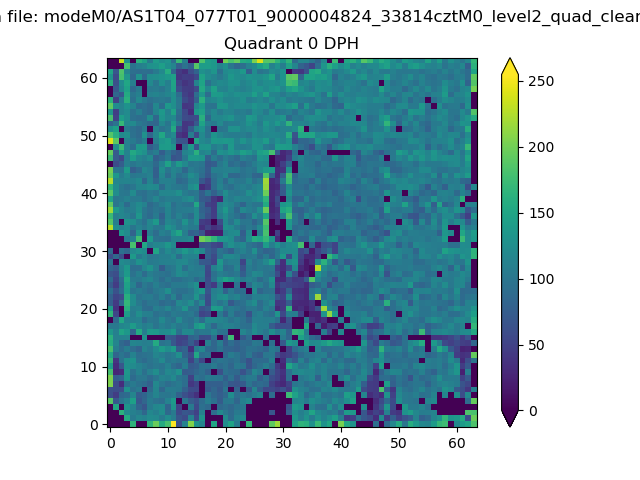 |
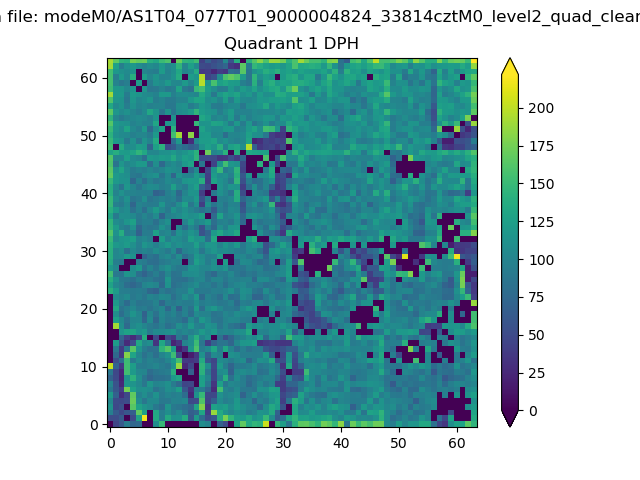 |
Quadrant B |
|---|---|---|---|
| Quadrant D | 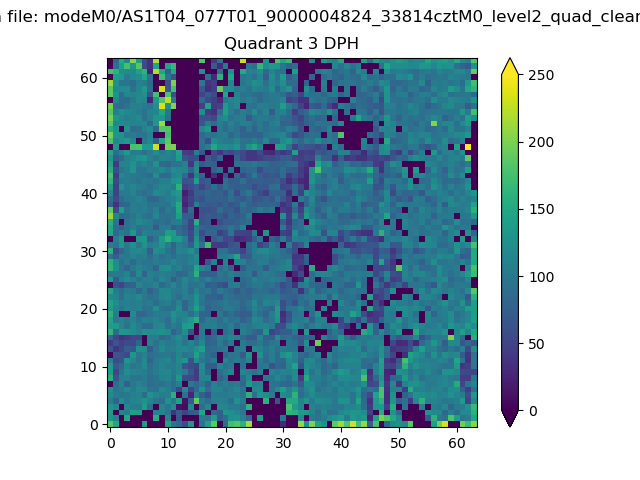 |
 |
Quadrant C |
| Plot type | Count rate plots | Images |
|---|---|---|
| Comparison with Poisson distribution Blue bars denote a histogram of data divided into 1 sec bins. Red curve is a Poisson curve with rate = median count rate of data. |
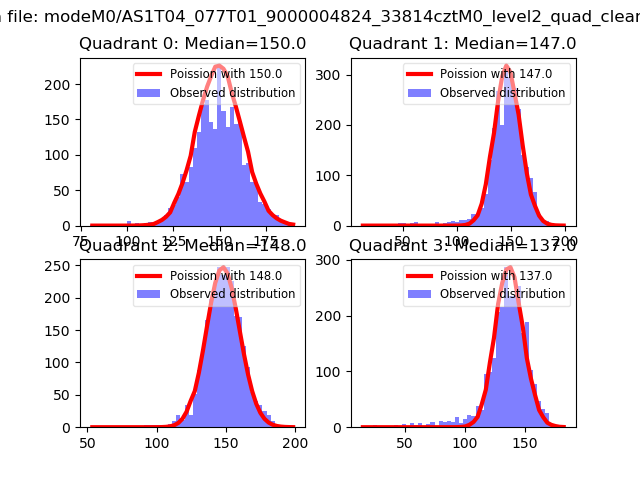 |
 |
| Quadrant-wise count rates Data is divided into 100 sec bins |
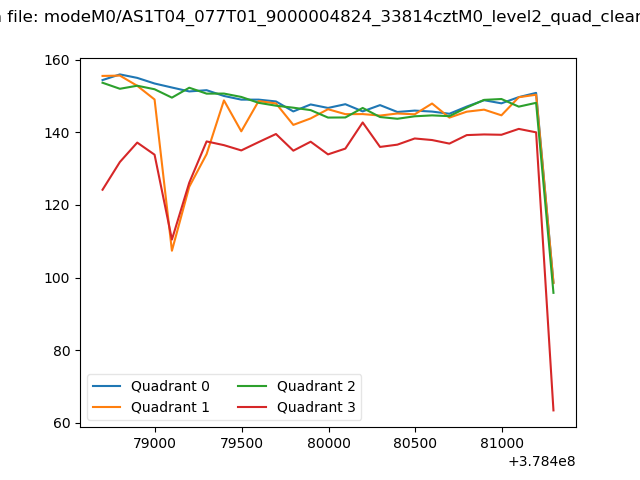 |
|
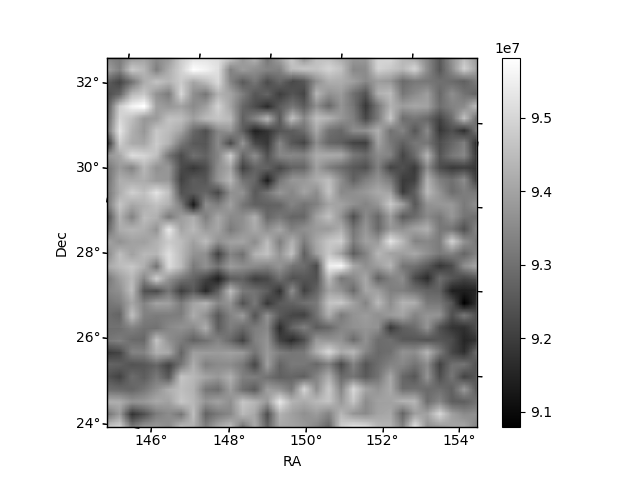
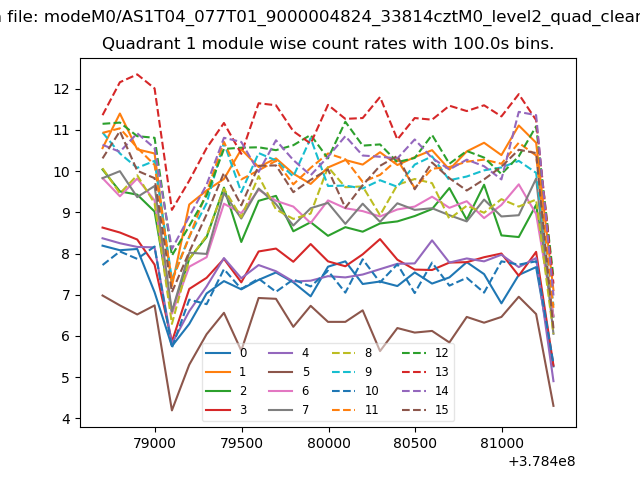
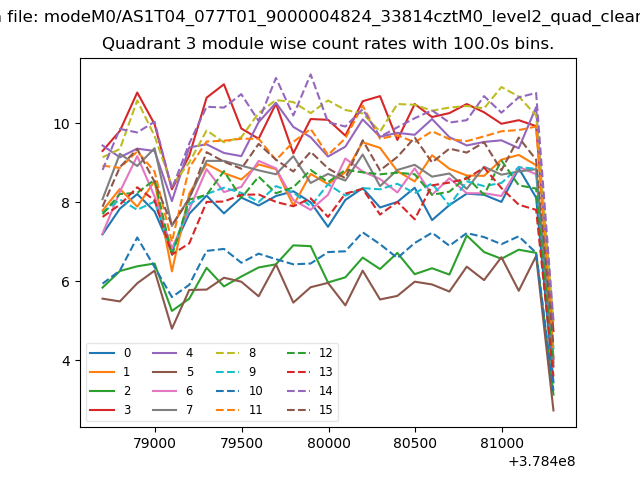
| Module-wise count rates for Quadrant A Data is divided into 100 sec bins |
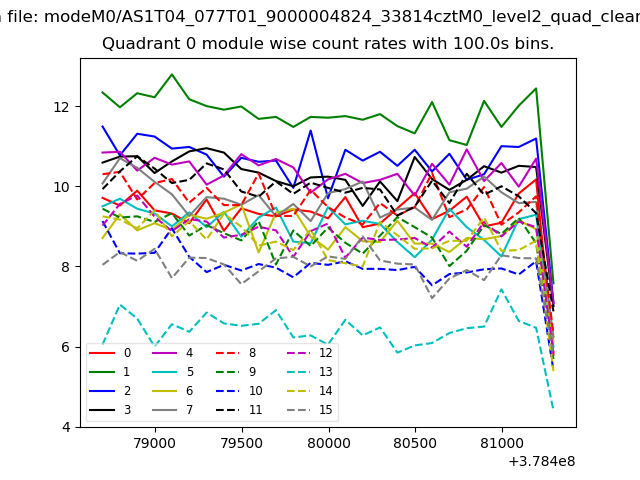 |
 |
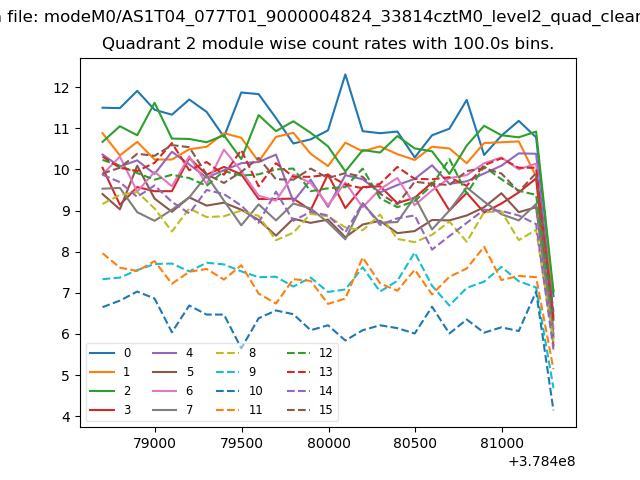
| Module-wise count rates for Quadrant B Data is divided into 100 sec bins |
 |
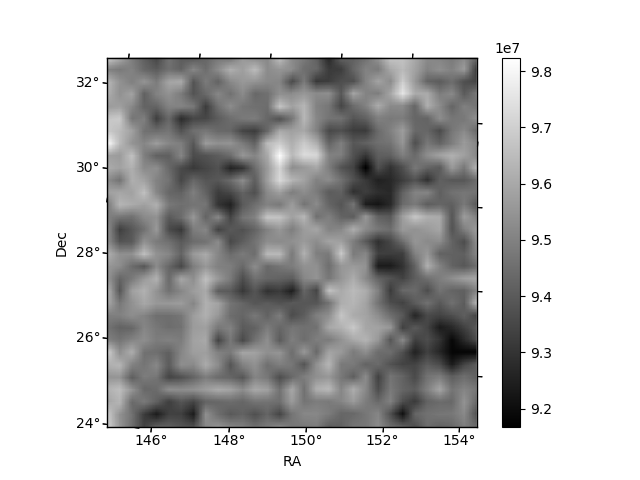 |
| Module-wise count rates for Quadrant C Data is divided into 100 sec bins |
 |
 |
| Module-wise count rates for Quadrant D Data is divided into 100 sec bins |
 |
 |
| Parameter | Plot |
|---|---|
| CZT HV Monitor | 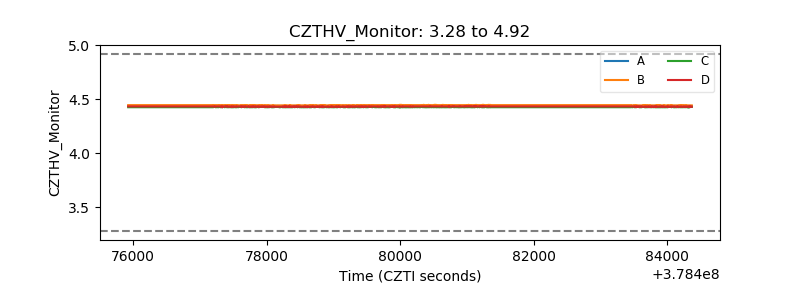 |
| D_VDD | 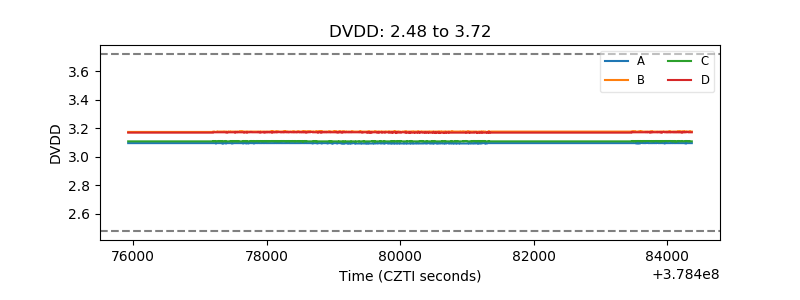 |
| Temperature 1 | 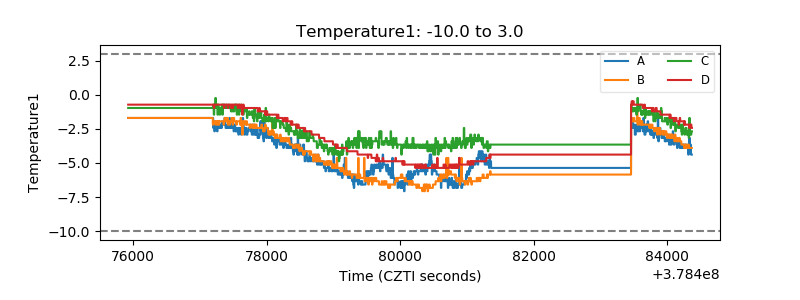 |
| Veto HV Monitor | 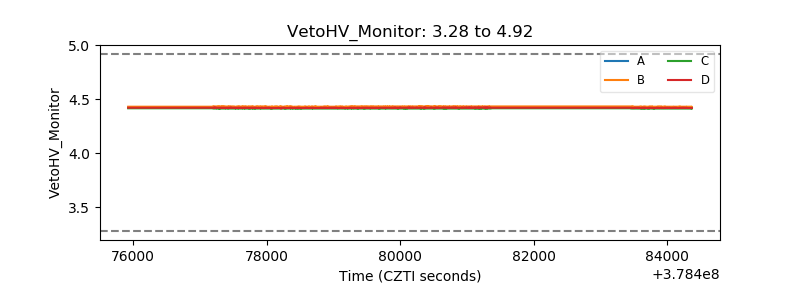 |
| Veto LLD |  |
| Alpha Counter | 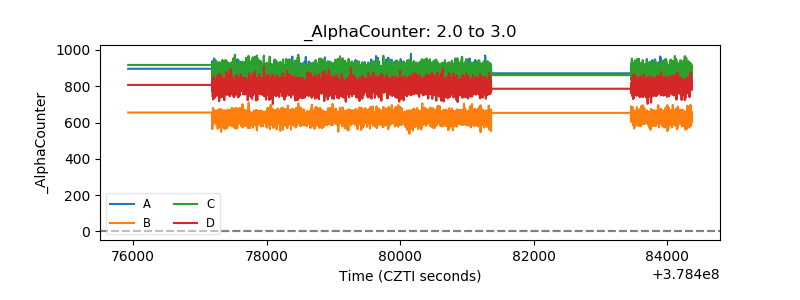 |
| _CPM_Rate | 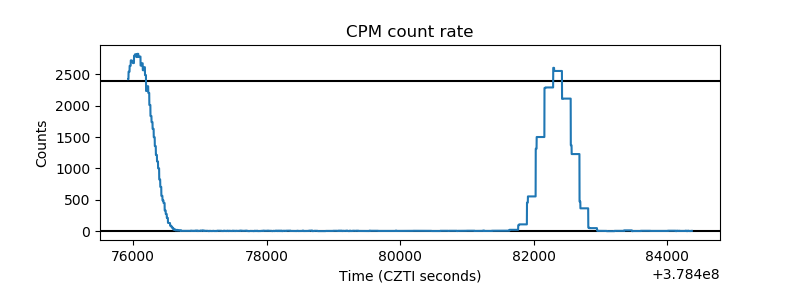 |
| CZT Counter | 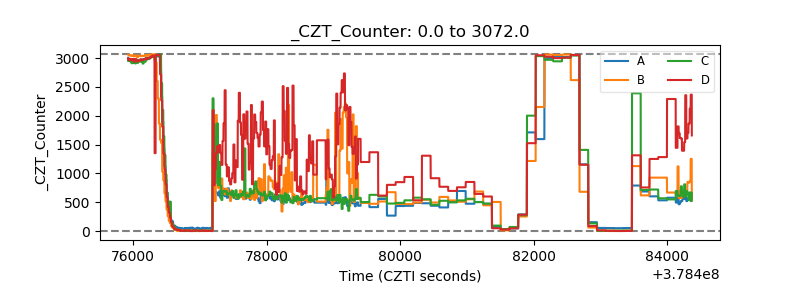 |
| +2.5 Volts monitor |  |
| +5 Volts monitor |  |
| _ROLL_ROT | 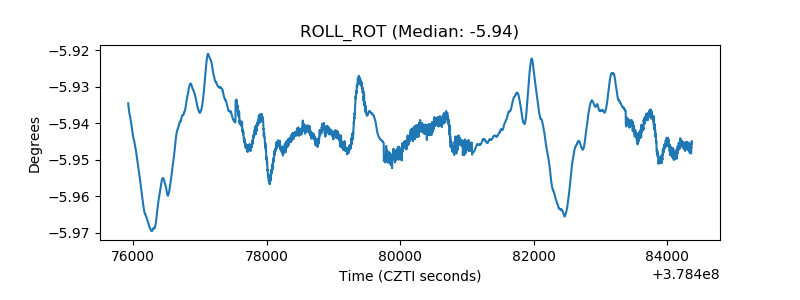 |
| _Roll_DEC | 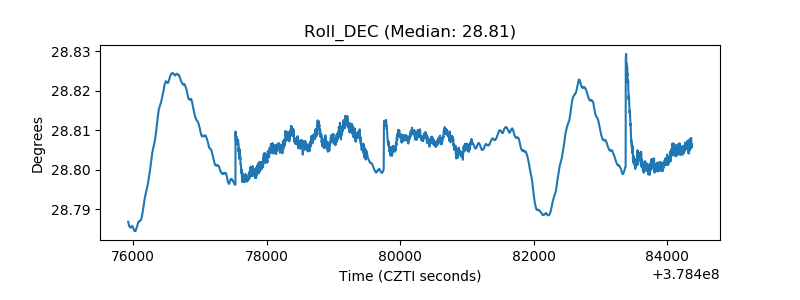 |
| _Roll_RA | 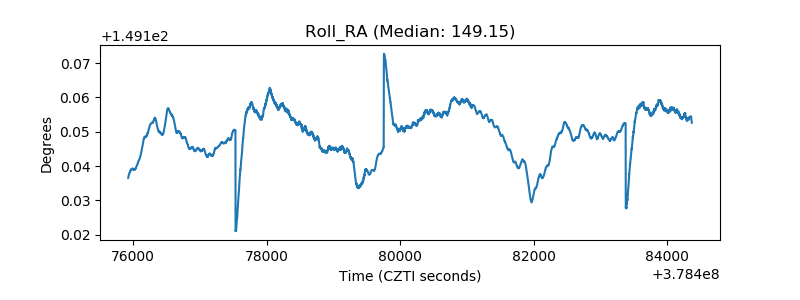 |
| Veto Counter | 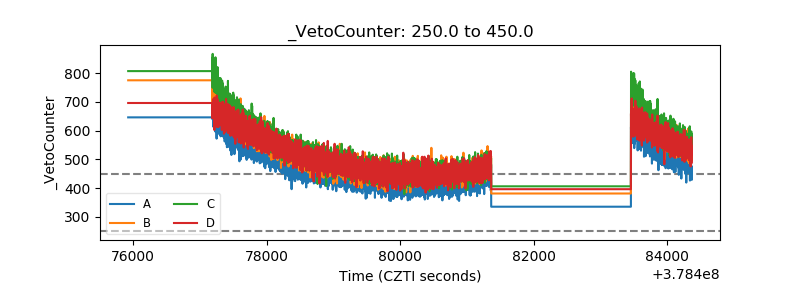 |