| Param | Original file | Final file |
|---|---|---|
| Filename | modeM0/AS1T04_077T01_9000004824_33815cztM0_level2.evt | modeM0/AS1T04_077T01_9000004824_33815cztM0_level2_quad_clean.evt |
| Size (bytes) | 306,708,480 | 39,600,000 |
| Size | 292.5 MB | 37.8 MB |
| Events in quadrant A | 1,452,618 | 258,554 |
| Events in quadrant B | 2,152,153 | 245,869 |
| Events in quadrant C | 1,735,211 | 257,005 |
| Events in quadrant D | 3,755,946 | 235,460 |
| Mode M9 | |||
|---|---|---|---|
| Quadrant | BADHDUFLAG | Total packets | Discarded packets |
| A | 0 | 13 | 0 |
| B | 0 | 13 | 0 |
| C | 0 | 13 | 0 |
| D | 0 | 14 | 0 |
| Mode M0 | |||
|---|---|---|---|
| Quadrant | BADHDUFLAG | Total packets | Discarded packets |
| A | 0 | 6075 | 1 |
| B | 0 | 8283 | 1 |
| C | 0 | 7023 | 1 |
| D | 0 | 13149 | 1 |
| Mode SS | |||
|---|---|---|---|
| Quadrant | BADHDUFLAG | Total packets | Discarded packets |
| A | 0 | 56 | 0 |
| B | 0 | 56 | 0 |
| C | 0 | 56 | 0 |
| D | 0 | 56 | 0 |
| Quadrant | Total seconds | Saturated seconds | Saturation percentage |
|---|---|---|---|
| A | 2828 | 4 | 0.141443% |
| B | 2828 | 168 | 5.940594% |
| C | 2828 | 38 | 1.343706% |
| D | 2828 | 359 | 12.694484% |
Noise dominated data is calculated using 1-second bins in cleaned event files. If a bin has >2000 counts, and if more than 50% of those come from <1% of pixels, then it is considered to be noise-dominated and hence unusable.
| Quadrant | # 1 sec bins | Bins with >0 counts | Bins with >2000 counts | High rate bins dominated by noise | Noise dominated (total time) | Noise dominated (detector-on time) | Marked lightcurve |
|---|---|---|---|---|---|---|---|
| A | 2828 | 2828 | 1 | 1 | 0.04% | 0.04% | 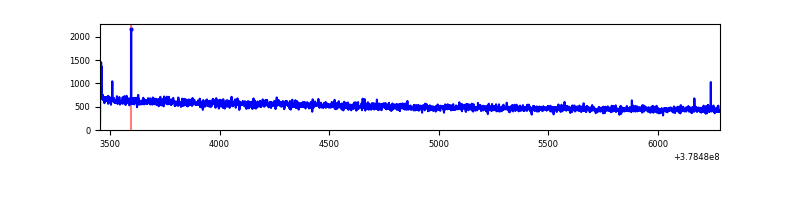 |
| B | 2828 | 2828 | 131 | 131 | 4.63% | 4.63% | 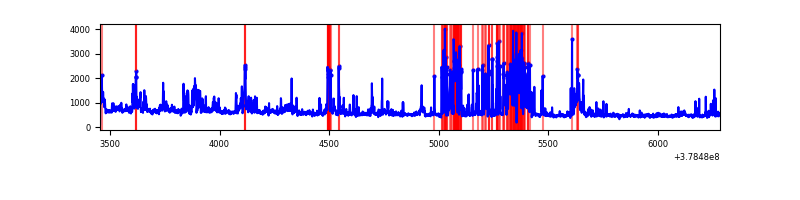 |
| C | 2828 | 2828 | 30 | 30 | 1.06% | 1.06% | 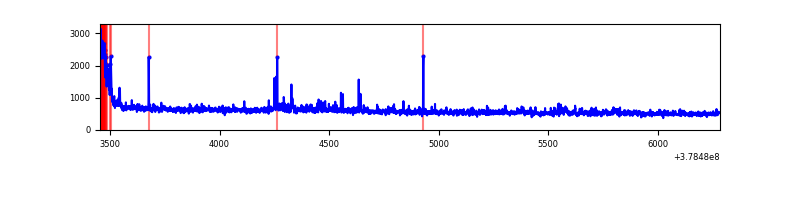 |
| D | 2828 | 2828 | 349 | 349 | 12.34% | 12.34% | 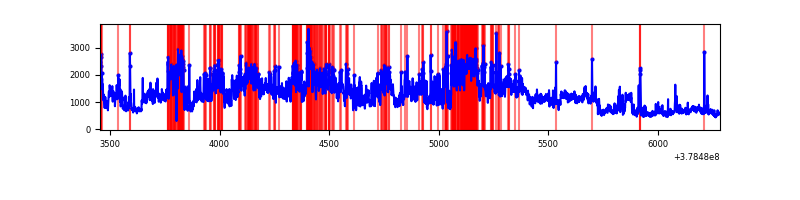 |
Top three noisy pixels from each quadrant. If the there are fewer than three noisy pixels in the level2.evt file, extra rows are filled as -1
| Pixel properties | Quadrant properties | ||||||
|---|---|---|---|---|---|---|---|
| Quadrant | DetID | PixID | Counts | Sigma | Mean | Median | Sigma |
| A | 13 | 6 | 8469 | 108.46 | 370 | 364 | 74.7 |
| A | 15 | 169 | 8003 | 102.22 | 370 | 364 | 74.7 |
| A | 10 | 83 | 5641 | 70.61 | 370 | 364 | 74.7 |
| B | 5 | 172 | 520936 | 7620.01 | 360 | 353 | 68.3 |
| B | 4 | 251 | 76290 | 1111.52 | 360 | 353 | 68.3 |
| B | 0 | 229 | 52642 | 765.38 | 360 | 353 | 68.3 |
| C | 0 | 10 | 104370 | 1246.25 | 365 | 369 | 83.5 |
| C | 15 | 214 | 89980 | 1073.81 | 365 | 369 | 83.5 |
| C | 3 | 233 | 37769 | 448.17 | 365 | 369 | 83.5 |
| D | 8 | 195 | 985264 | 10756.7 | 351 | 345 | 91.6 |
| D | 12 | 235 | 949448 | 10365.54 | 351 | 345 | 91.6 |
| D | 2 | 250 | 238827 | 2604.56 | 351 | 345 | 91.6 |
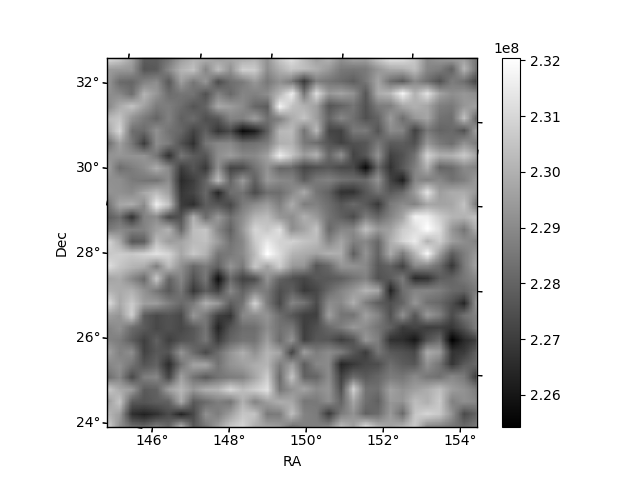
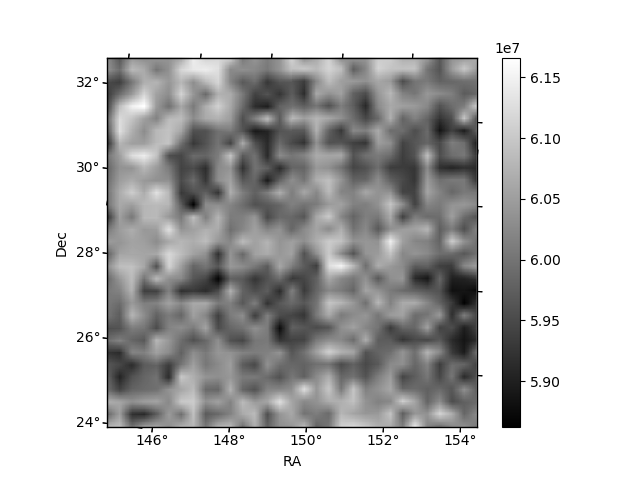
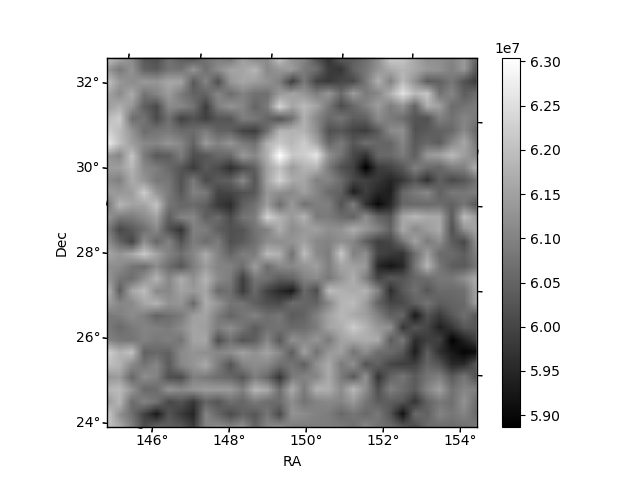
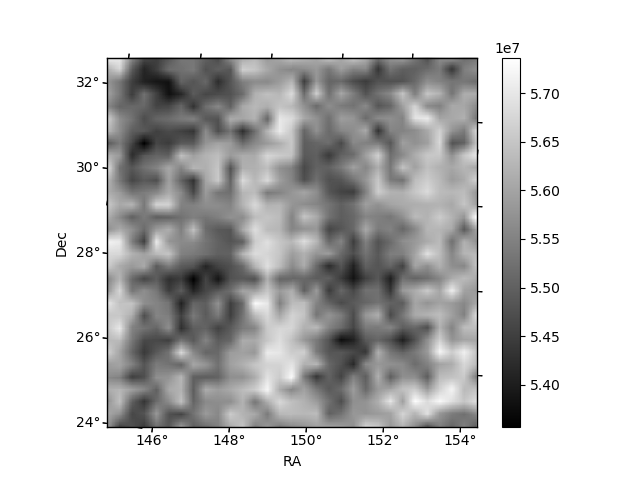
Histogram calculated using DETX and DETY for each event in the final _common_clean file
| Quadrant A | 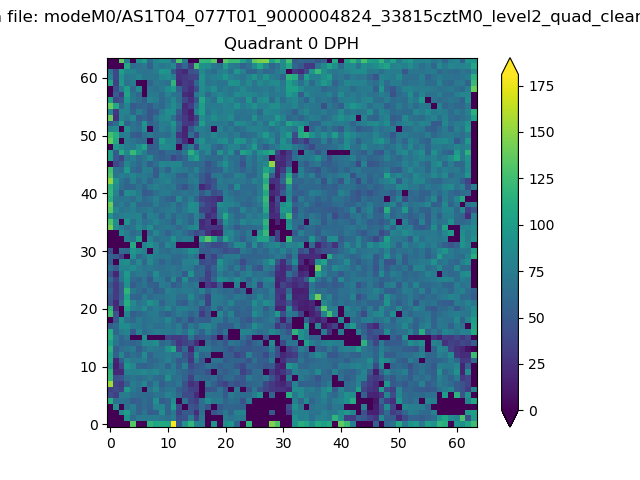 |
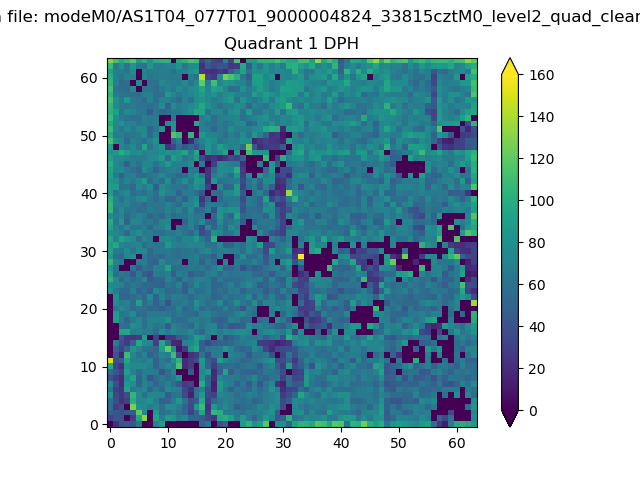 |
Quadrant B |
|---|---|---|---|
| Quadrant D |  |
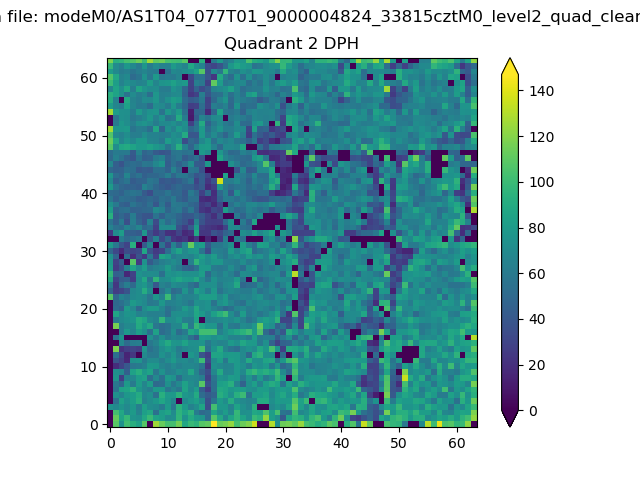 |
Quadrant C |
| Plot type | Count rate plots | Images |
|---|---|---|
| Comparison with Poisson distribution Blue bars denote a histogram of data divided into 1 sec bins. Red curve is a Poisson curve with rate = median count rate of data. |
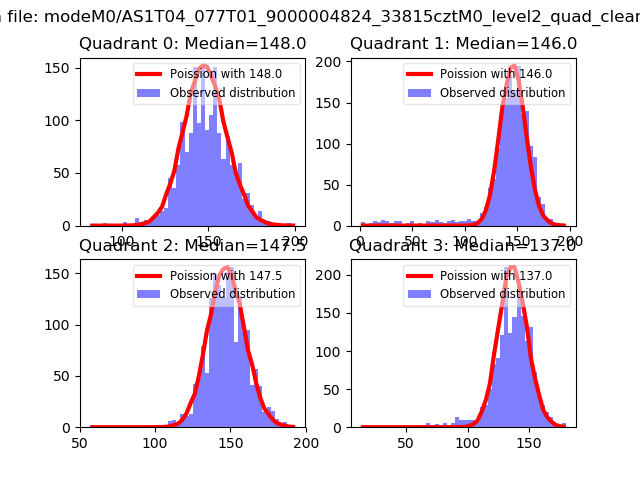 |
 |
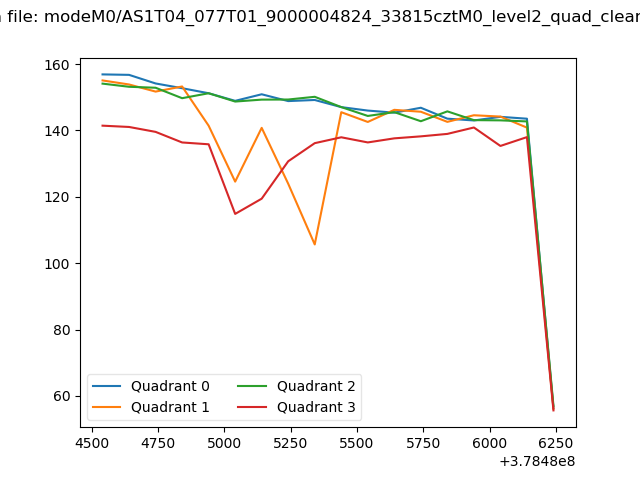
| Quadrant-wise count rates Data is divided into 100 sec bins |
 |
|
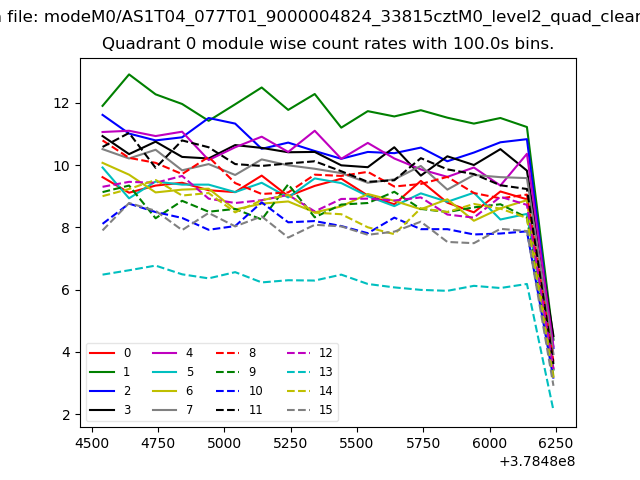
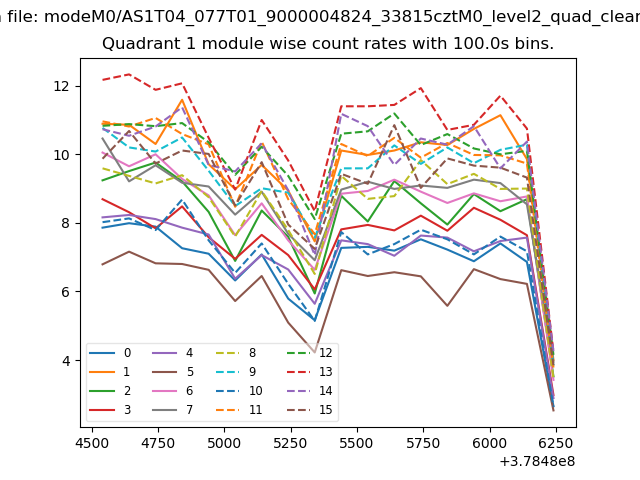
| Module-wise count rates for Quadrant A Data is divided into 100 sec bins |
 |
 |
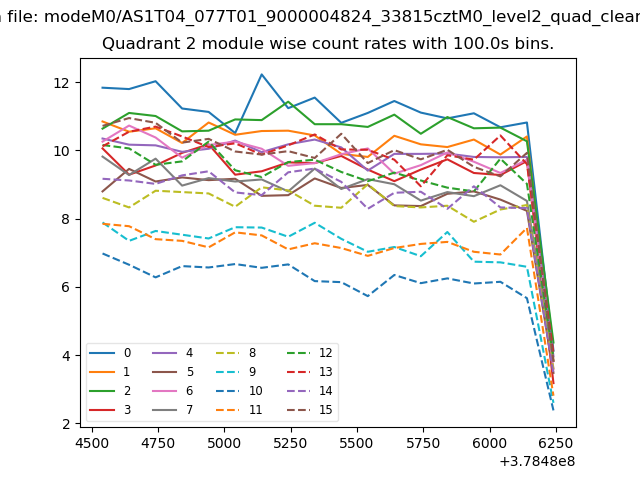
| Module-wise count rates for Quadrant B Data is divided into 100 sec bins |
 |
 |
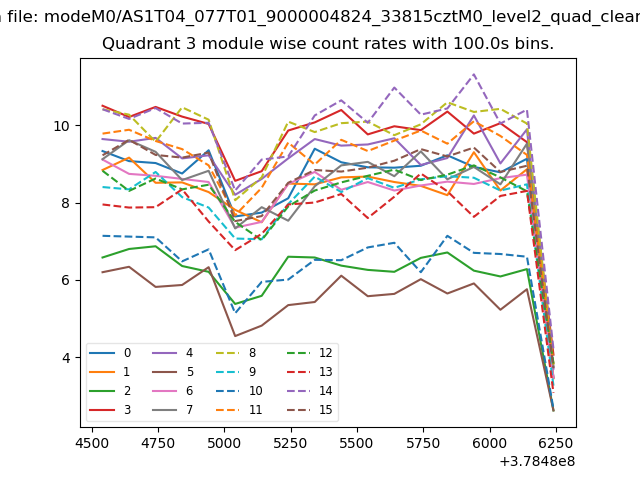
| Module-wise count rates for Quadrant C Data is divided into 100 sec bins |
 |
 |
| Module-wise count rates for Quadrant D Data is divided into 100 sec bins |
 |
 |
| Parameter | Plot |
|---|---|
| CZT HV Monitor | 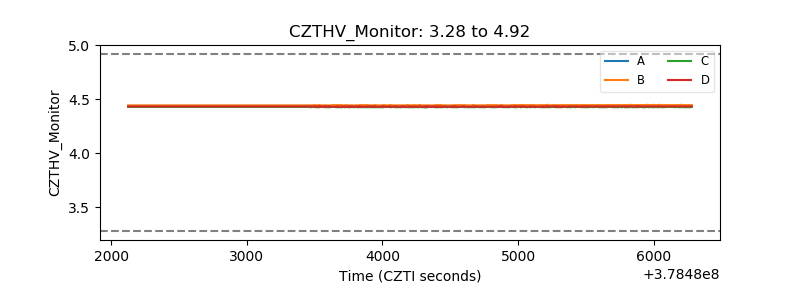 |
| D_VDD | 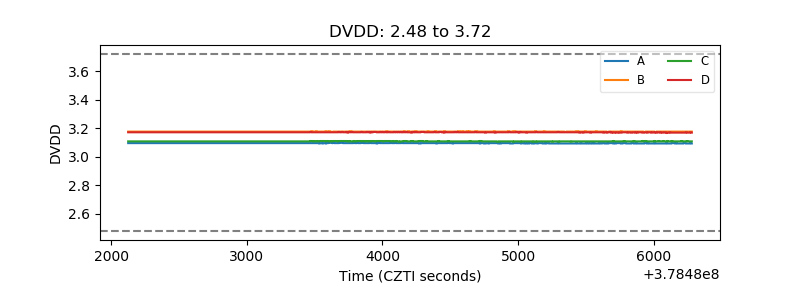 |
| Temperature 1 |  |
| Veto HV Monitor | 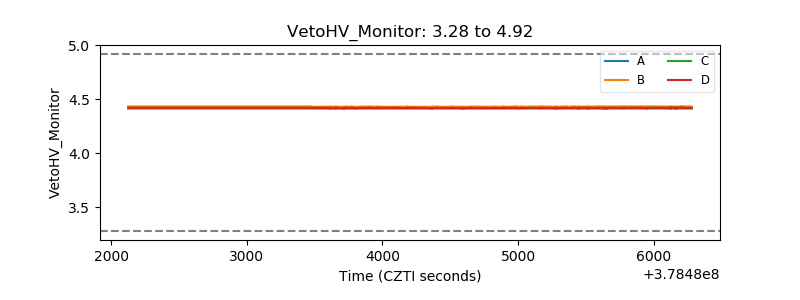 |
| Veto LLD |  |
| Alpha Counter | 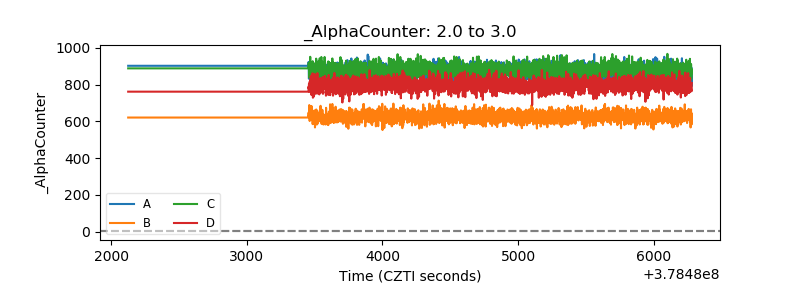 |
| _CPM_Rate | 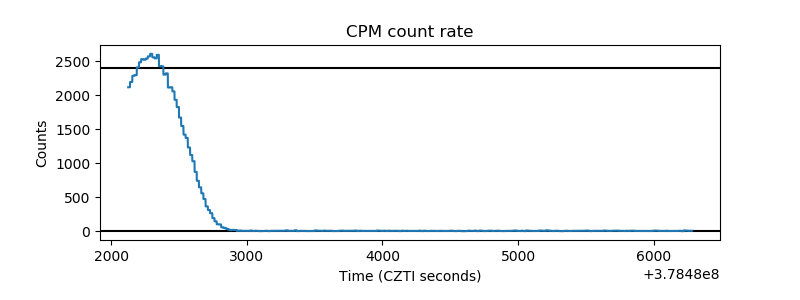 |
| CZT Counter | 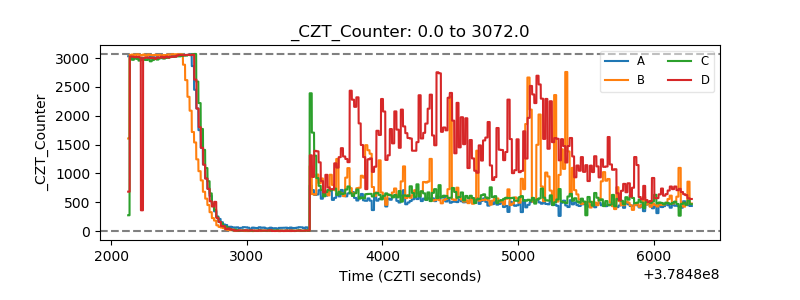 |
| +2.5 Volts monitor |  |
| +5 Volts monitor |  |
| _ROLL_ROT | 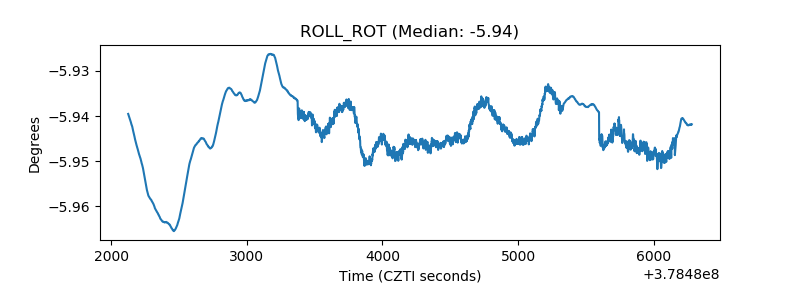 |
| _Roll_DEC | 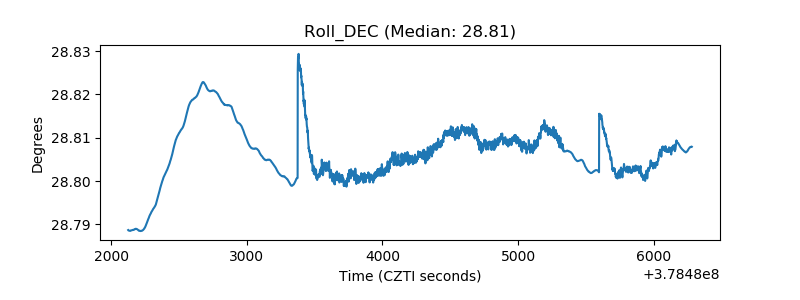 |
| _Roll_RA | 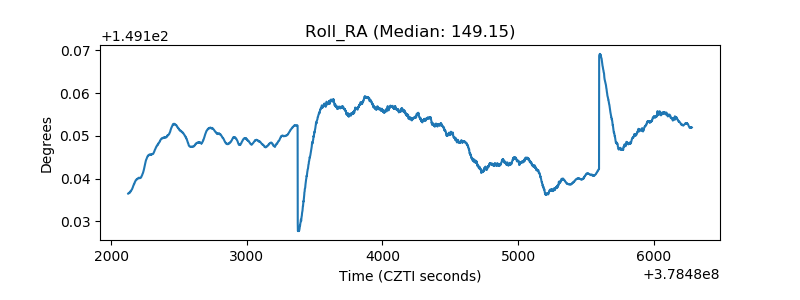 |
| Veto Counter | 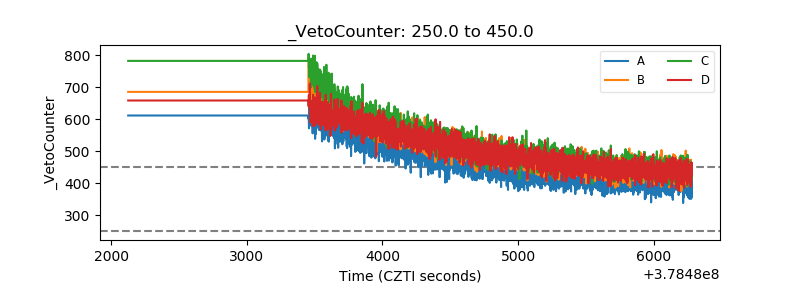 |