| Param | Original file | Final file |
|---|---|---|
| Filename | modeM0/AS1T04_091T01_9000004822cztM0_level2.fits | modeM0/AS1T04_091T01_9000004822cztM0_level2_quad_clean.evt |
| Size (bytes) | 298,581,120 | 295,332,480 |
| Size | 284.7 MB | 281.7 MB |
| Events in quadrant A | 1,771,958 | 1,719,544 |
| Events in quadrant B | 1,800,204 | 1,831,070 |
| Events in quadrant C | 1,875,474 | 1,792,977 |
| Events in quadrant D | 1,549,612 | 1,557,149 |
| Mode SS | |||
|---|---|---|---|
| Quadrant | BADHDUFLAG | Total packets | Discarded packets |
| A | 0 | 610 | 0 |
| B | 0 | 602 | 0 |
| C | 0 | 610 | 0 |
| D | 0 | 604 | 0 |
| Mode M0 | |||
|---|---|---|---|
| Quadrant | BADHDUFLAG | Total packets | Discarded packets |
| A | 0 | 93869 | 0 |
| B | 0 | 75807 | 0 |
| C | 0 | 73081 | 0 |
| D | 0 | 118889 | 0 |
| Mode M9 | |||
|---|---|---|---|
| Quadrant | BADHDUFLAG | Total packets | Discarded packets |
| A | 0 | 147 | 0 |
| B | 0 | 149 | 0 |
| C | 0 | 145 | 0 |
| D | 0 | 147 | 0 |
| Quadrant | Total seconds | Saturated seconds | Saturation percentage |
|---|---|---|---|
| A | 29710 | 3912 | 13.167284% |
| B | 29775 | 947 | 3.180521% |
| C | 29786 | 453 | 1.520849% |
| D | 29579 | 2494 | 8.431658% |
Noise dominated data is calculated using 1-second bins in cleaned event files. If a bin has >2000 counts, and if more than 50% of those come from <1% of pixels, then it is considered to be noise-dominated and hence unusable.
| Quadrant | # 1 sec bins | Bins with >0 counts | Bins with >2000 counts | High rate bins dominated by noise | Noise dominated (total time) | Noise dominated (detector-on time) | Marked lightcurve |
|---|---|---|---|---|---|---|---|
| A | 44420 | 30021 | 0 | 0 | 0.00% | 0.00% | 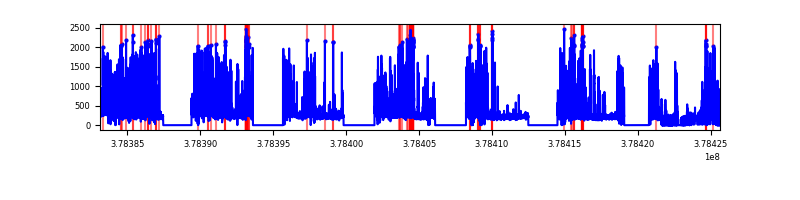 |
| B | 44420 | 30162 | 0 | 0 | 0.00% | 0.00% |  |
| C | 44420 | 30159 | 0 | 0 | 0.00% | 0.00% | 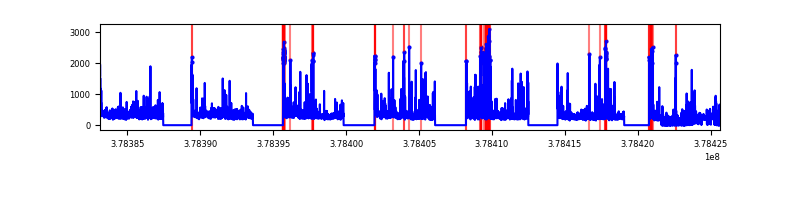 |
| D | 44420 | 29893 | 0 | 0 | 0.00% | 0.00% | 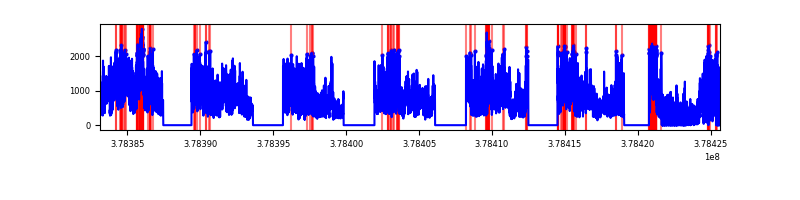 |
Top three noisy pixels from each quadrant. If the there are fewer than three noisy pixels in the level2.evt file, extra rows are filled as -1
| Pixel properties | Quadrant properties | ||||||
|---|---|---|---|---|---|---|---|
| Quadrant | DetID | PixID | Counts | Sigma | Mean | Median | Sigma |
| A | 9 | 19 | 1420 | 8.63 | 463 | 438 | 113.8 |
| A | 7 | 110 | 1412 | 8.56 | 463 | 438 | 113.8 |
| A | 0 | 29 | 1375 | 8.24 | 463 | 438 | 113.8 |
| B | 2 | 9 | 1516 | 11.15 | 477 | 458 | 94.9 |
| B | 3 | 80 | 1373 | 9.65 | 477 | 458 | 94.9 |
| B | 2 | 8 | 1213 | 7.96 | 477 | 458 | 94.9 |
| C | 1 | 81 | 1456 | 7.88 | 496 | 471 | 125.0 |
| C | 1 | 80 | 1443 | 7.78 | 496 | 471 | 125.0 |
| C | 3 | 202 | 1401 | 7.44 | 496 | 471 | 125.0 |
| D | 7 | 3 | 1191 | 6.68 | 444 | 410 | 117.0 |
| D | 4 | 160 | 1184 | 6.62 | 444 | 410 | 117.0 |
| D | 10 | 113 | 1141 | 6.25 | 444 | 410 | 117.0 |
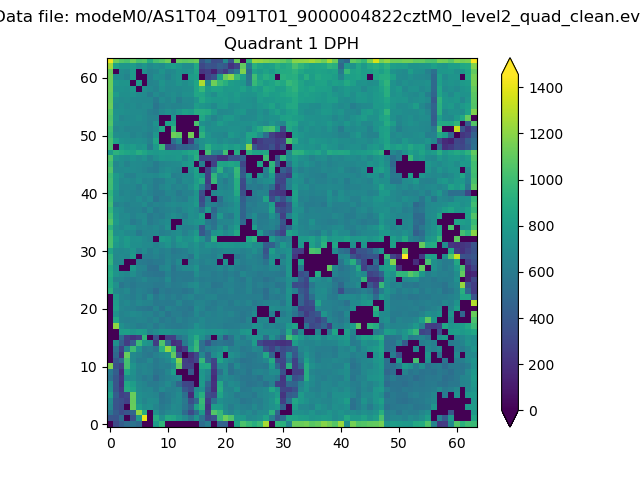
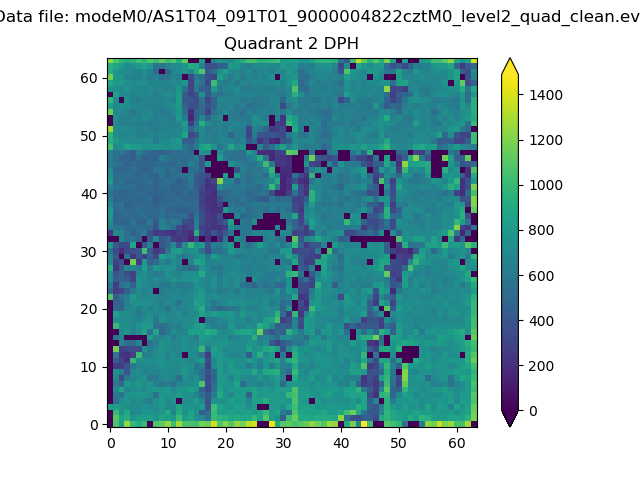
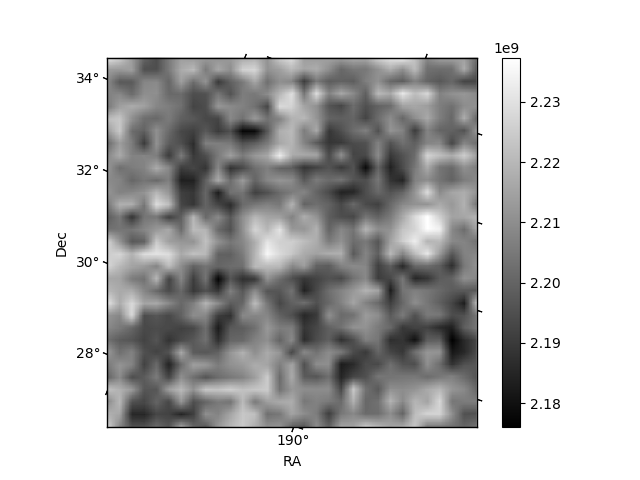
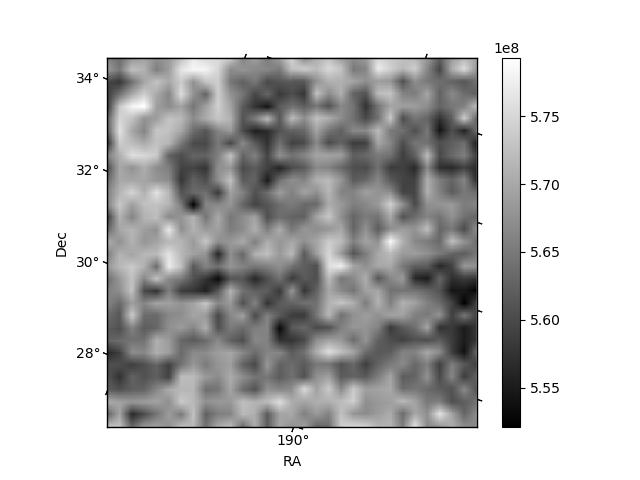
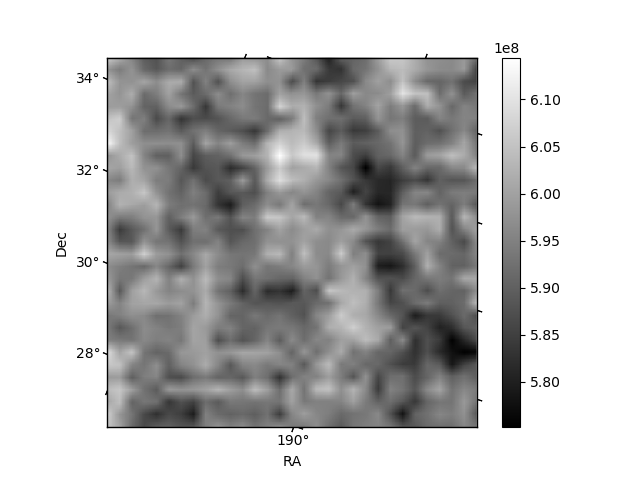
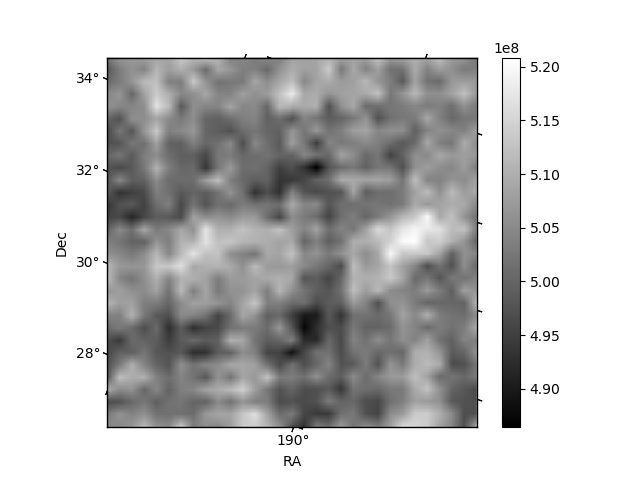
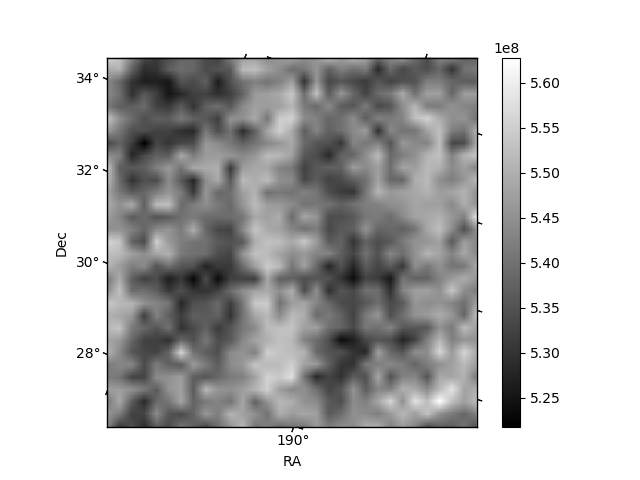
Histogram calculated using DETX and DETY for each event in the final _common_clean file
| Quadrant A | 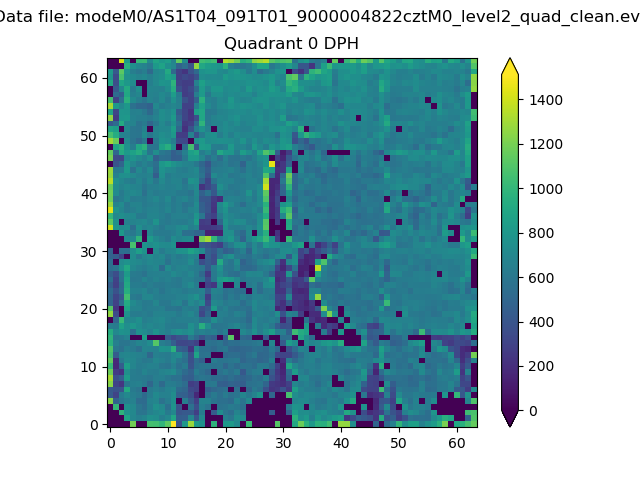 |
 |
Quadrant B |
|---|---|---|---|
| Quadrant D | 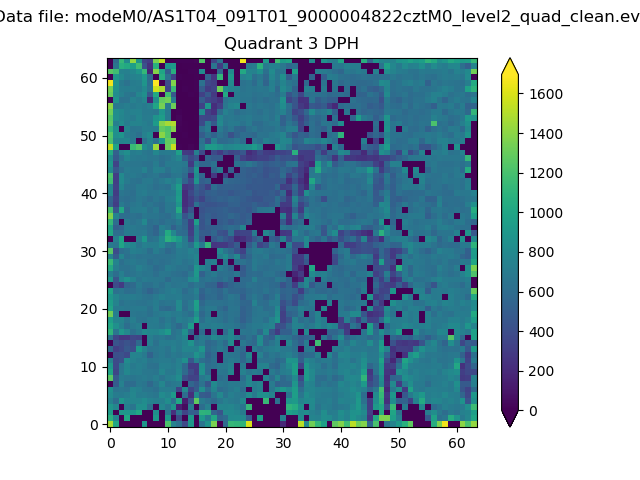 |
 |
Quadrant C |
| Plot type | Count rate plots | Images |
|---|---|---|
| Comparison with Poisson distribution Blue bars denote a histogram of data divided into 1 sec bins. Red curve is a Poisson curve with rate = median count rate of data. |
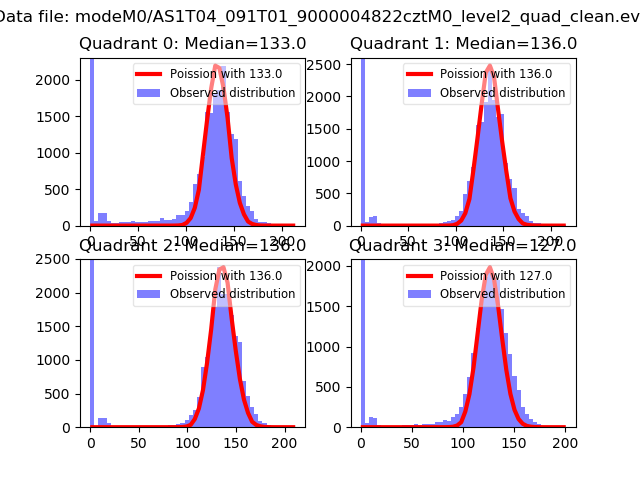 |
 |
| Quadrant-wise count rates Data is divided into 100 sec bins |
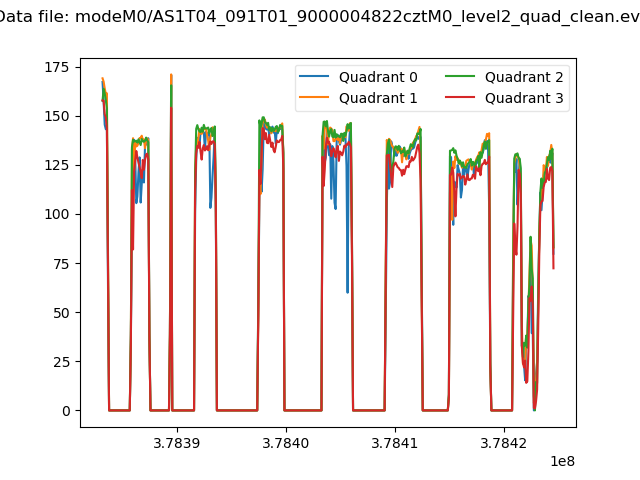 |
|
| Module-wise count rates for Quadrant A Data is divided into 100 sec bins |
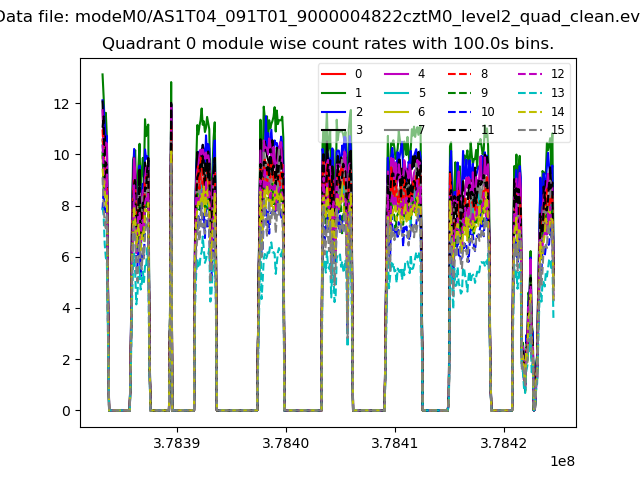 |
 |
| Module-wise count rates for Quadrant B Data is divided into 100 sec bins |
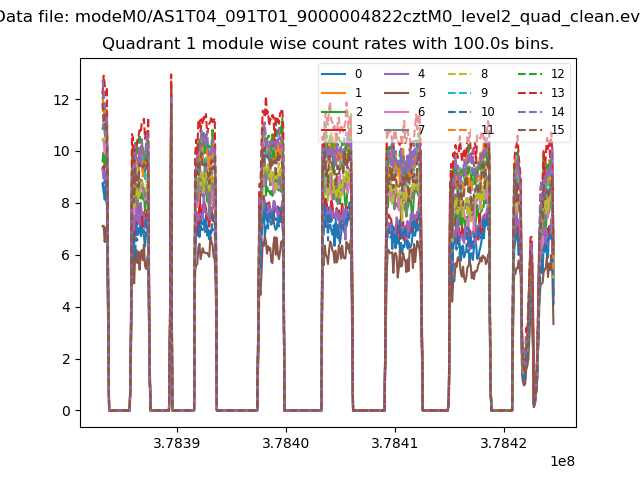 |
 |
| Module-wise count rates for Quadrant C Data is divided into 100 sec bins |
 |
 |
| Module-wise count rates for Quadrant D Data is divided into 100 sec bins |
 |
 |
| Parameter | Plot |
|---|---|
| CZT HV Monitor | 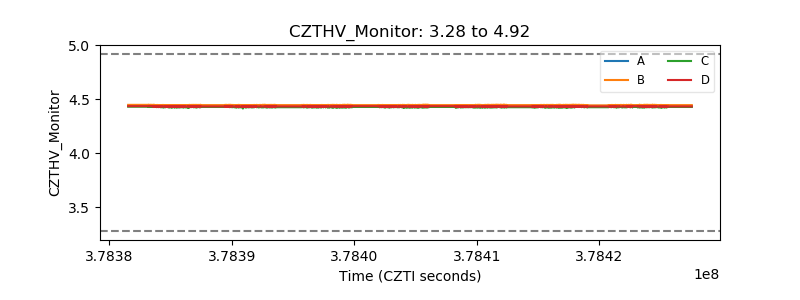 |
| D_VDD | 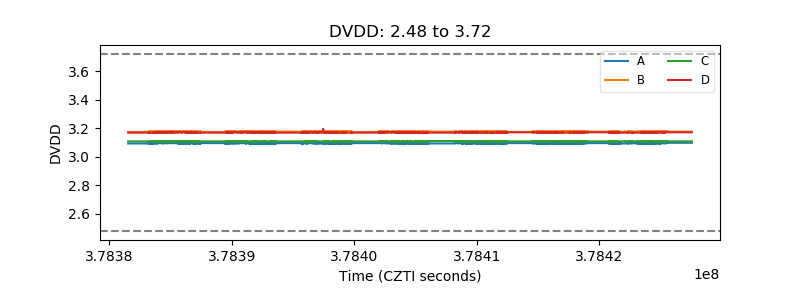 |
| Temperature 1 |  |
| Veto HV Monitor |  |
| Veto LLD | 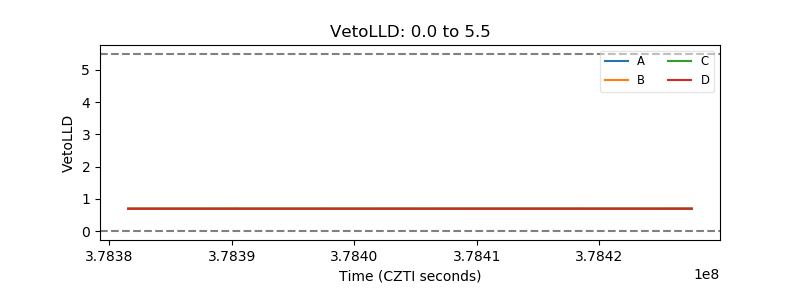 |
| Alpha Counter | 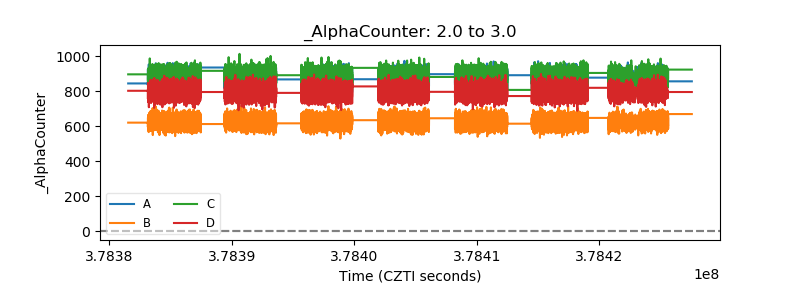 |
| _CPM_Rate | 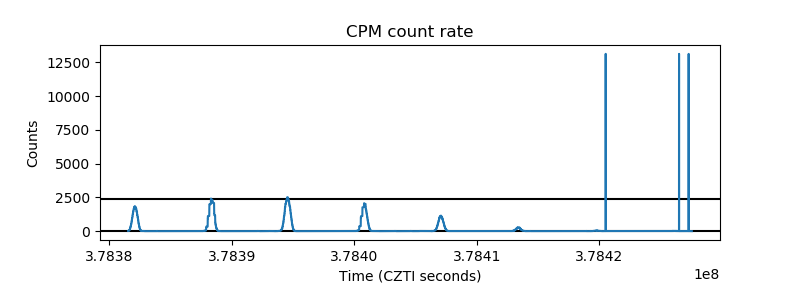 |
| CZT Counter | 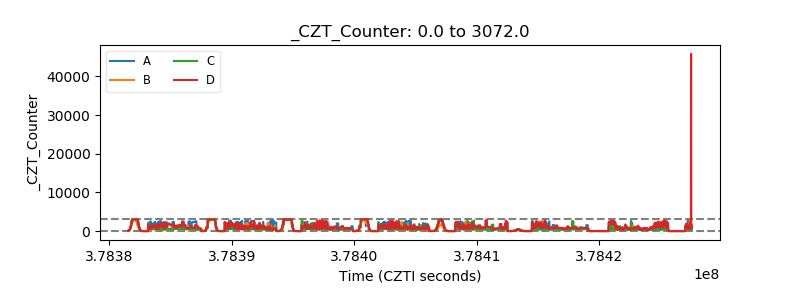 |
| +2.5 Volts monitor |  |
| +5 Volts monitor |  |
| _ROLL_ROT |  |
| _Roll_DEC |  |
| _Roll_RA |  |
| Veto Counter | 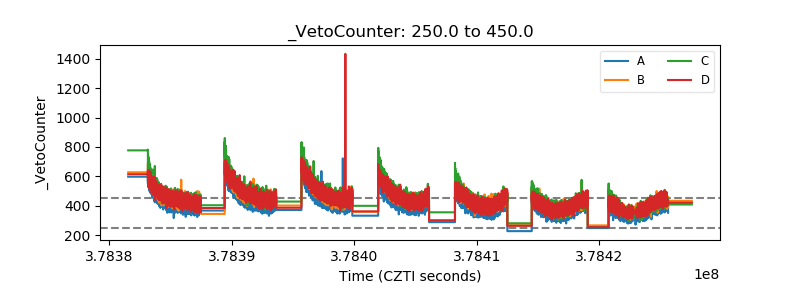 |