| Param | Original file | Final file |
|---|---|---|
| Filename | modeM0/AS1T04_091T01_9000004822_33797cztM0_level2.evt | modeM0/AS1T04_091T01_9000004822_33797cztM0_level2_quad_clean.evt |
| Size (bytes) | 98,729,280 | 13,559,040 |
| Size | 94.2 MB | 12.9 MB |
| Events in quadrant A | 992,557 | 82,317 |
| Events in quadrant B | 494,651 | 90,737 |
| Events in quadrant C | 568,436 | 87,433 |
| Events in quadrant D | 873,999 | 83,034 |
| Mode SS | |||
|---|---|---|---|
| Quadrant | BADHDUFLAG | Total packets | Discarded packets |
| A | 0 | 16 | 0 |
| B | 0 | 16 | 0 |
| C | 0 | 16 | 0 |
| D | 0 | 16 | 0 |
| Mode M0 | |||
|---|---|---|---|
| Quadrant | BADHDUFLAG | Total packets | Discarded packets |
| A | 0 | 3549 | 2 |
| B | 0 | 1945 | 1 |
| C | 0 | 2295 | 1 |
| D | 0 | 3238 | 1 |
| Mode M9 | |||
|---|---|---|---|
| Quadrant | BADHDUFLAG | Total packets | Discarded packets |
| A | 0 | 17 | 0 |
| B | 0 | 17 | 0 |
| C | 0 | 17 | 0 |
| D | 0 | 17 | 0 |
| Quadrant | Total seconds | Saturated seconds | Saturation percentage |
|---|---|---|---|
| A | 850 | 203 | 23.882353% |
| B | 850 | 6 | 0.705882% |
| C | 850 | 11 | 1.294118% |
| D | 850 | 9 | 1.058824% |
Noise dominated data is calculated using 1-second bins in cleaned event files. If a bin has >2000 counts, and if more than 50% of those come from <1% of pixels, then it is considered to be noise-dominated and hence unusable.
| Quadrant | # 1 sec bins | Bins with >0 counts | Bins with >2000 counts | High rate bins dominated by noise | Noise dominated (total time) | Noise dominated (detector-on time) | Marked lightcurve |
|---|---|---|---|---|---|---|---|
| A | 850 | 850 | 138 | 138 | 16.24% | 16.24% | 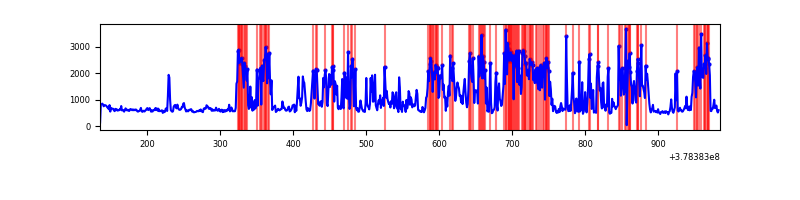 |
| B | 850 | 850 | 2 | 2 | 0.24% | 0.24% | 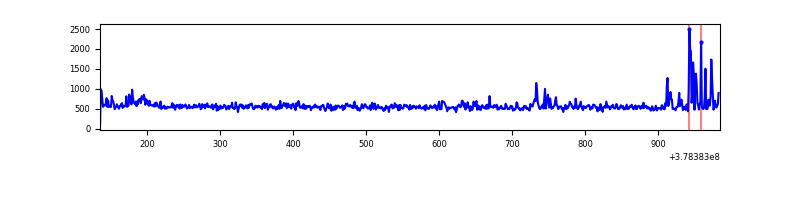 |
| C | 850 | 850 | 11 | 11 | 1.29% | 1.29% | 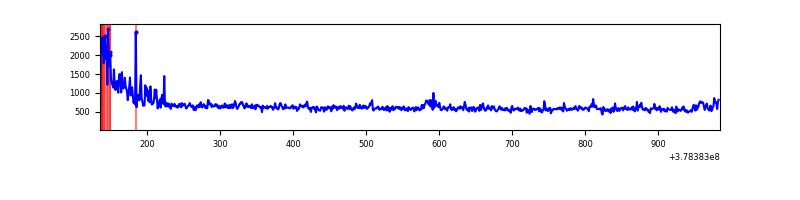 |
| D | 850 | 850 | 6 | 6 | 0.71% | 0.71% | 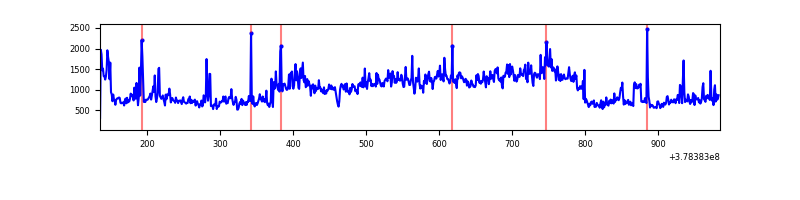 |
Top three noisy pixels from each quadrant. If the there are fewer than three noisy pixels in the level2.evt file, extra rows are filled as -1
| Pixel properties | Quadrant properties | ||||||
|---|---|---|---|---|---|---|---|
| Quadrant | DetID | PixID | Counts | Sigma | Mean | Median | Sigma |
| A | 15 | 237 | 572196 | 24919.61 | 107 | 105 | 23.0 |
| A | 10 | 83 | 4378 | 186.13 | 107 | 105 | 23.0 |
| A | 13 | 6 | 1807 | 74.14 | 107 | 105 | 23.0 |
| B | 5 | 172 | 29161 | 1229.93 | 114 | 112 | 23.6 |
| B | 15 | 222 | 5234 | 216.86 | 114 | 112 | 23.6 |
| B | 0 | 197 | 2801 | 113.85 | 114 | 112 | 23.6 |
| C | 0 | 10 | 51654 | 1872.58 | 112 | 113 | 27.5 |
| C | 15 | 214 | 42509 | 1540.32 | 112 | 113 | 27.5 |
| C | 4 | 254 | 21189 | 765.73 | 112 | 113 | 27.5 |
| D | 8 | 195 | 290566 | 10035.25 | 114 | 111 | 28.9 |
| D | 12 | 235 | 73007 | 2518.56 | 114 | 111 | 28.9 |
| D | 2 | 250 | 35431 | 1220.31 | 114 | 111 | 28.9 |
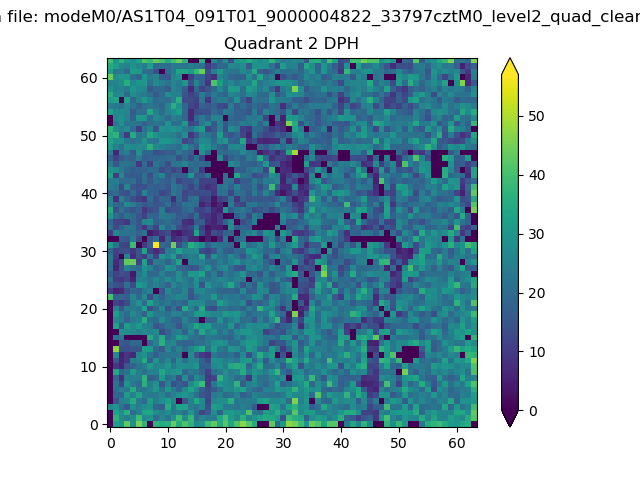
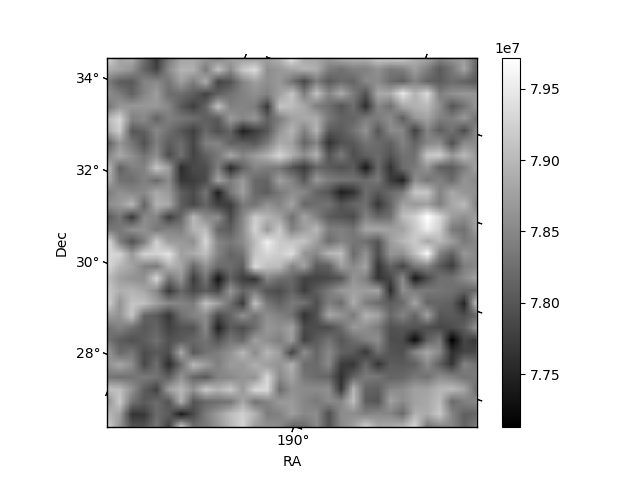
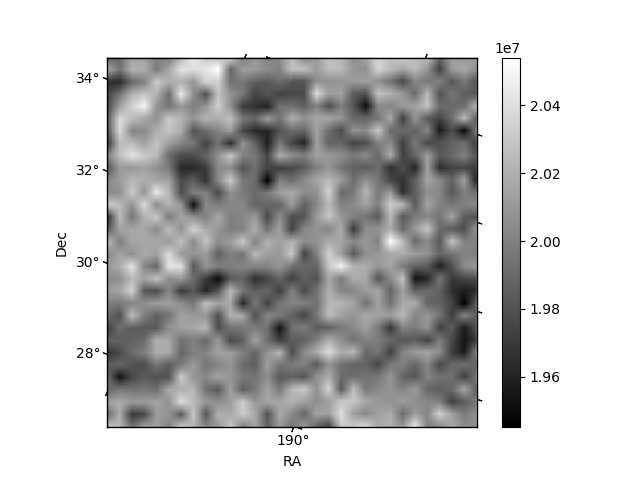
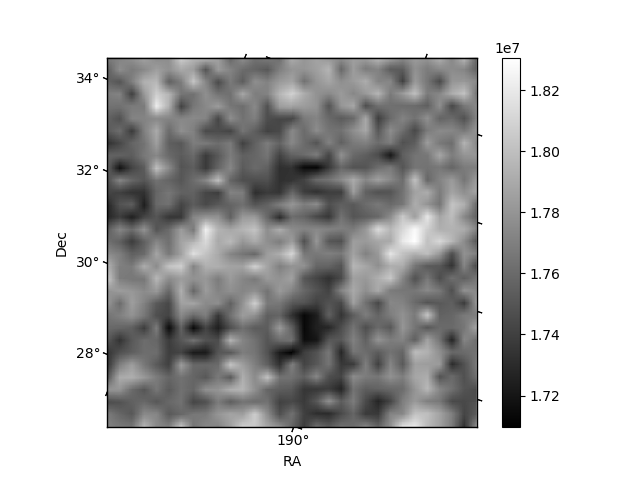
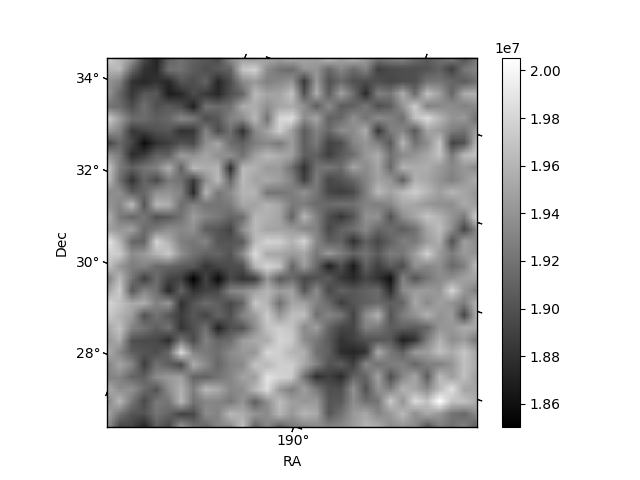
Histogram calculated using DETX and DETY for each event in the final _common_clean file
| Quadrant A | 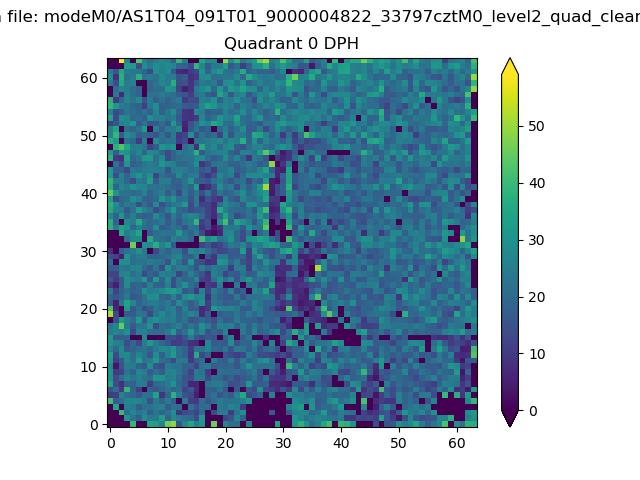 |
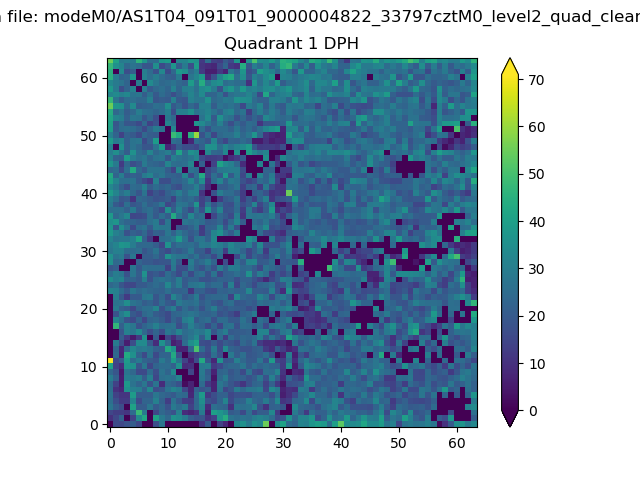 |
Quadrant B |
|---|---|---|---|
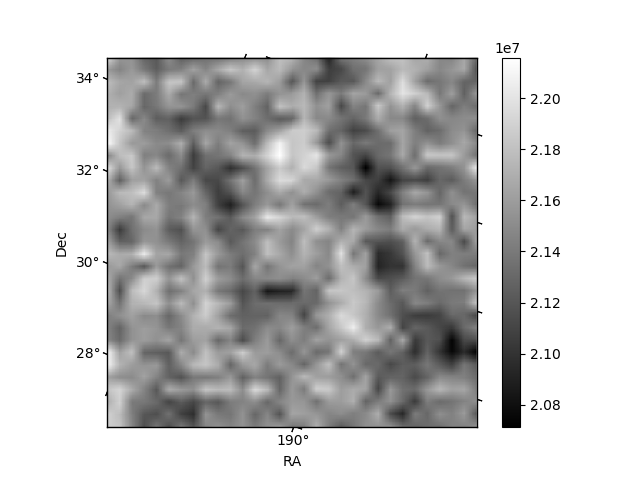
| Quadrant D | 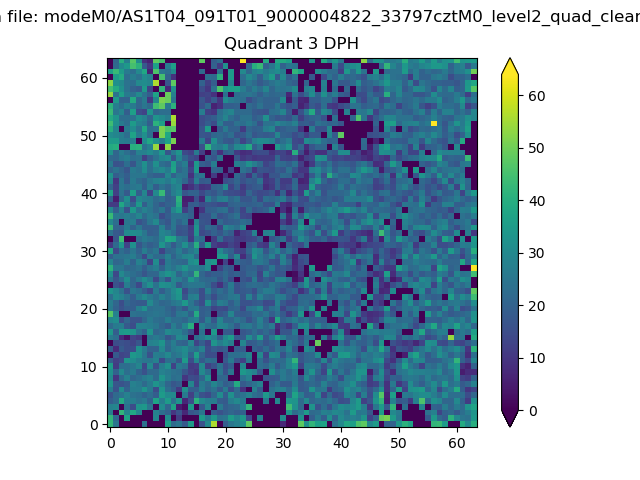 |
 |
Quadrant C |
| Plot type | Count rate plots | Images |
|---|---|---|
| Comparison with Poisson distribution Blue bars denote a histogram of data divided into 1 sec bins. Red curve is a Poisson curve with rate = median count rate of data. |
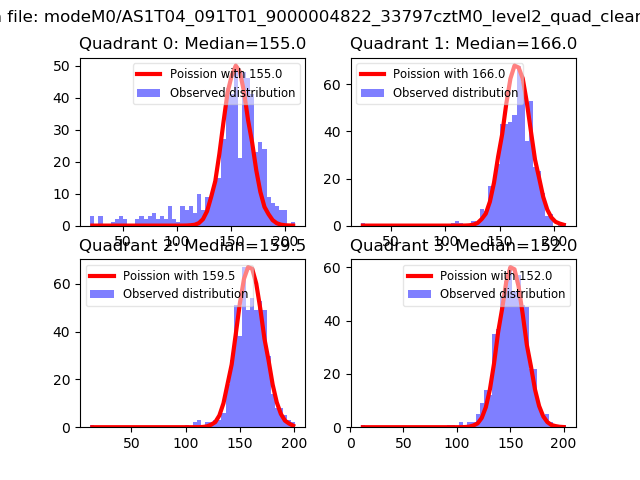 |
 |
| Quadrant-wise count rates Data is divided into 100 sec bins |
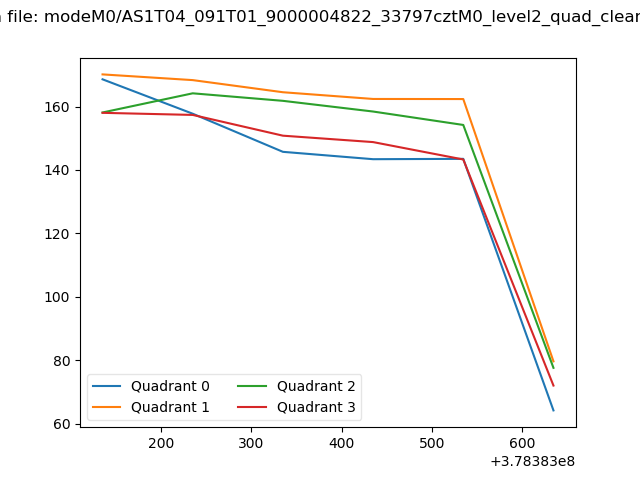 |
|
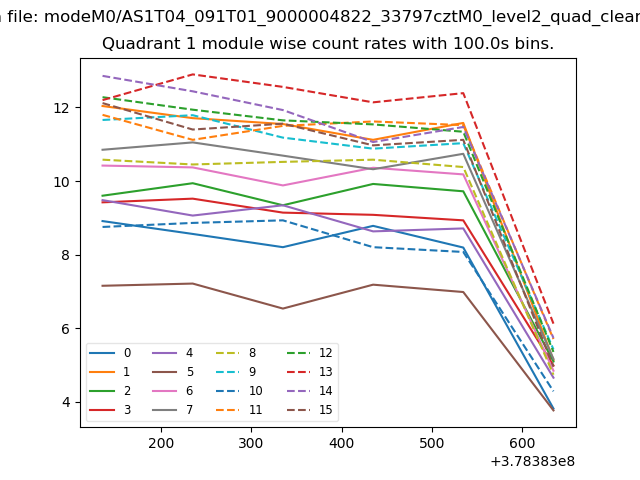
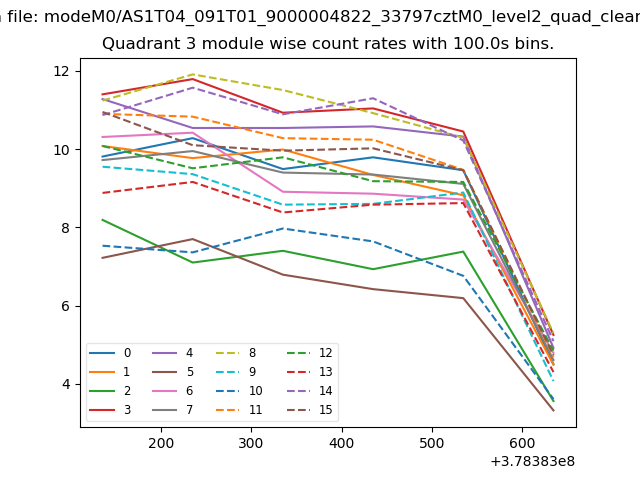
| Module-wise count rates for Quadrant A Data is divided into 100 sec bins |
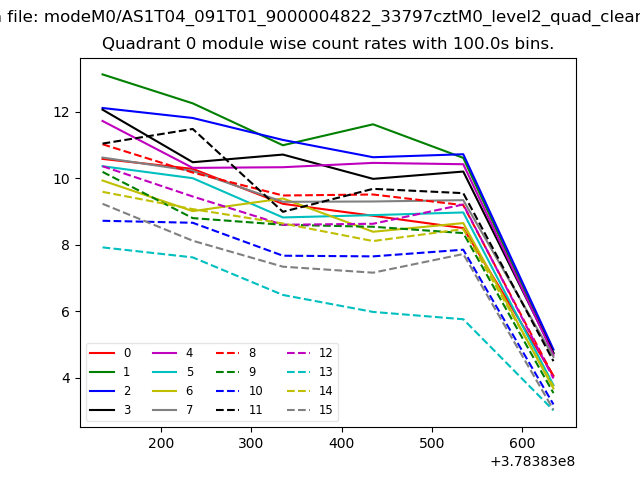 |
 |
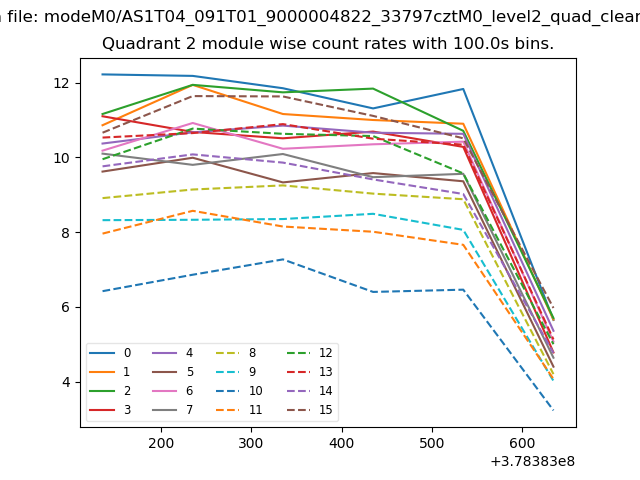
| Module-wise count rates for Quadrant B Data is divided into 100 sec bins |
 |
 |
| Module-wise count rates for Quadrant C Data is divided into 100 sec bins |
 |
 |
| Module-wise count rates for Quadrant D Data is divided into 100 sec bins |
 |
 |
| Parameter | Plot |
|---|---|
| CZT HV Monitor | 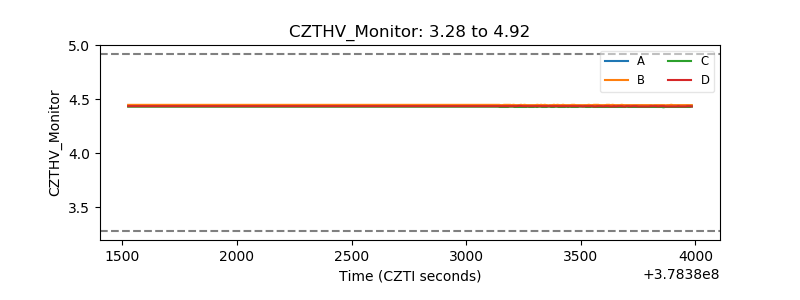 |
| D_VDD | 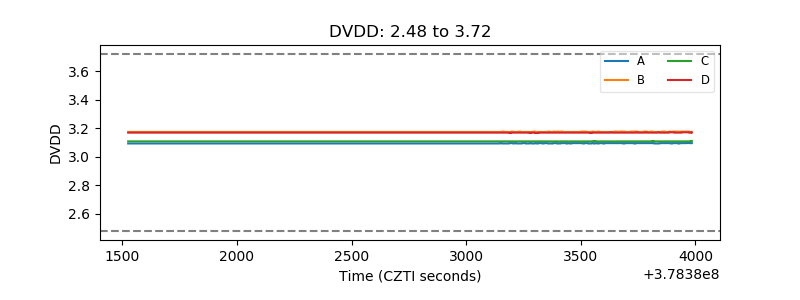 |
| Temperature 1 | 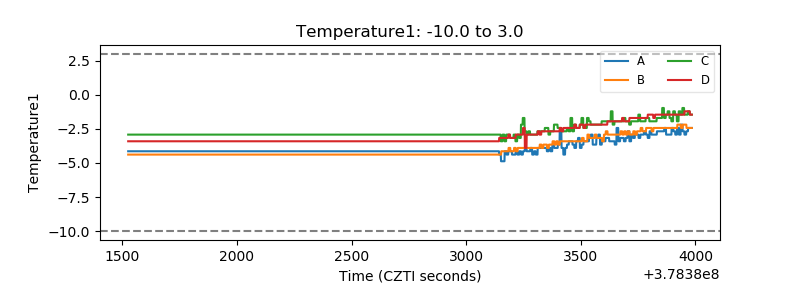 |
| Veto HV Monitor | 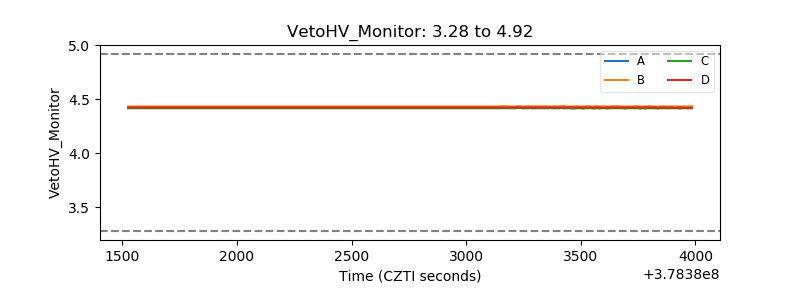 |
| Veto LLD | 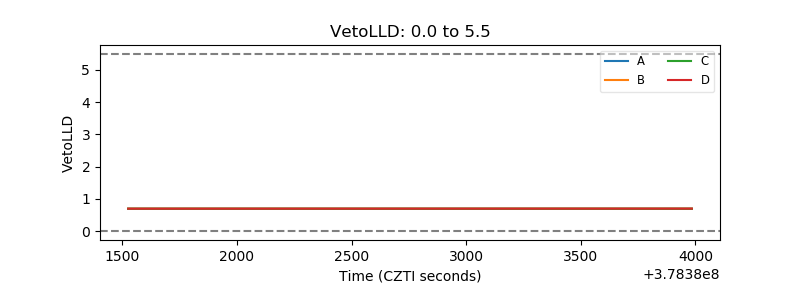 |
| Alpha Counter | 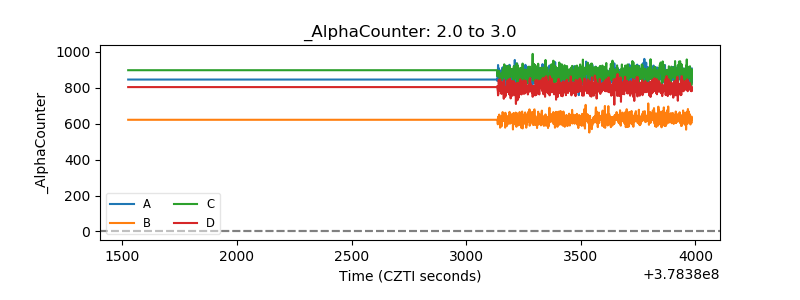 |
| _CPM_Rate | 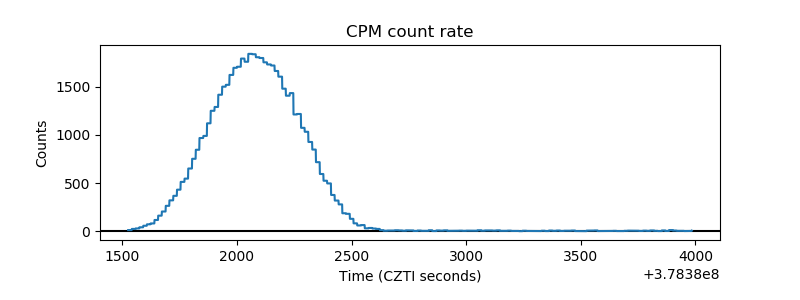 |
| CZT Counter | 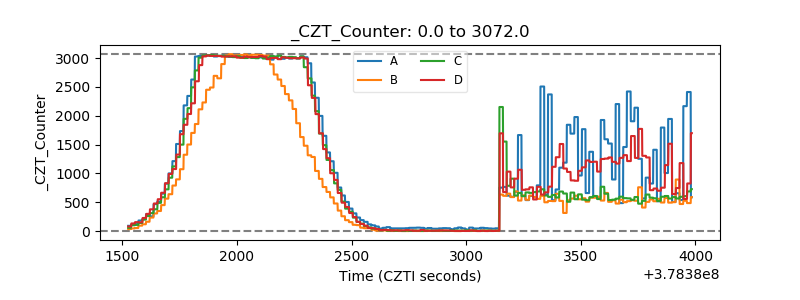 |
| +2.5 Volts monitor |  |
| +5 Volts monitor | 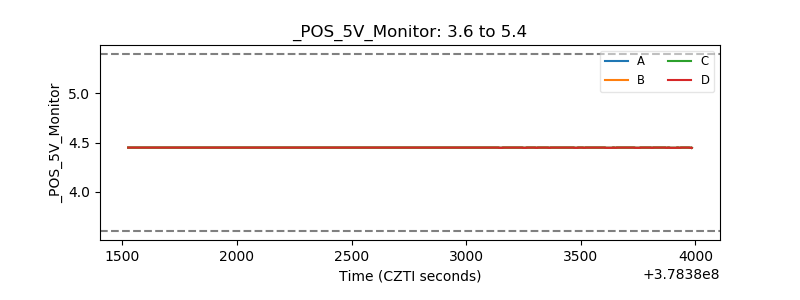 |
| _ROLL_ROT | 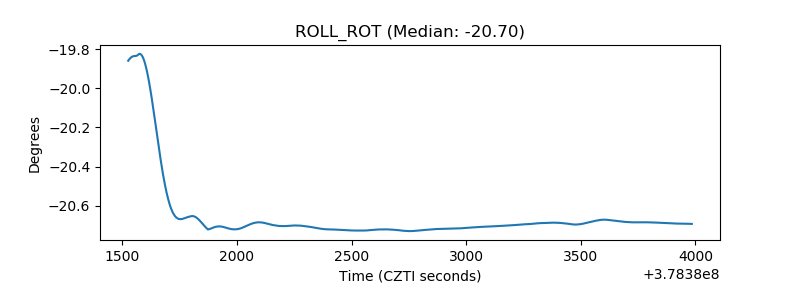 |
| _Roll_DEC | 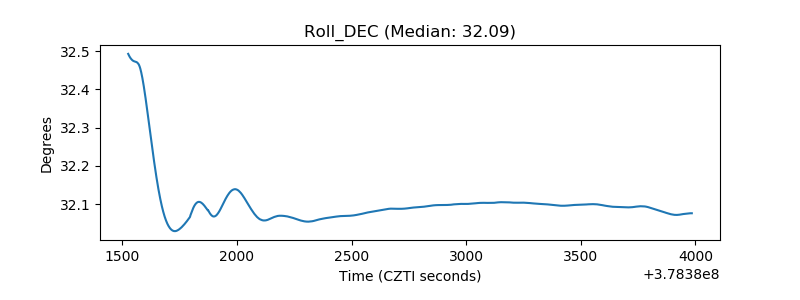 |
| _Roll_RA | 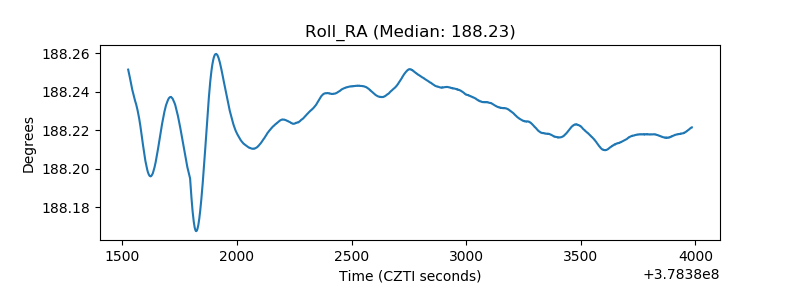 |
| Veto Counter | 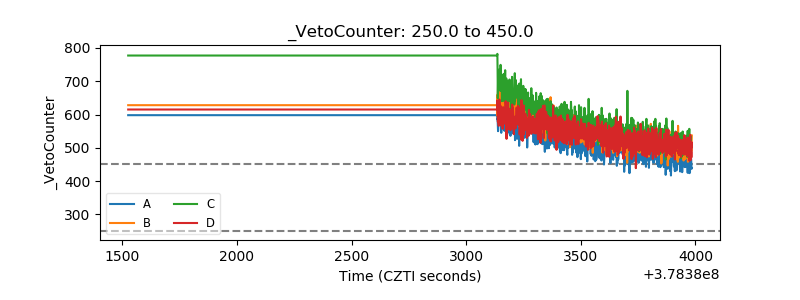 |