| Param | Original file | Final file |
|---|---|---|
| Filename | modeM0/AS1T04_091T01_9000004822_33798cztM0_level2.evt | modeM0/AS1T04_091T01_9000004822_33798cztM0_level2_quad_clean.evt |
| Size (bytes) | 631,451,520 | 54,351,360 |
| Size | 602.2 MB | 51.8 MB |
| Events in quadrant A | 5,390,894 | 307,725 |
| Events in quadrant B | 3,184,509 | 338,631 |
| Events in quadrant C | 3,226,683 | 334,974 |
| Events in quadrant D | 6,975,971 | 304,510 |
| Mode SS | |||
|---|---|---|---|
| Quadrant | BADHDUFLAG | Total packets | Discarded packets |
| A | 0 | 104 | 0 |
| B | 0 | 104 | 0 |
| C | 0 | 104 | 0 |
| D | 0 | 104 | 0 |
| Mode M0 | |||
|---|---|---|---|
| Quadrant | BADHDUFLAG | Total packets | Discarded packets |
| A | 0 | 19451 | 3 |
| B | 0 | 12571 | 2 |
| C | 0 | 13063 | 2 |
| D | 0 | 24367 | 2 |
| Mode M9 | |||
|---|---|---|---|
| Quadrant | BADHDUFLAG | Total packets | Discarded packets |
| A | 0 | 23 | 0 |
| B | 0 | 23 | 0 |
| C | 0 | 23 | 0 |
| D | 0 | 24 | 0 |
| Quadrant | Total seconds | Saturated seconds | Saturation percentage |
|---|---|---|---|
| A | 5126 | 1034 | 20.171674% |
| B | 5126 | 88 | 1.716738% |
| C | 5126 | 47 | 0.916894% |
| D | 5126 | 546 | 10.651580% |
Noise dominated data is calculated using 1-second bins in cleaned event files. If a bin has >2000 counts, and if more than 50% of those come from <1% of pixels, then it is considered to be noise-dominated and hence unusable.
| Quadrant | # 1 sec bins | Bins with >0 counts | Bins with >2000 counts | High rate bins dominated by noise | Noise dominated (total time) | Noise dominated (detector-on time) | Marked lightcurve |
|---|---|---|---|---|---|---|---|
| A | 7068 | 5127 | 767 | 767 | 10.85% | 14.96% | 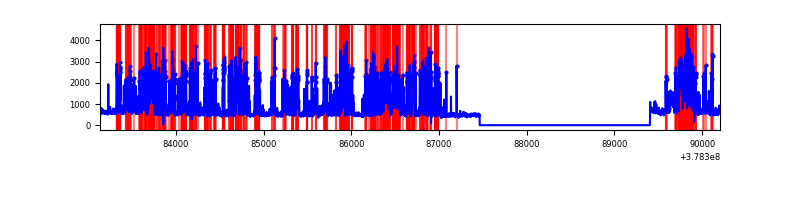 |
| B | 7068 | 5127 | 48 | 48 | 0.68% | 0.94% | 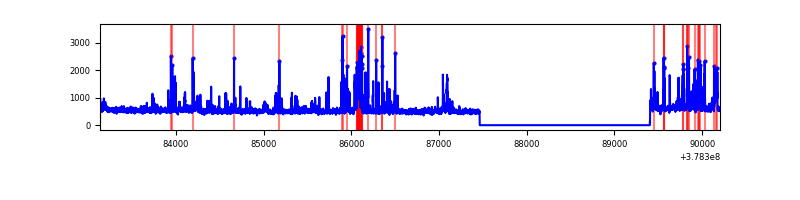 |
| C | 7068 | 5127 | 35 | 35 | 0.50% | 0.68% | 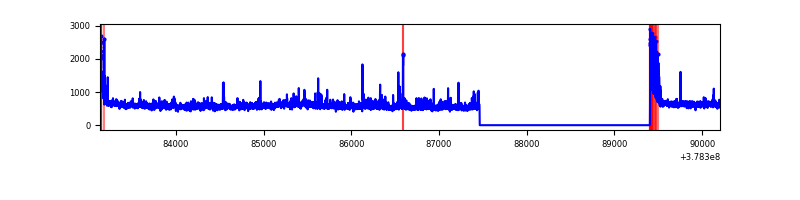 |
| D | 7068 | 5127 | 562 | 562 | 7.95% | 10.96% | 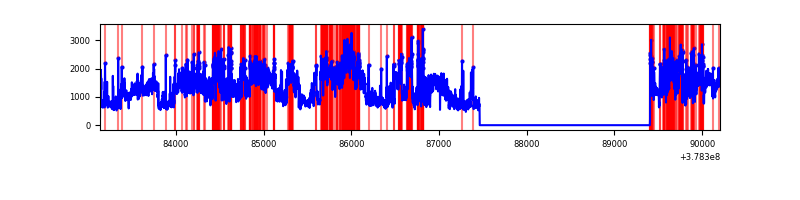 |
Top three noisy pixels from each quadrant. If the there are fewer than three noisy pixels in the level2.evt file, extra rows are filled as -1
| Pixel properties | Quadrant properties | ||||||
|---|---|---|---|---|---|---|---|
| Quadrant | DetID | PixID | Counts | Sigma | Mean | Median | Sigma |
| A | 15 | 237 | 3029958 | 24996.27 | 604 | 594 | 121.2 |
| A | 10 | 83 | 9903 | 76.81 | 604 | 594 | 121.2 |
| A | 13 | 6 | 9739 | 75.46 | 604 | 594 | 121.2 |
| B | 5 | 172 | 337758 | 2751.27 | 653 | 638 | 122.5 |
| B | 4 | 251 | 50805 | 409.42 | 653 | 638 | 122.5 |
| B | 5 | 255 | 45802 | 368.59 | 653 | 638 | 122.5 |
| C | 15 | 214 | 227271 | 1542.1 | 645 | 653 | 147.0 |
| C | 4 | 254 | 159173 | 1078.7 | 645 | 653 | 147.0 |
| C | 0 | 10 | 156601 | 1061.2 | 645 | 653 | 147.0 |
| D | 8 | 195 | 2650584 | 17019.98 | 634 | 618 | 155.7 |
| D | 12 | 235 | 471004 | 3021.16 | 634 | 618 | 155.7 |
| D | 2 | 250 | 408986 | 2622.83 | 634 | 618 | 155.7 |
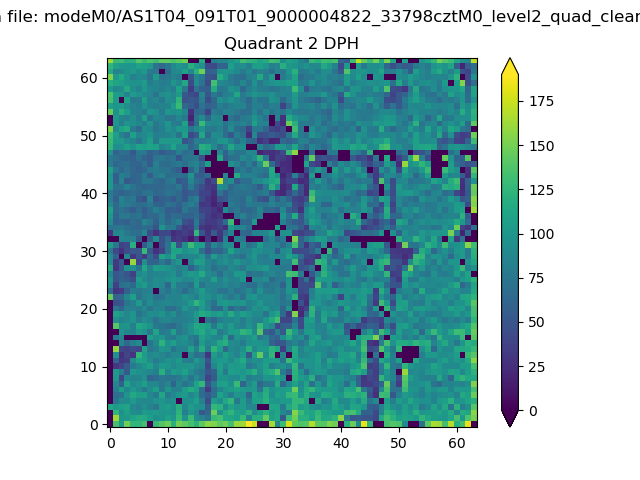
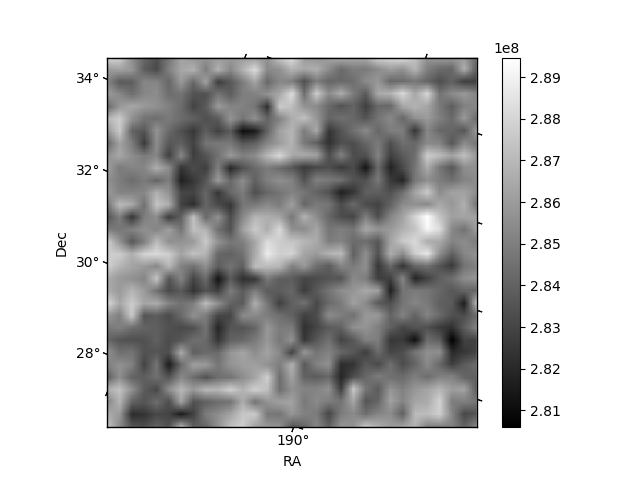
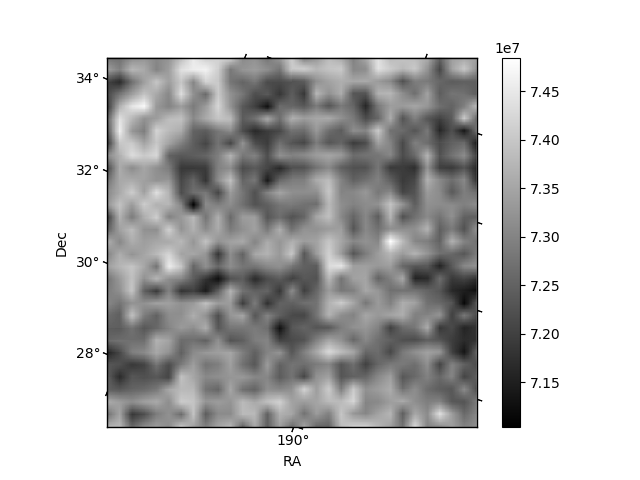
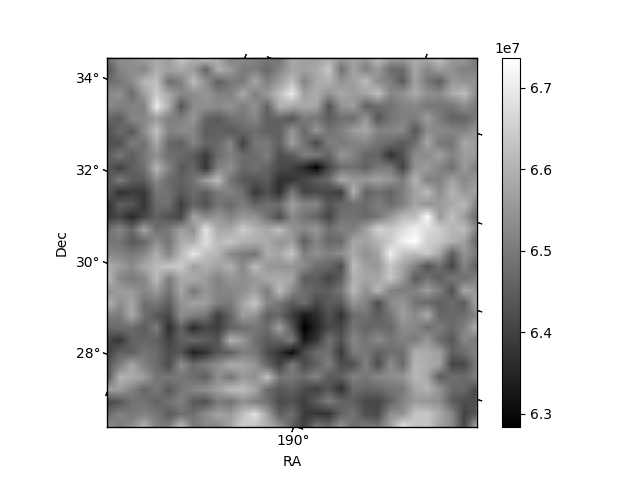
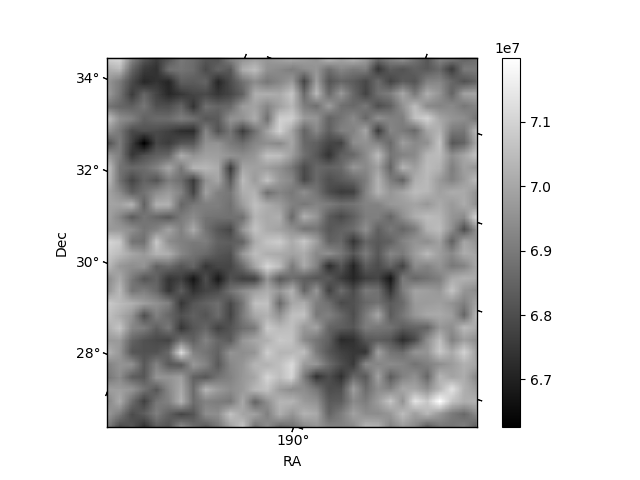
Histogram calculated using DETX and DETY for each event in the final _common_clean file
| Quadrant A | 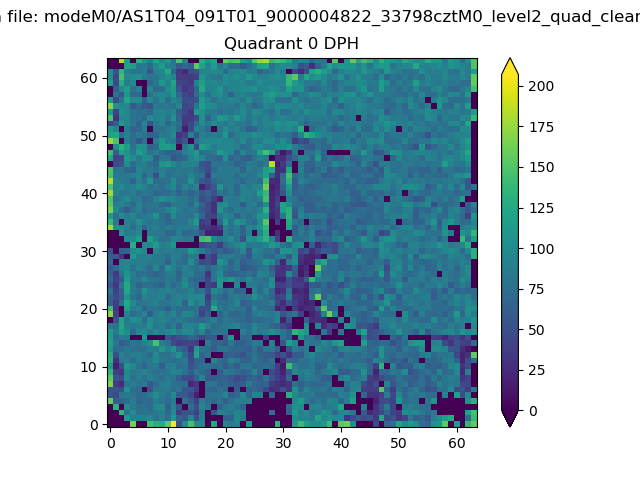 |
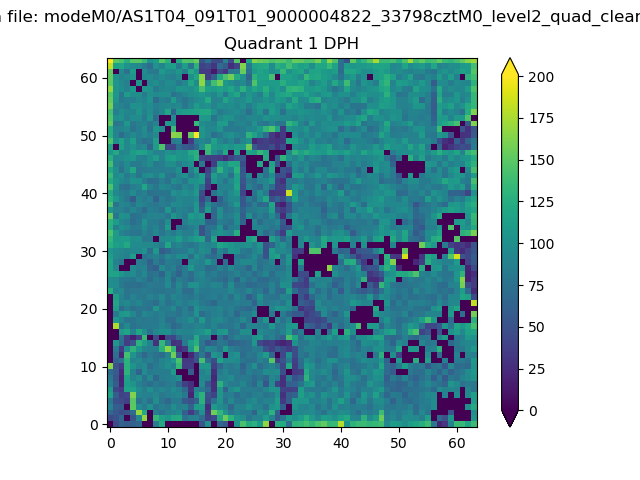 |
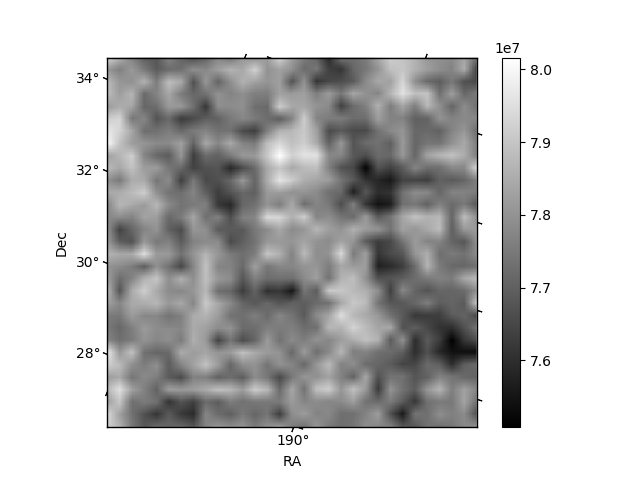
Quadrant B |
|---|---|---|---|
| Quadrant D | 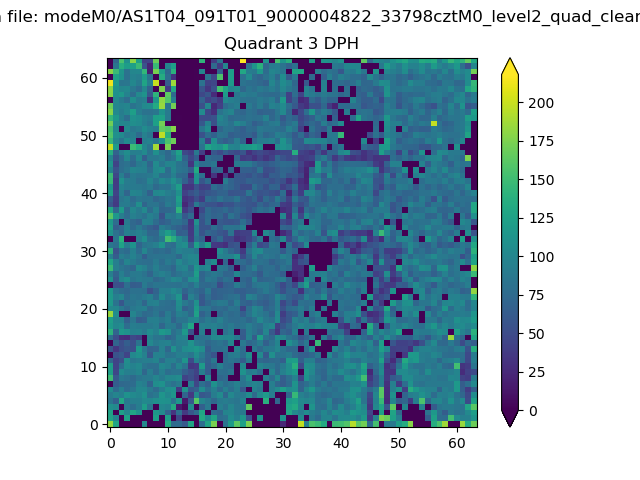 |
 |
Quadrant C |
| Plot type | Count rate plots | Images |
|---|---|---|
| Comparison with Poisson distribution Blue bars denote a histogram of data divided into 1 sec bins. Red curve is a Poisson curve with rate = median count rate of data. |
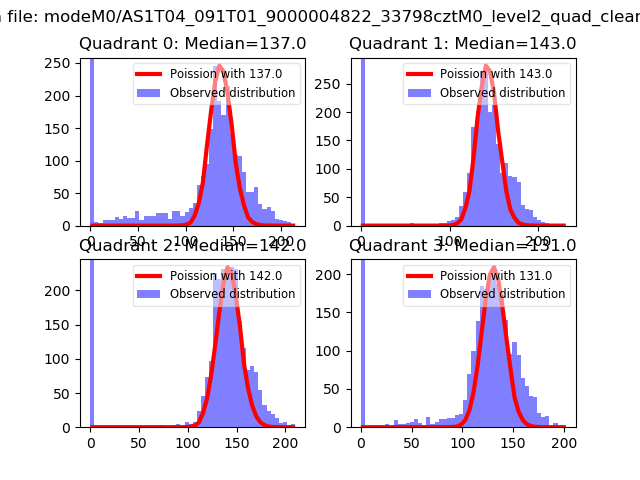 |
 |
| Quadrant-wise count rates Data is divided into 100 sec bins |
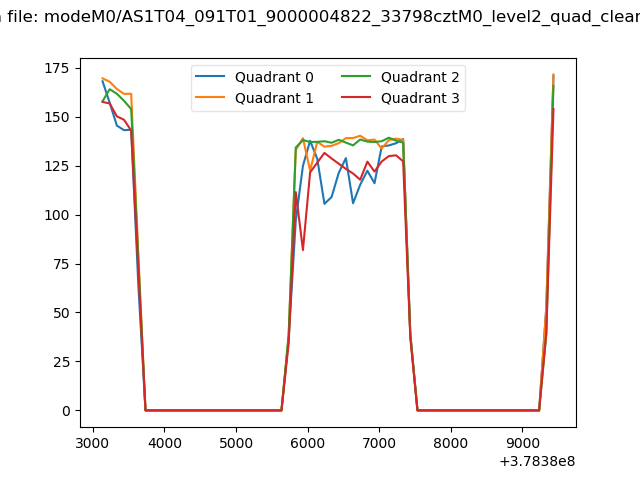 |
|
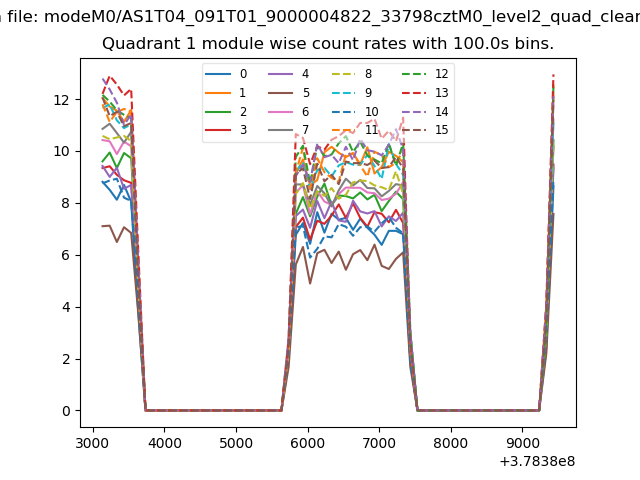
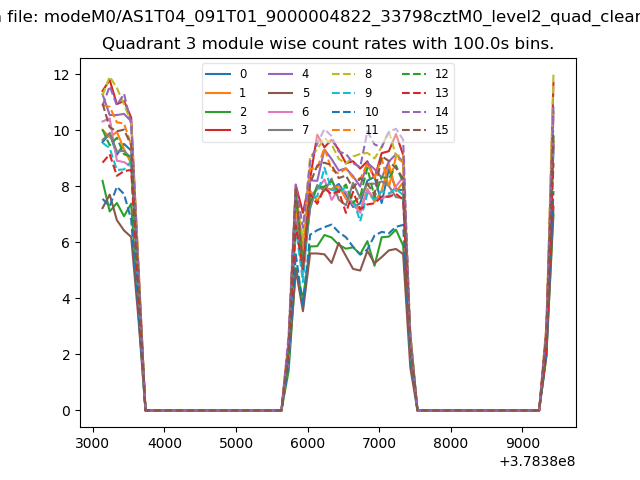
| Module-wise count rates for Quadrant A Data is divided into 100 sec bins |
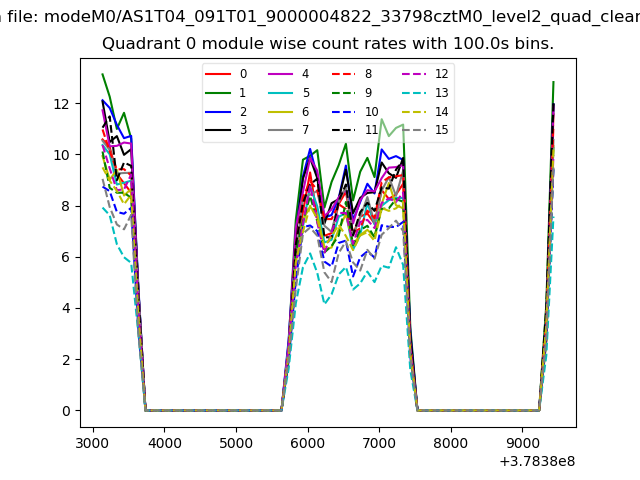 |
 |
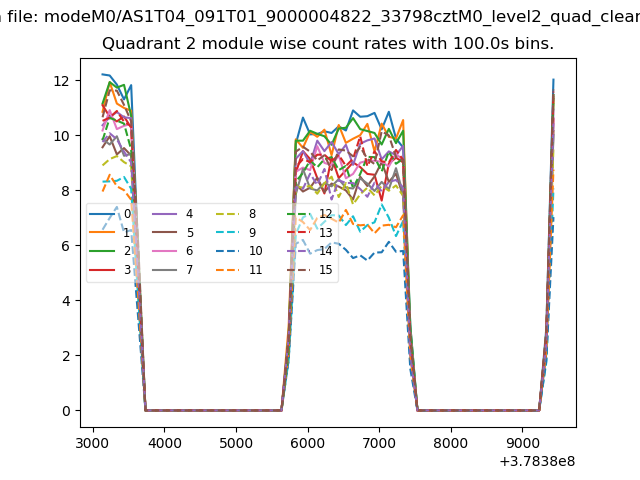
| Module-wise count rates for Quadrant B Data is divided into 100 sec bins |
 |
 |
| Module-wise count rates for Quadrant C Data is divided into 100 sec bins |
 |
 |
| Module-wise count rates for Quadrant D Data is divided into 100 sec bins |
 |
 |
| Parameter | Plot |
|---|---|
| CZT HV Monitor | 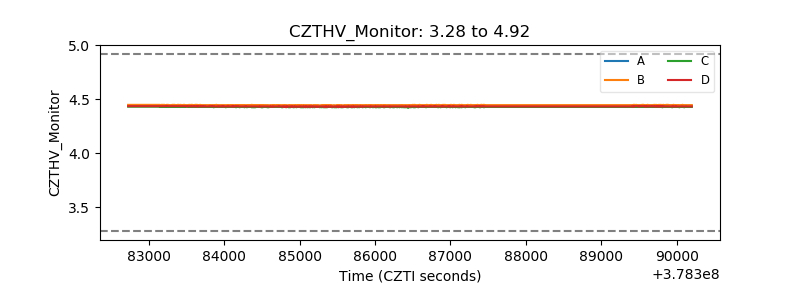 |
| D_VDD | 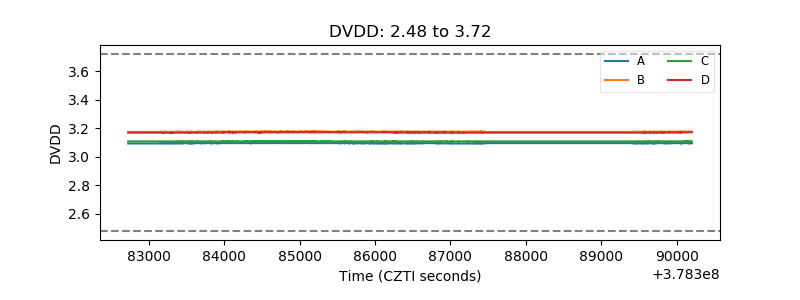 |
| Temperature 1 | 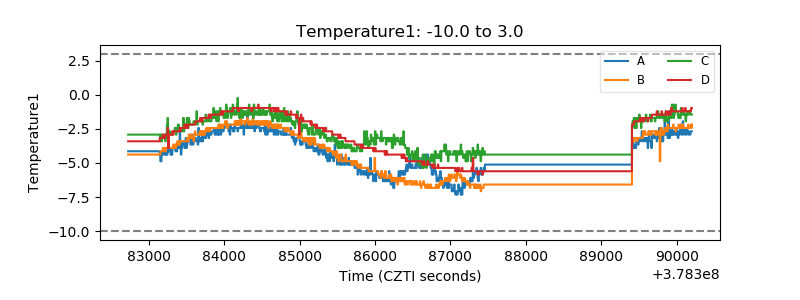 |
| Veto HV Monitor | 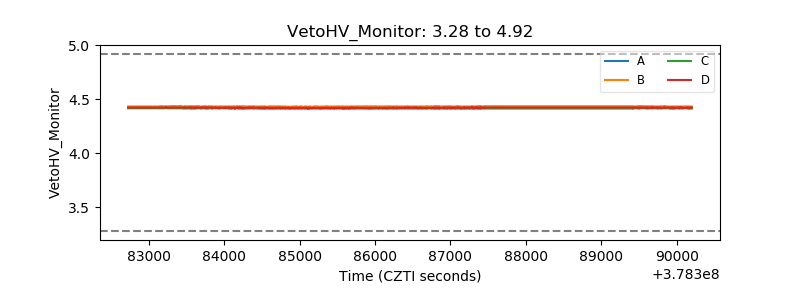 |
| Veto LLD | 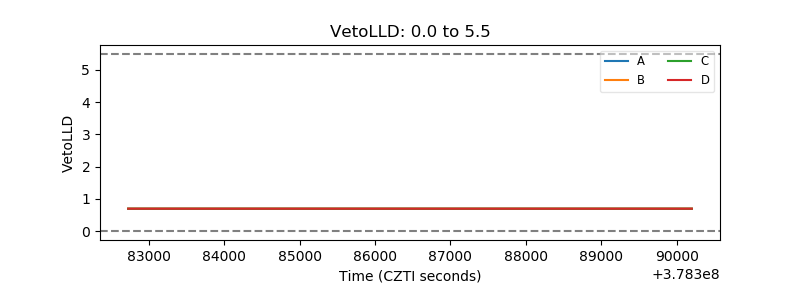 |
| Alpha Counter | 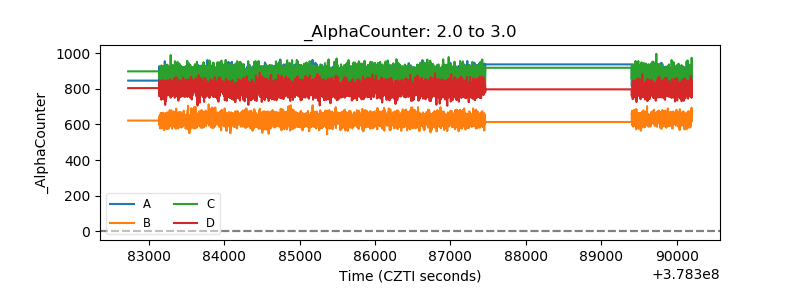 |
| _CPM_Rate | 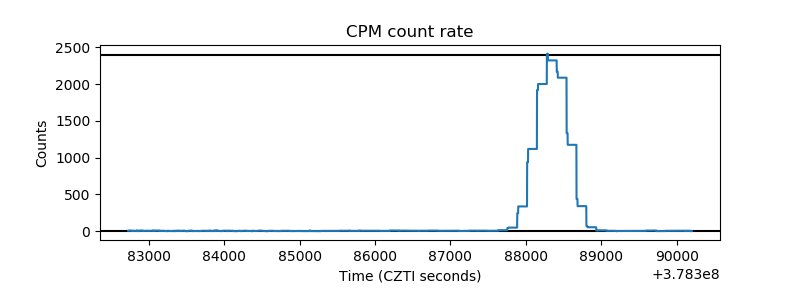 |
| CZT Counter | 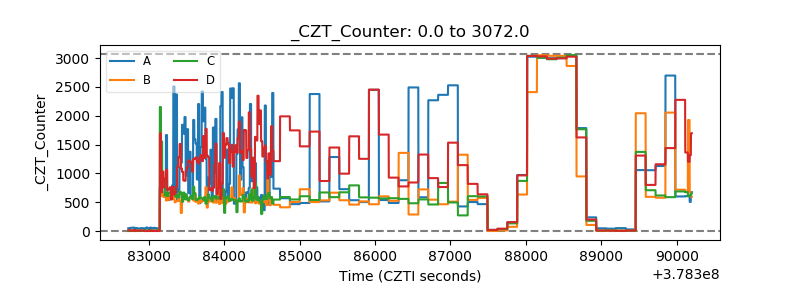 |
| +2.5 Volts monitor | 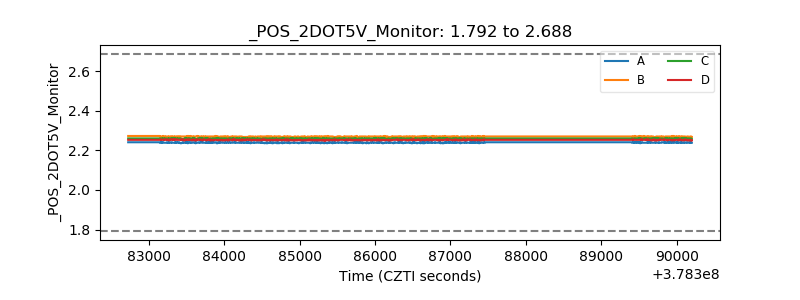 |
| +5 Volts monitor | 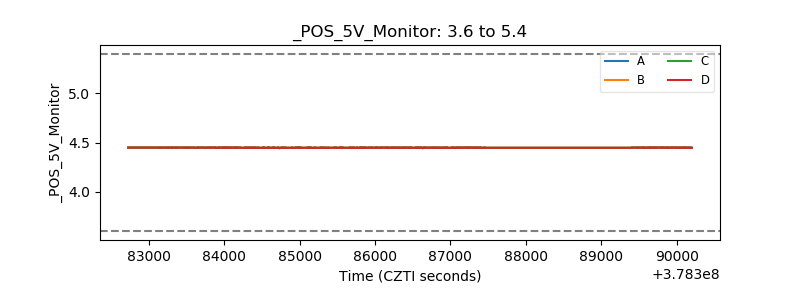 |
| _ROLL_ROT | 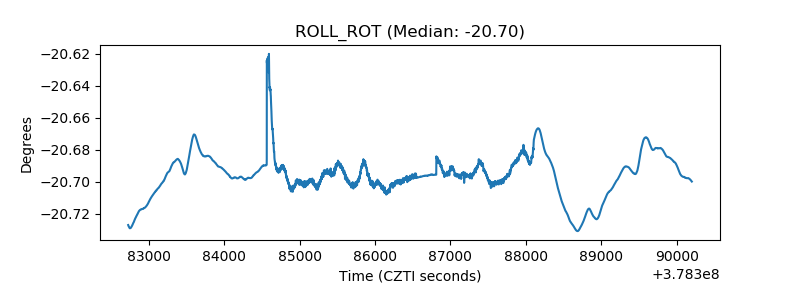 |
| _Roll_DEC |  |
| _Roll_RA | 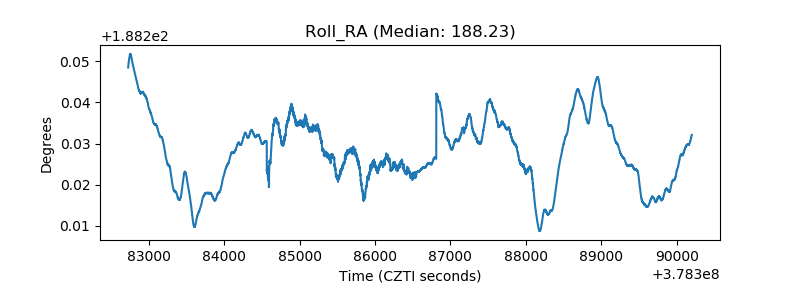 |
| Veto Counter | 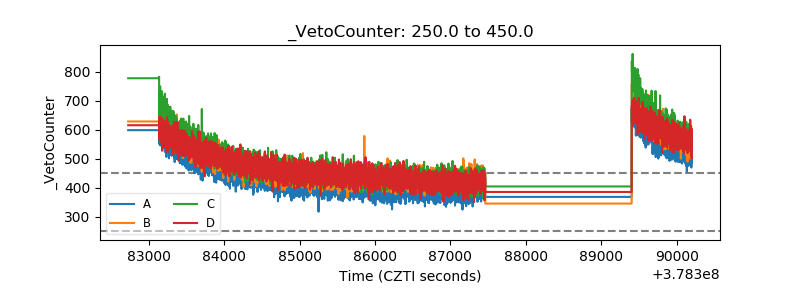 |