| Param | Original file | Final file |
|---|---|---|
| Filename | modeM0/AS1T04_091T01_9000004822_33799cztM0_level2.evt | modeM0/AS1T04_091T01_9000004822_33799cztM0_level2_quad_clean.evt |
| Size (bytes) | 627,647,040 | 50,616,000 |
| Size | 598.6 MB | 48.3 MB |
| Events in quadrant A | 5,564,829 | 282,562 |
| Events in quadrant B | 3,784,444 | 298,092 |
| Events in quadrant C | 3,517,482 | 301,273 |
| Events in quadrant D | 5,788,328 | 283,208 |
| Mode SS | |||
|---|---|---|---|
| Quadrant | BADHDUFLAG | Total packets | Discarded packets |
| A | 0 | 106 | 0 |
| B | 0 | 106 | 0 |
| C | 0 | 106 | 0 |
| D | 0 | 106 | 0 |
| Mode M0 | |||
|---|---|---|---|
| Quadrant | BADHDUFLAG | Total packets | Discarded packets |
| A | 0 | 20068 | 3 |
| B | 0 | 14812 | 2 |
| C | 0 | 14192 | 2 |
| D | 0 | 20932 | 2 |
| Mode M9 | |||
|---|---|---|---|
| Quadrant | BADHDUFLAG | Total packets | Discarded packets |
| A | 0 | 22 | 0 |
| B | 0 | 22 | 0 |
| C | 0 | 22 | 0 |
| D | 0 | 23 | 0 |
| Quadrant | Total seconds | Saturated seconds | Saturation percentage |
|---|---|---|---|
| A | 5241 | 1091 | 20.816638% |
| B | 5241 | 219 | 4.178592% |
| C | 5241 | 122 | 2.327800% |
| D | 5241 | 278 | 5.304331% |
Noise dominated data is calculated using 1-second bins in cleaned event files. If a bin has >2000 counts, and if more than 50% of those come from <1% of pixels, then it is considered to be noise-dominated and hence unusable.
| Quadrant | # 1 sec bins | Bins with >0 counts | Bins with >2000 counts | High rate bins dominated by noise | Noise dominated (total time) | Noise dominated (detector-on time) | Marked lightcurve |
|---|---|---|---|---|---|---|---|
| A | 7305 | 5242 | 831 | 831 | 11.38% | 15.85% | 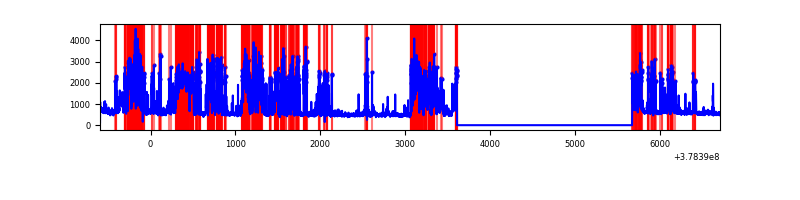 |
| B | 7305 | 5242 | 149 | 149 | 2.04% | 2.84% | 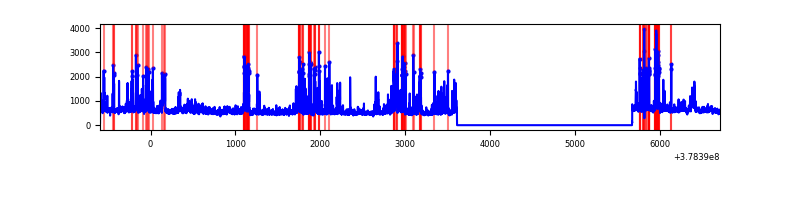 |
| C | 7305 | 5242 | 101 | 101 | 1.38% | 1.93% | 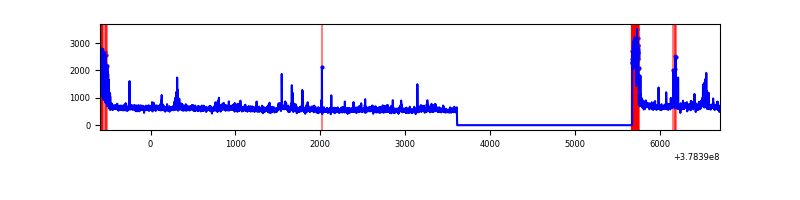 |
| D | 7305 | 5242 | 225 | 225 | 3.08% | 4.29% | 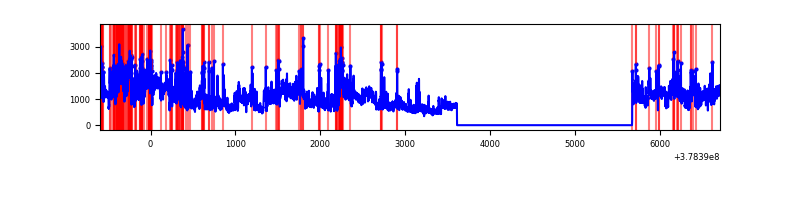 |
Top three noisy pixels from each quadrant. If the there are fewer than three noisy pixels in the level2.evt file, extra rows are filled as -1
| Pixel properties | Quadrant properties | ||||||
|---|---|---|---|---|---|---|---|
| Quadrant | DetID | PixID | Counts | Sigma | Mean | Median | Sigma |
| A | 15 | 237 | 3006254 | 23460.04 | 641 | 629 | 128.1 |
| A | 7 | 16 | 43687 | 336.08 | 641 | 629 | 128.1 |
| A | 13 | 6 | 25204 | 191.81 | 641 | 629 | 128.1 |
| B | 5 | 172 | 643243 | 5026.61 | 685 | 670 | 127.8 |
| B | 0 | 190 | 68068 | 527.23 | 685 | 670 | 127.8 |
| B | 15 | 85 | 67752 | 524.76 | 685 | 670 | 127.8 |
| C | 15 | 214 | 226013 | 1467.45 | 676 | 684 | 153.6 |
| C | 3 | 233 | 207578 | 1347.39 | 676 | 684 | 153.6 |
| C | 9 | 187 | 188424 | 1222.65 | 676 | 684 | 153.6 |
| D | 8 | 195 | 1939138 | 11723.61 | 678 | 661 | 165.3 |
| D | 2 | 250 | 381350 | 2302.35 | 678 | 661 | 165.3 |
| D | 1 | 47 | 334593 | 2019.57 | 678 | 661 | 165.3 |
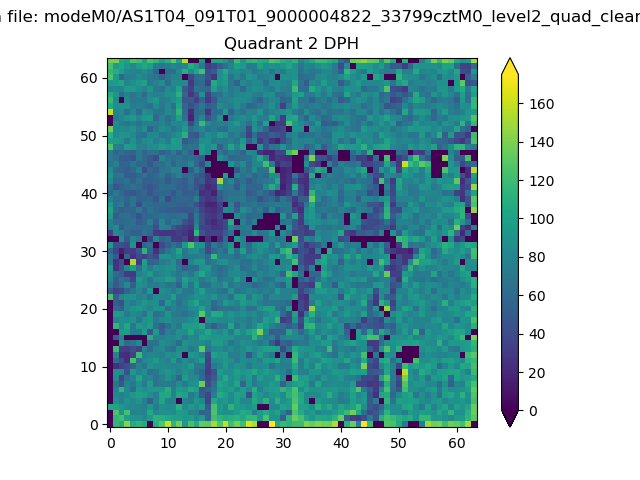
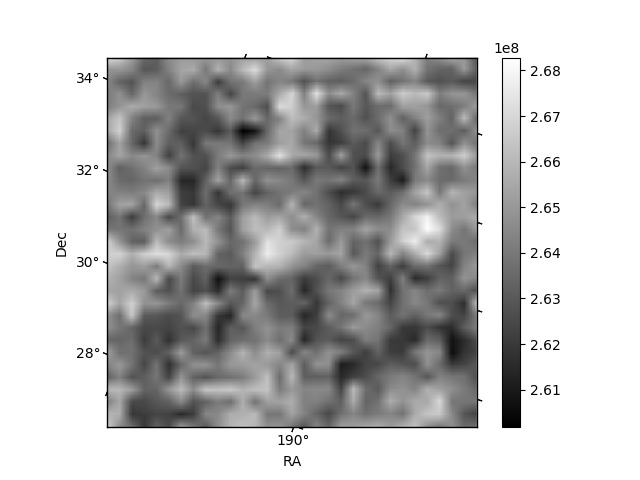
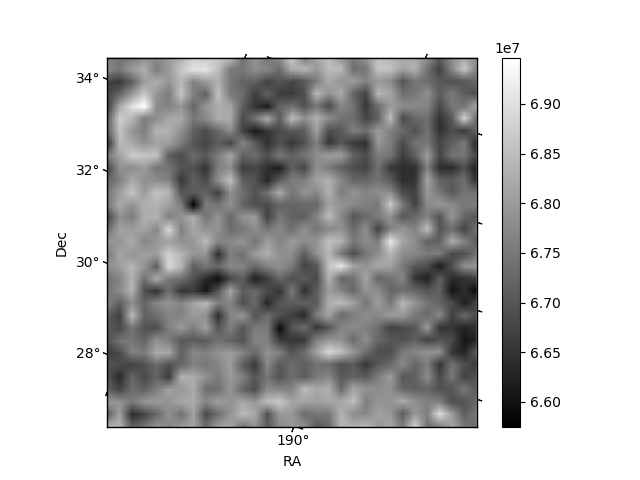
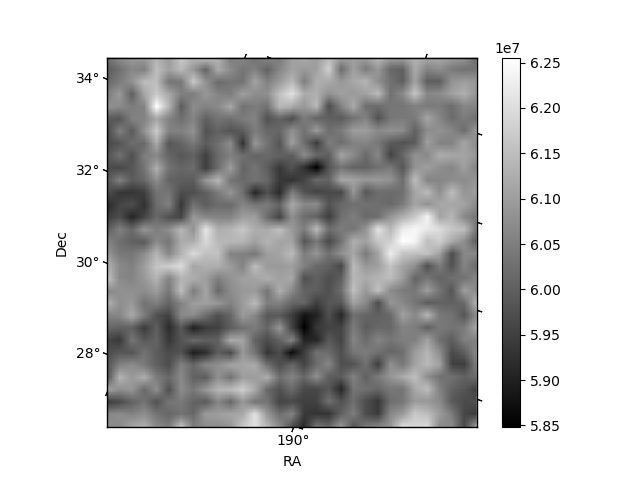
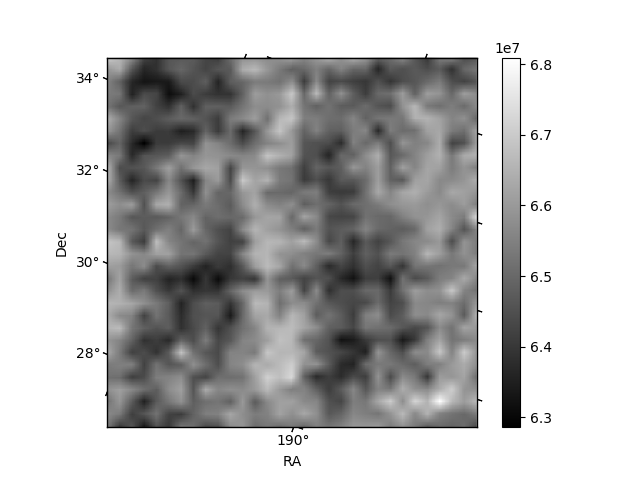
Histogram calculated using DETX and DETY for each event in the final _common_clean file
| Quadrant A | 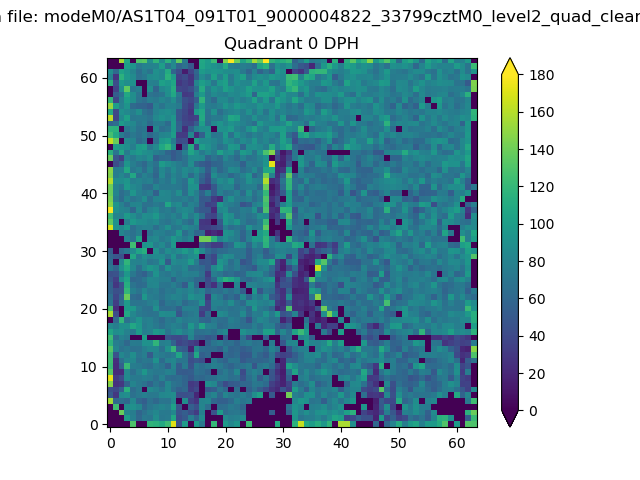 |
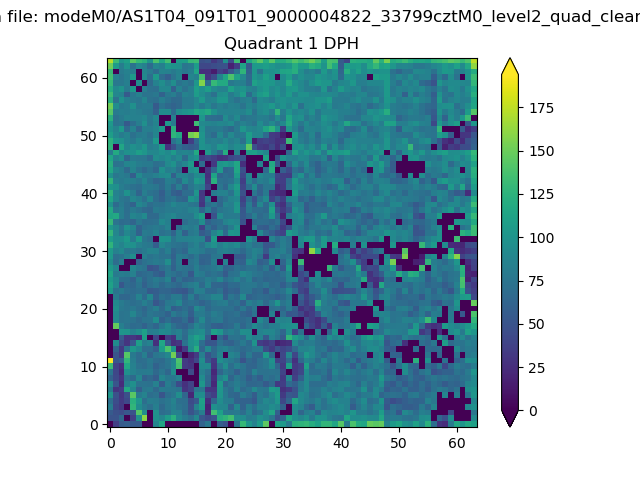 |
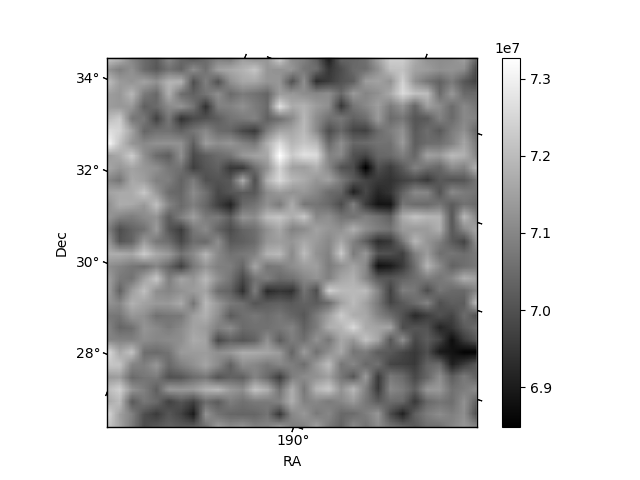
Quadrant B |
|---|---|---|---|
| Quadrant D | 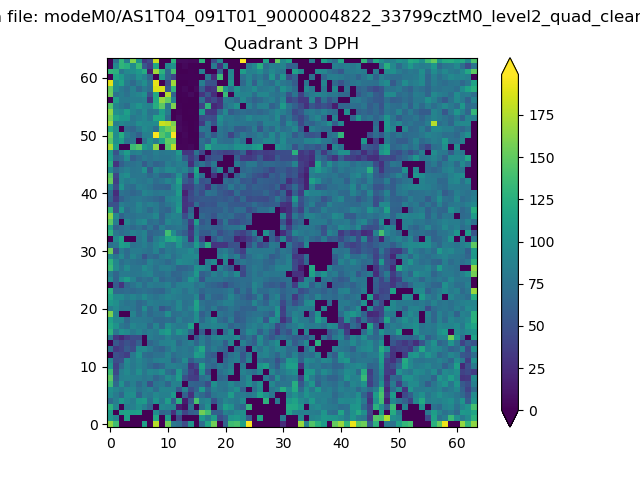 |
 |
Quadrant C |
| Plot type | Count rate plots | Images |
|---|---|---|
| Comparison with Poisson distribution Blue bars denote a histogram of data divided into 1 sec bins. Red curve is a Poisson curve with rate = median count rate of data. |
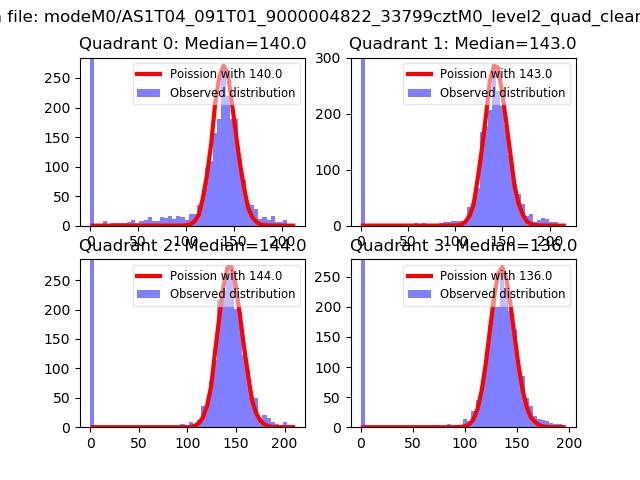 |
 |
| Quadrant-wise count rates Data is divided into 100 sec bins |
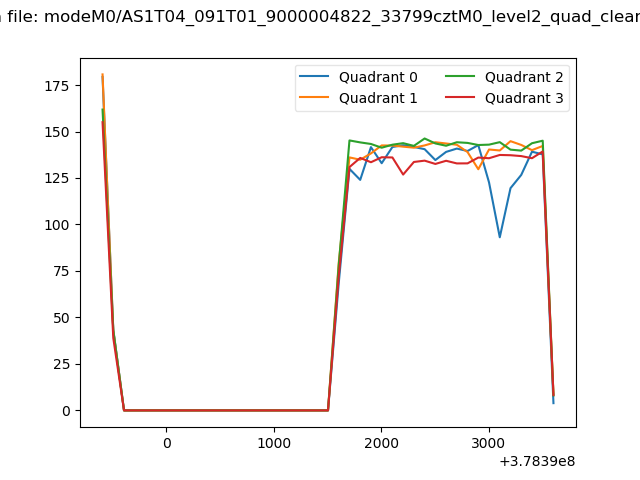 |
|
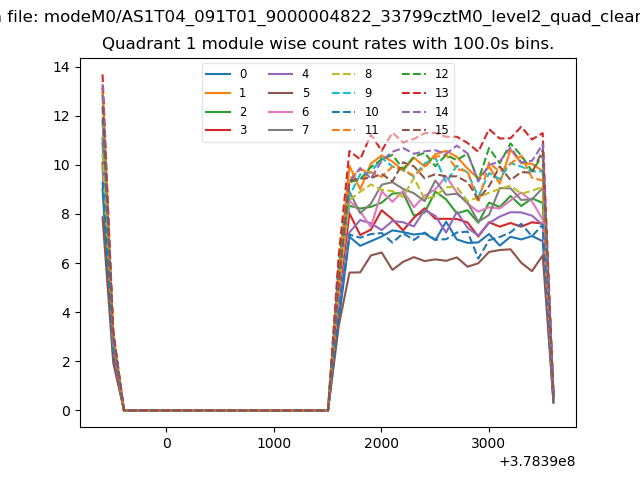
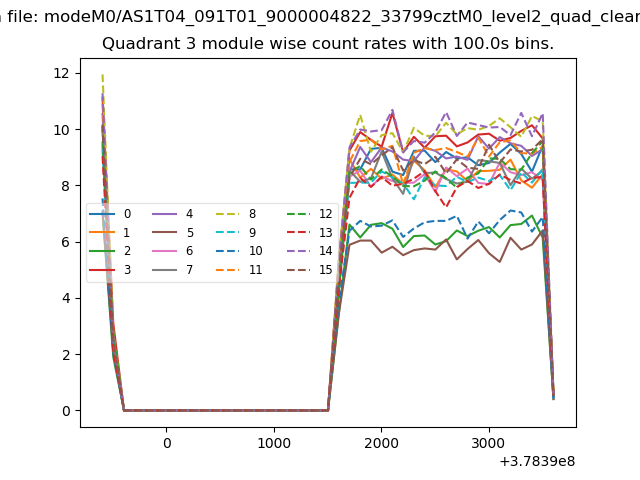
| Module-wise count rates for Quadrant A Data is divided into 100 sec bins |
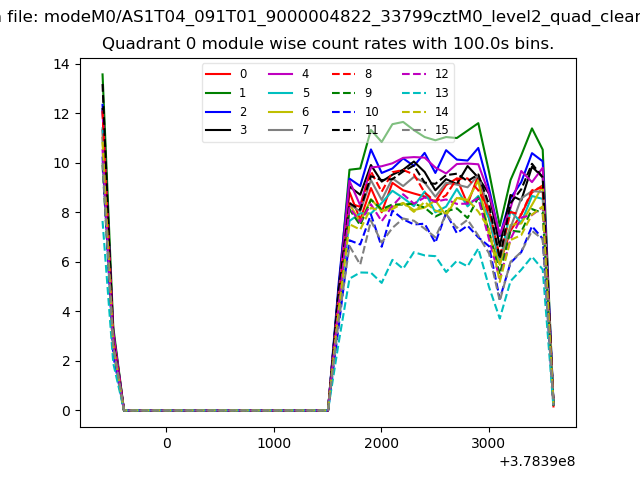 |
 |
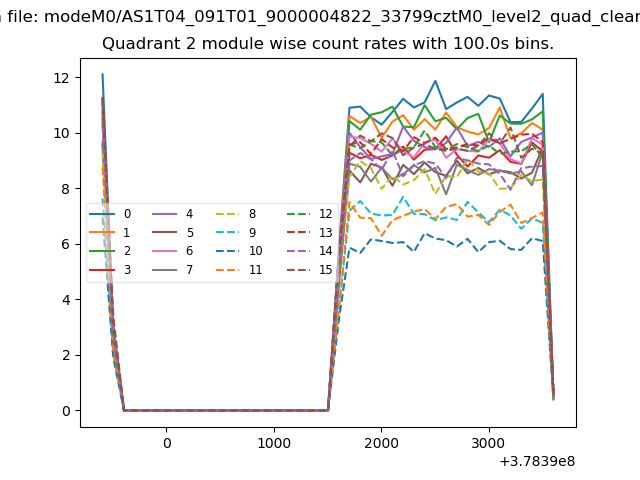
| Module-wise count rates for Quadrant B Data is divided into 100 sec bins |
 |
 |
| Module-wise count rates for Quadrant C Data is divided into 100 sec bins |
 |
 |
| Module-wise count rates for Quadrant D Data is divided into 100 sec bins |
 |
 |
| Parameter | Plot |
|---|---|
| CZT HV Monitor | 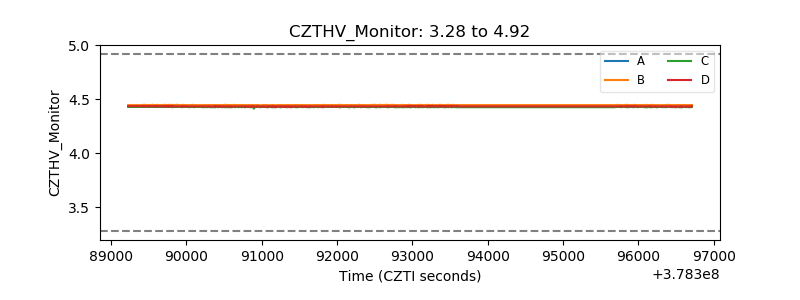 |
| D_VDD | 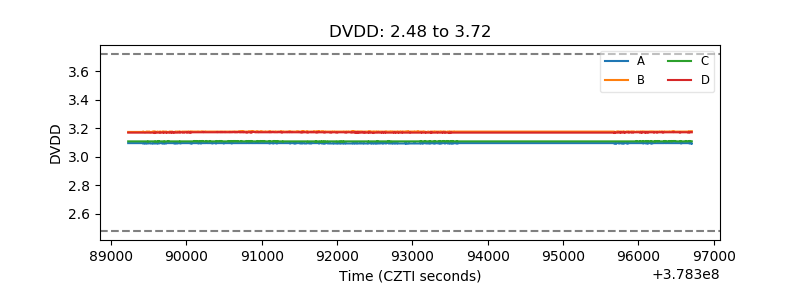 |
| Temperature 1 | 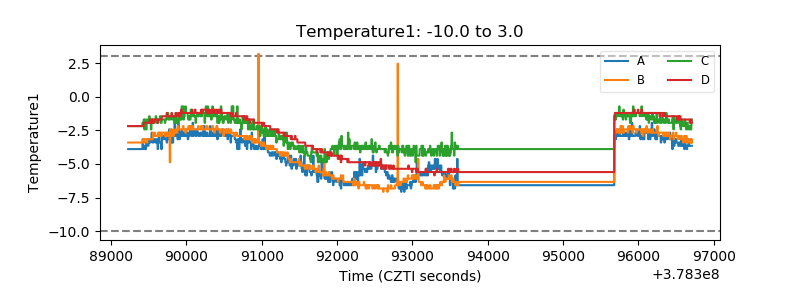 |
| Veto HV Monitor | 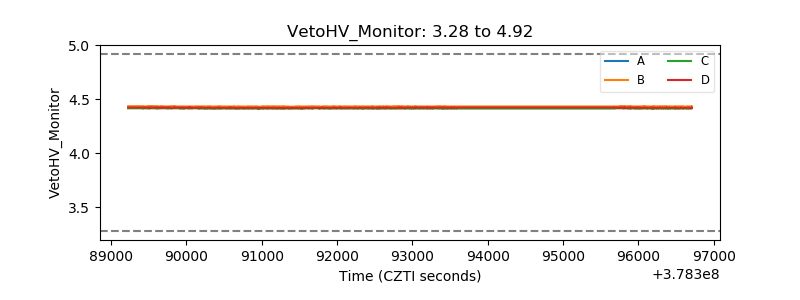 |
| Veto LLD | 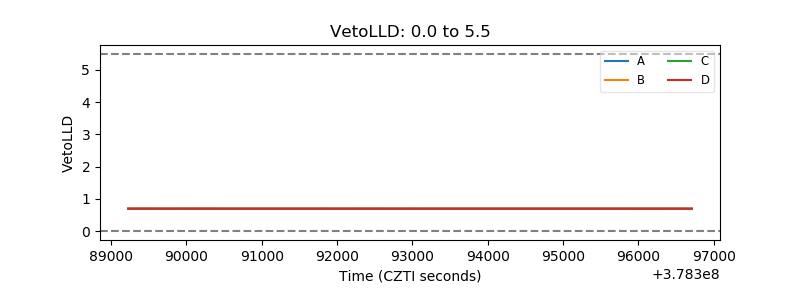 |
| Alpha Counter | 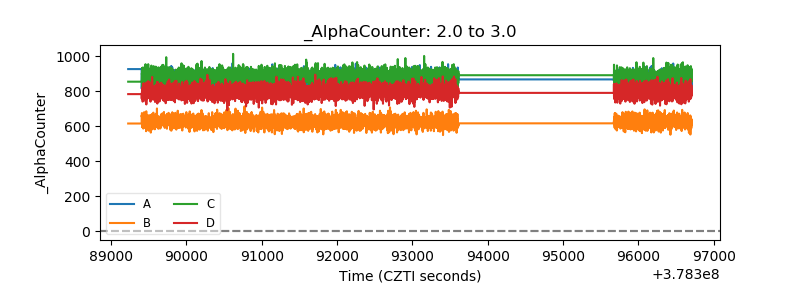 |
| _CPM_Rate | 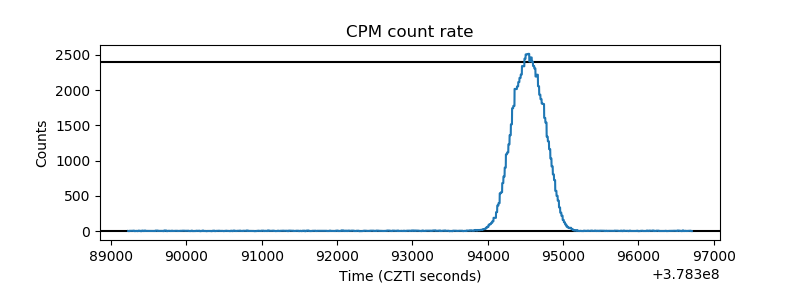 |
| CZT Counter | 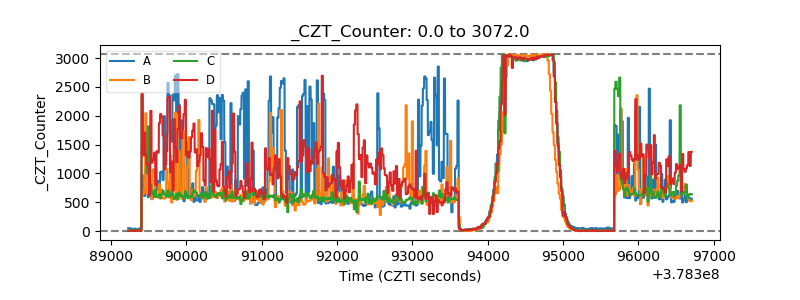 |
| +2.5 Volts monitor |  |
| +5 Volts monitor |  |
| _ROLL_ROT | 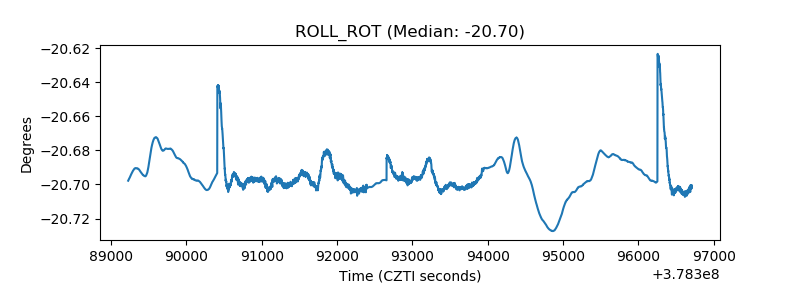 |
| _Roll_DEC | 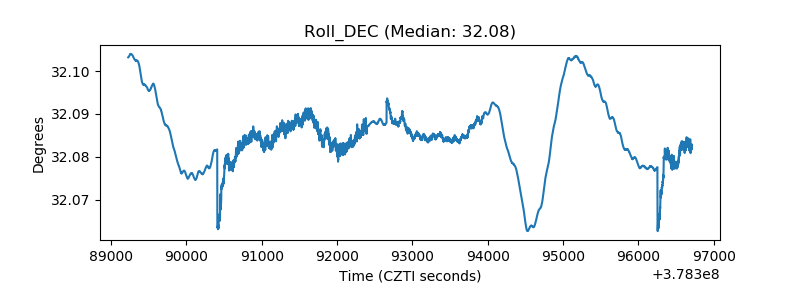 |
| _Roll_RA | 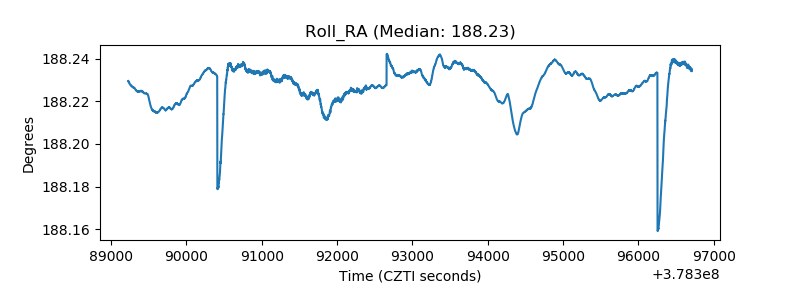 |
| Veto Counter | 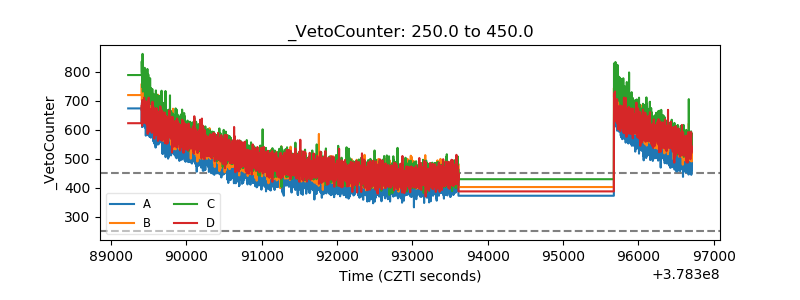 |