| Param | Original file | Final file |
|---|---|---|
| Filename | modeM0/AS1T04_091T01_9000004822_33800cztM0_level2.evt | modeM0/AS1T04_091T01_9000004822_33800cztM0_level2_quad_clean.evt |
| Size (bytes) | 565,787,520 | 55,126,080 |
| Size | 539.6 MB | 52.6 MB |
| Events in quadrant A | 4,017,754 | 324,762 |
| Events in quadrant B | 3,782,958 | 328,032 |
| Events in quadrant C | 3,506,350 | 337,422 |
| Events in quadrant D | 5,477,628 | 315,430 |
| Mode SS | |||
|---|---|---|---|
| Quadrant | BADHDUFLAG | Total packets | Discarded packets |
| A | 0 | 104 | 0 |
| B | 0 | 104 | 0 |
| C | 0 | 104 | 0 |
| D | 0 | 104 | 0 |
| Mode M0 | |||
|---|---|---|---|
| Quadrant | BADHDUFLAG | Total packets | Discarded packets |
| A | 0 | 15250 | 3 |
| B | 0 | 14695 | 2 |
| C | 0 | 13956 | 2 |
| D | 0 | 19781 | 2 |
| Mode M9 | |||
|---|---|---|---|
| Quadrant | BADHDUFLAG | Total packets | Discarded packets |
| A | 0 | 31 | 0 |
| B | 0 | 31 | 0 |
| C | 0 | 31 | 0 |
| D | 0 | 32 | 0 |
| Quadrant | Total seconds | Saturated seconds | Saturation percentage |
|---|---|---|---|
| A | 5188 | 514 | 9.907479% |
| B | 5188 | 277 | 5.339244% |
| C | 5188 | 129 | 2.486507% |
| D | 5188 | 395 | 7.613724% |
Noise dominated data is calculated using 1-second bins in cleaned event files. If a bin has >2000 counts, and if more than 50% of those come from <1% of pixels, then it is considered to be noise-dominated and hence unusable.
| Quadrant | # 1 sec bins | Bins with >0 counts | Bins with >2000 counts | High rate bins dominated by noise | Noise dominated (total time) | Noise dominated (detector-on time) | Marked lightcurve |
|---|---|---|---|---|---|---|---|
| A | 7309 | 5189 | 315 | 315 | 4.31% | 6.07% | 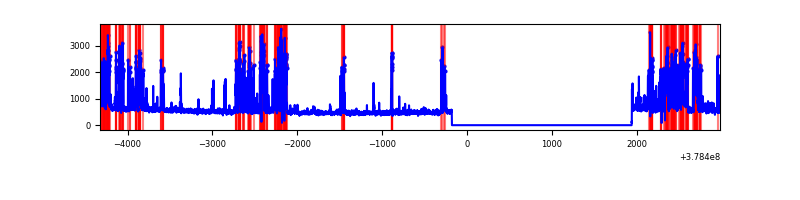 |
| B | 7309 | 5189 | 214 | 214 | 2.93% | 4.12% | 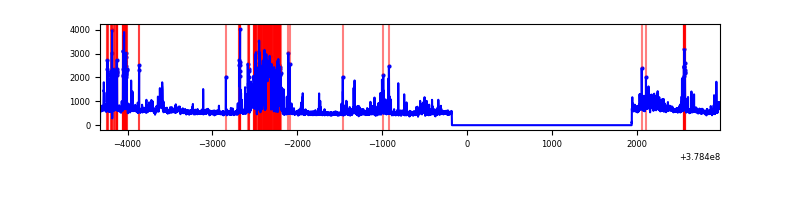 |
| C | 7309 | 5189 | 114 | 114 | 1.56% | 2.20% | 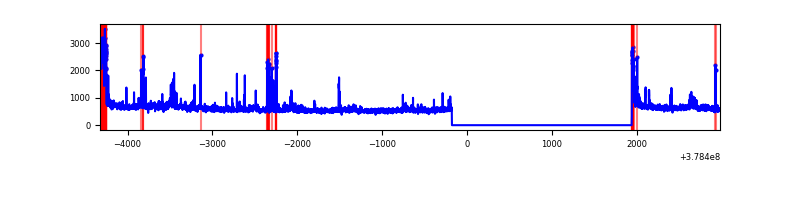 |
| D | 7309 | 5189 | 341 | 341 | 4.67% | 6.57% | 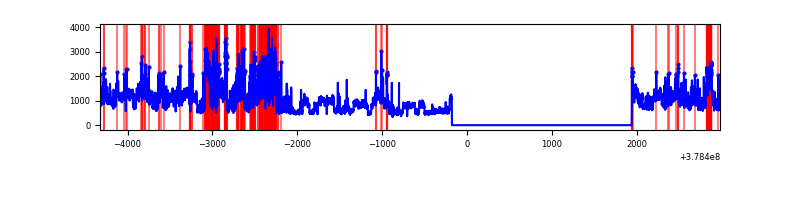 |
Top three noisy pixels from each quadrant. If the there are fewer than three noisy pixels in the level2.evt file, extra rows are filled as -1
| Pixel properties | Quadrant properties | ||||||
|---|---|---|---|---|---|---|---|
| Quadrant | DetID | PixID | Counts | Sigma | Mean | Median | Sigma |
| A | 15 | 237 | 1438304 | 10947.62 | 661 | 649 | 131.3 |
| A | 13 | 6 | 14789 | 107.67 | 661 | 649 | 131.3 |
| A | 10 | 83 | 10077 | 71.79 | 661 | 649 | 131.3 |
| B | 5 | 172 | 806012 | 6460.2 | 670 | 655 | 124.7 |
| B | 0 | 219 | 87428 | 696.05 | 670 | 655 | 124.7 |
| B | 0 | 190 | 70947 | 563.85 | 670 | 655 | 124.7 |
| C | 15 | 214 | 223439 | 1471.61 | 667 | 675 | 151.4 |
| C | 3 | 233 | 203313 | 1338.66 | 667 | 675 | 151.4 |
| C | 9 | 187 | 200692 | 1321.34 | 667 | 675 | 151.4 |
| D | 8 | 195 | 1399650 | 8724.91 | 660 | 644 | 160.3 |
| D | 2 | 250 | 523163 | 3258.69 | 660 | 644 | 160.3 |
| D | 12 | 235 | 394886 | 2458.69 | 660 | 644 | 160.3 |
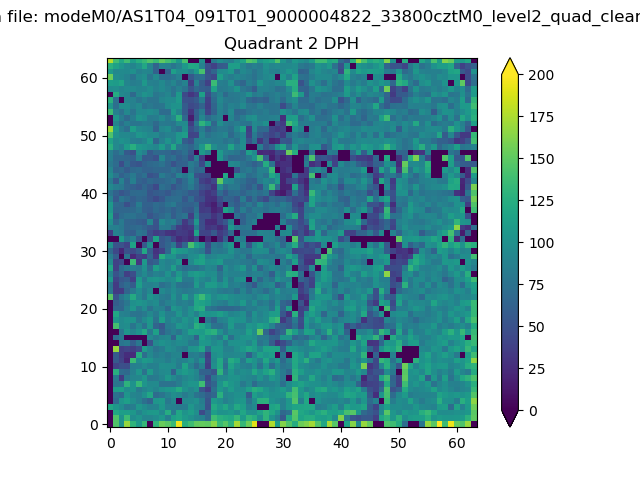
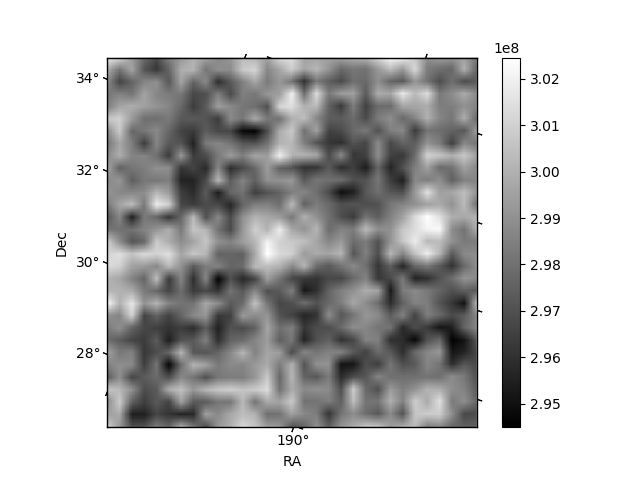
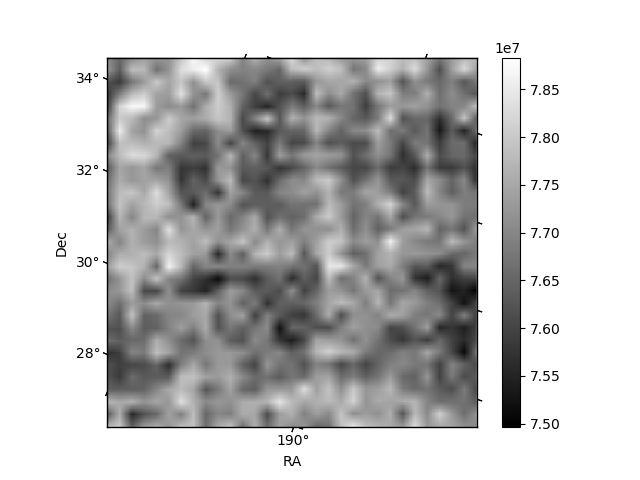
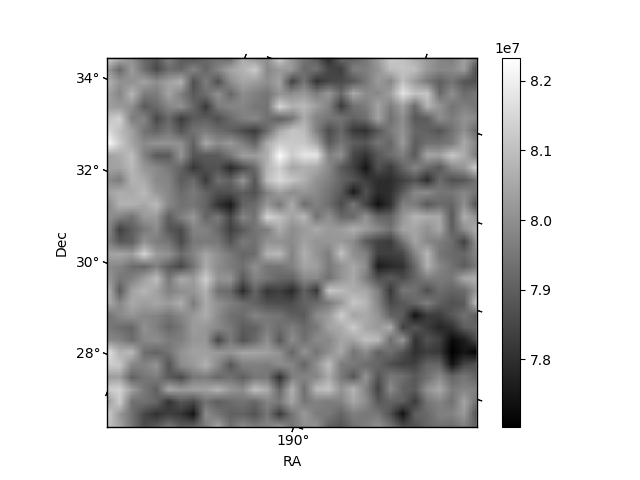
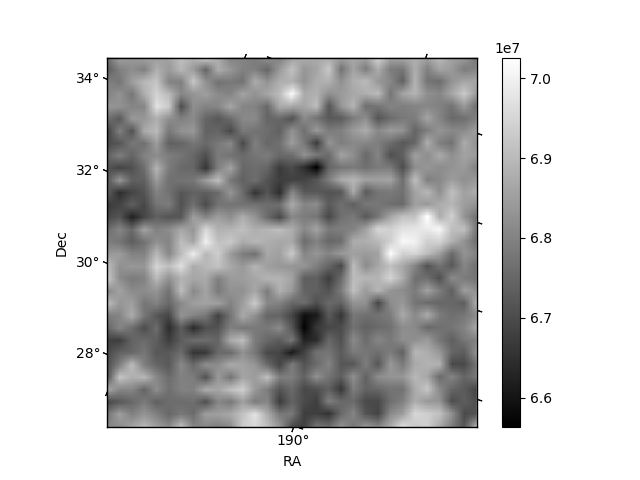
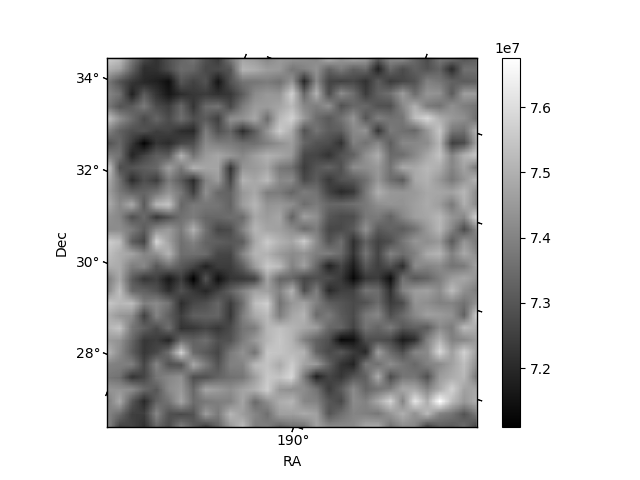
Histogram calculated using DETX and DETY for each event in the final _common_clean file
| Quadrant A | 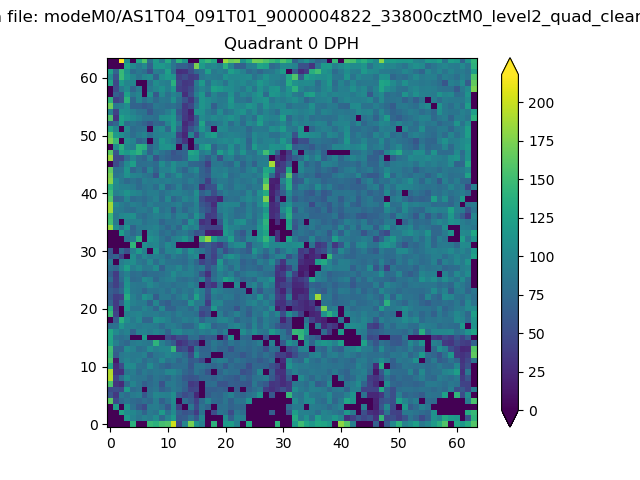 |
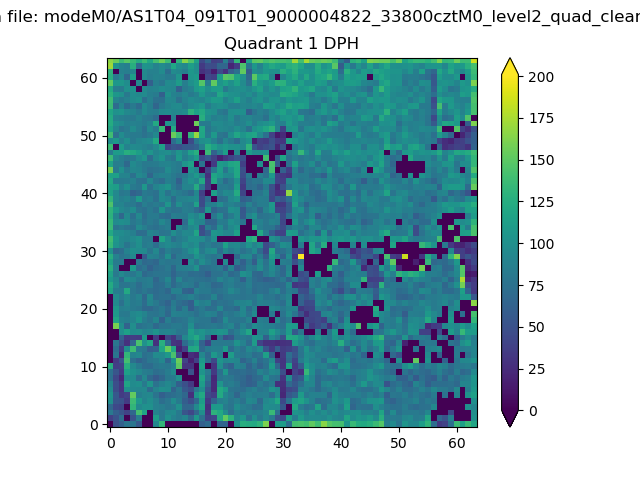 |
Quadrant B |
|---|---|---|---|
| Quadrant D | 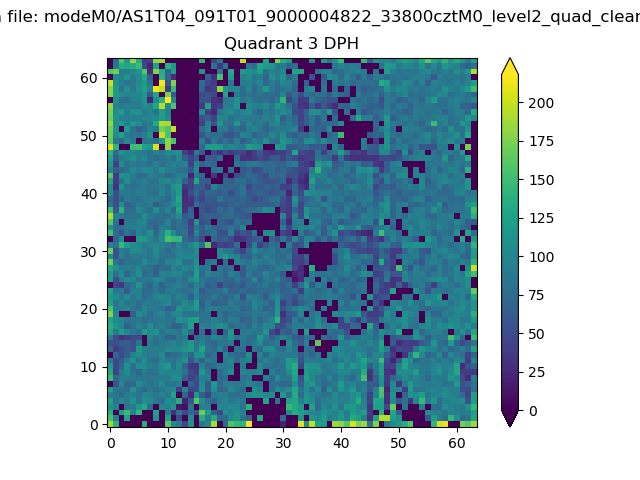 |
 |
Quadrant C |
| Plot type | Count rate plots | Images |
|---|---|---|
| Comparison with Poisson distribution Blue bars denote a histogram of data divided into 1 sec bins. Red curve is a Poisson curve with rate = median count rate of data. |
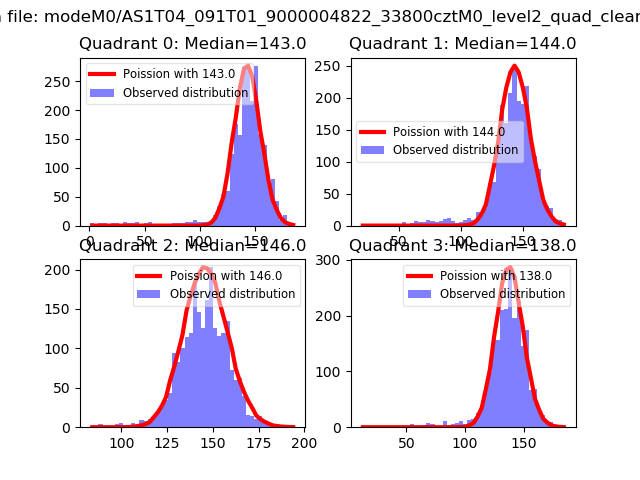 |
 |
| Quadrant-wise count rates Data is divided into 100 sec bins |
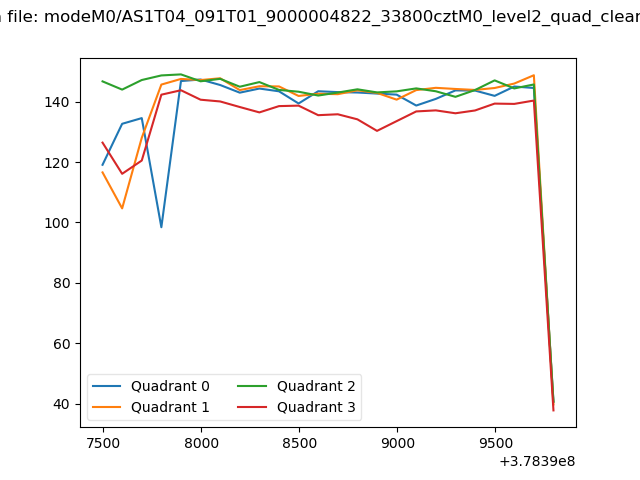 |
|
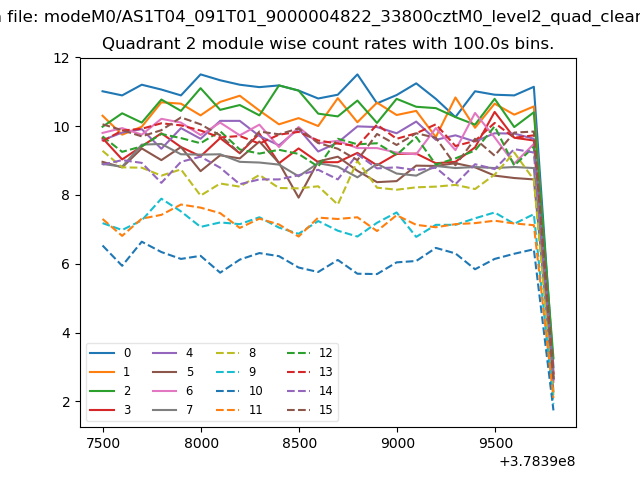
| Module-wise count rates for Quadrant A Data is divided into 100 sec bins |
 |
 |
| Module-wise count rates for Quadrant B Data is divided into 100 sec bins |
 |
 |
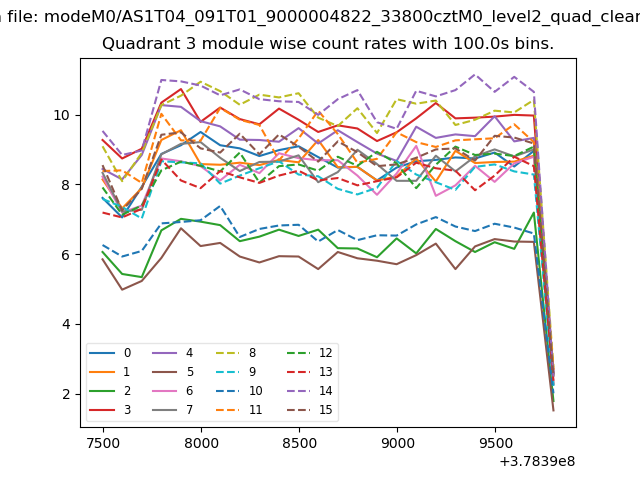
| Module-wise count rates for Quadrant C Data is divided into 100 sec bins |
 |
 |
| Module-wise count rates for Quadrant D Data is divided into 100 sec bins |
 |
 |
| Parameter | Plot |
|---|---|
| CZT HV Monitor | 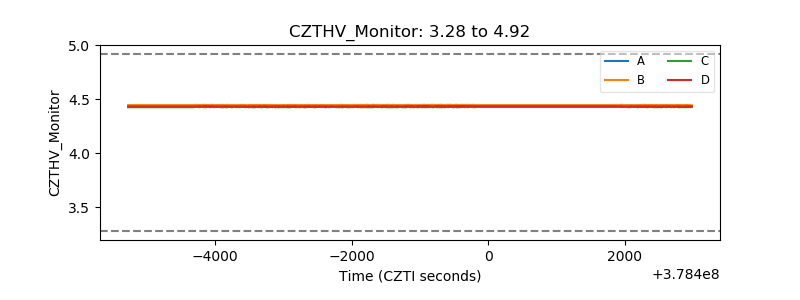 |
| D_VDD | 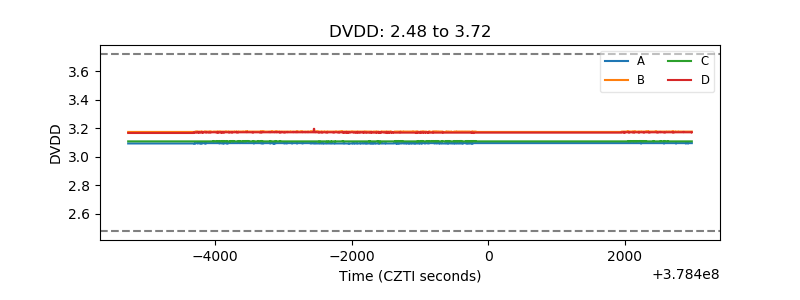 |
| Temperature 1 | 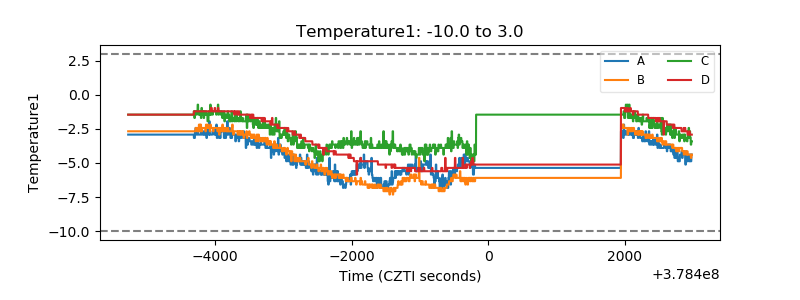 |
| Veto HV Monitor | 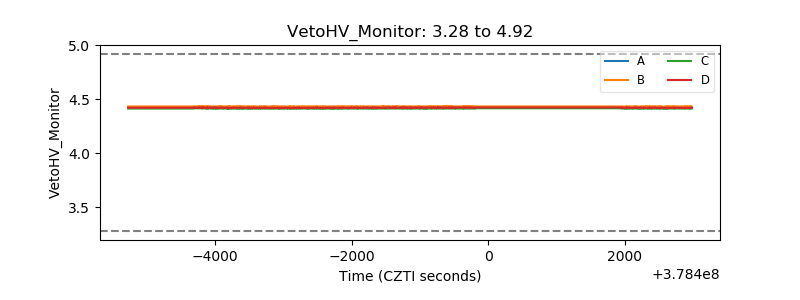 |
| Veto LLD | 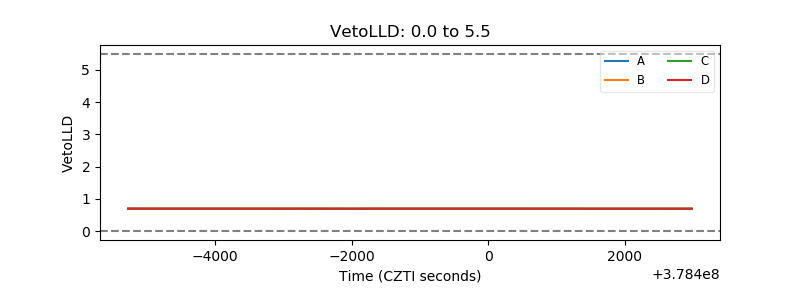 |
| Alpha Counter | 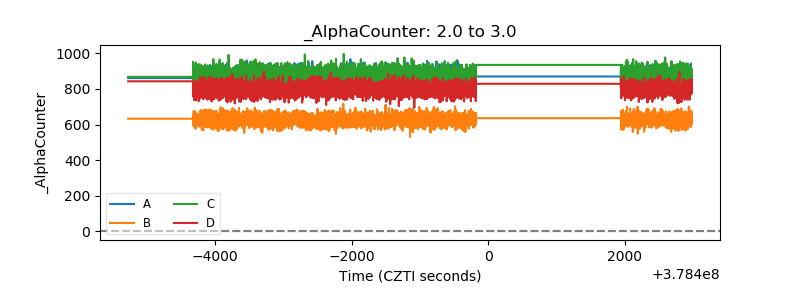 |
| _CPM_Rate | 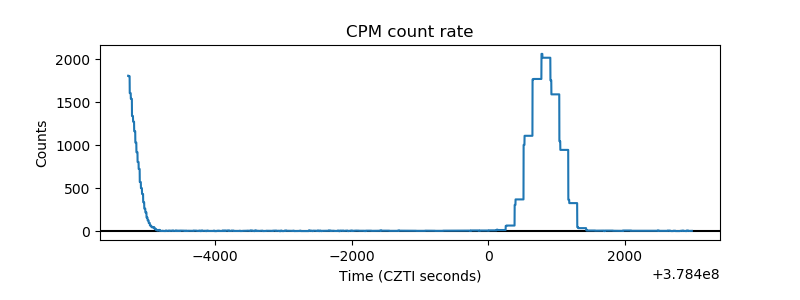 |
| CZT Counter | 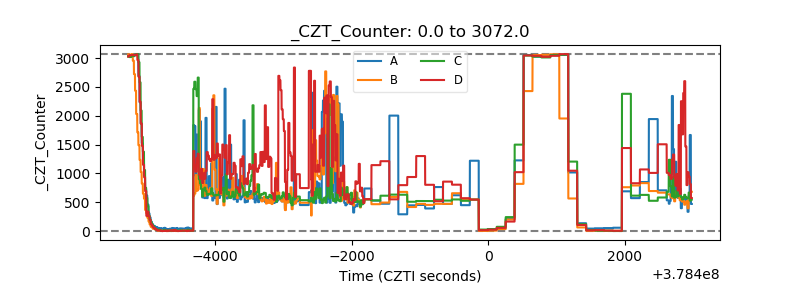 |
| +2.5 Volts monitor | 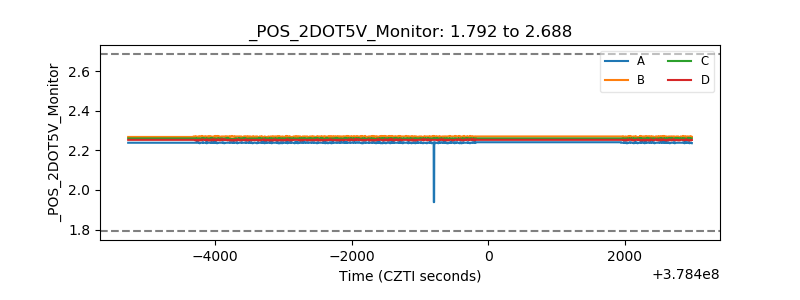 |
| +5 Volts monitor | 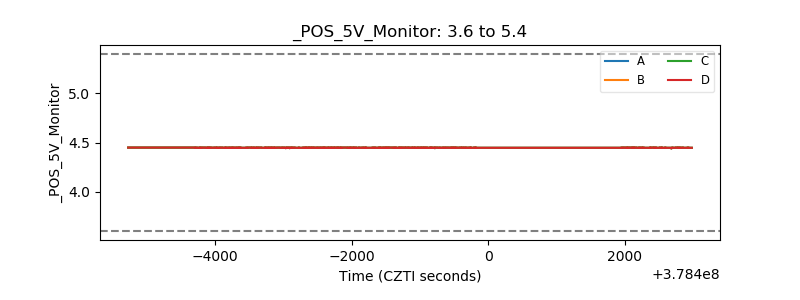 |
| _ROLL_ROT | 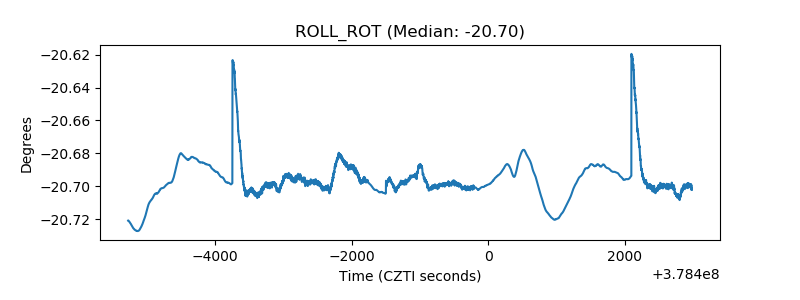 |
| _Roll_DEC | 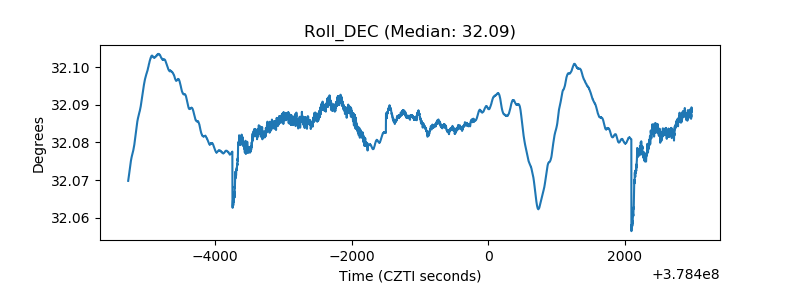 |
| _Roll_RA | 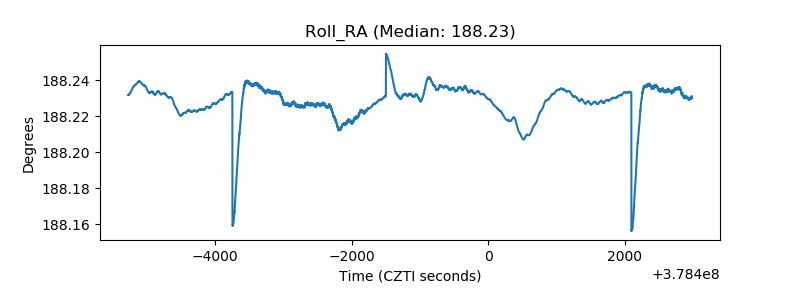 |
| Veto Counter | 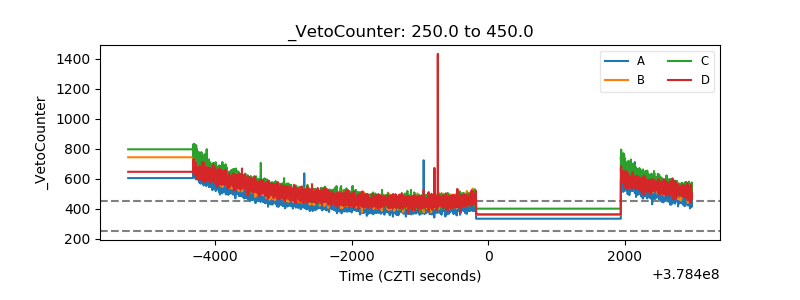 |