| Param | Original file | Final file |
|---|---|---|
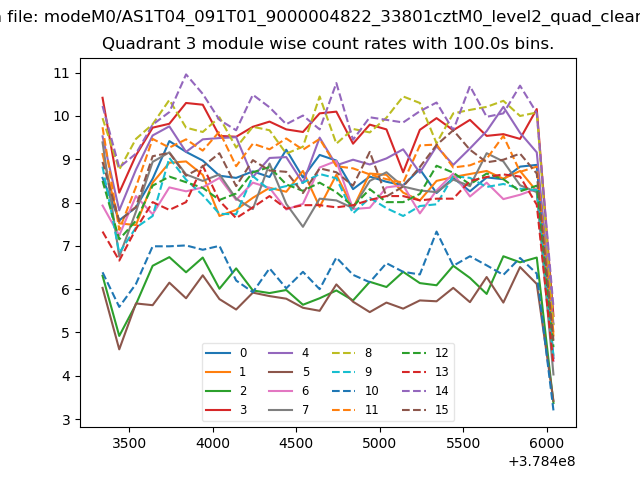
| Filename | modeM0/AS1T04_091T01_9000004822_33801cztM0_level2.evt | modeM0/AS1T04_091T01_9000004822_33801cztM0_level2_quad_clean.evt |
| Size (bytes) | 539,121,600 | 61,142,400 |
| Size | 514.1 MB | 58.3 MB |
| Events in quadrant A | 4,418,857 | 359,201 |
| Events in quadrant B | 3,067,980 | 389,847 |
| Events in quadrant C | 3,183,849 | 392,171 |
| Events in quadrant D | 5,325,503 | 366,300 |
| Mode SS | |||
|---|---|---|---|
| Quadrant | BADHDUFLAG | Total packets | Discarded packets |
| A | 0 | 100 | 0 |
| B | 0 | 100 | 0 |
| C | 0 | 100 | 0 |
| D | 0 | 100 | 0 |
| Mode M0 | |||
|---|---|---|---|
| Quadrant | BADHDUFLAG | Total packets | Discarded packets |
| A | 0 | 16405 | 3 |
| B | 0 | 12228 | 2 |
| C | 0 | 12767 | 2 |
| D | 0 | 19258 | 2 |
| Mode M9 | |||
|---|---|---|---|
| Quadrant | BADHDUFLAG | Total packets | Discarded packets |
| A | 0 | 25 | 0 |
| B | 0 | 25 | 0 |
| C | 0 | 25 | 0 |
| D | 0 | 26 | 0 |
| Quadrant | Total seconds | Saturated seconds | Saturation percentage |
|---|---|---|---|
| A | 4896 | 769 | 15.706699% |
| B | 4896 | 98 | 2.001634% |
| C | 4896 | 87 | 1.776961% |
| D | 4896 | 396 | 8.088235% |
Noise dominated data is calculated using 1-second bins in cleaned event files. If a bin has >2000 counts, and if more than 50% of those come from <1% of pixels, then it is considered to be noise-dominated and hence unusable.
| Quadrant | # 1 sec bins | Bins with >0 counts | Bins with >2000 counts | High rate bins dominated by noise | Noise dominated (total time) | Noise dominated (detector-on time) | Marked lightcurve |
|---|---|---|---|---|---|---|---|
| A | 7018 | 4897 | 502 | 502 | 7.15% | 10.25% | 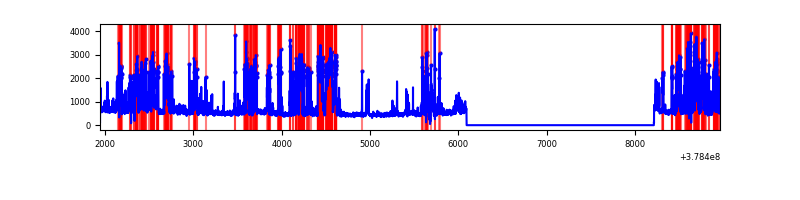 |
| B | 7018 | 4897 | 64 | 64 | 0.91% | 1.31% | 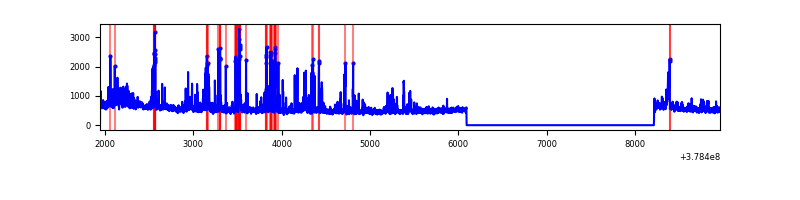 |
| C | 7018 | 4897 | 58 | 58 | 0.83% | 1.18% | 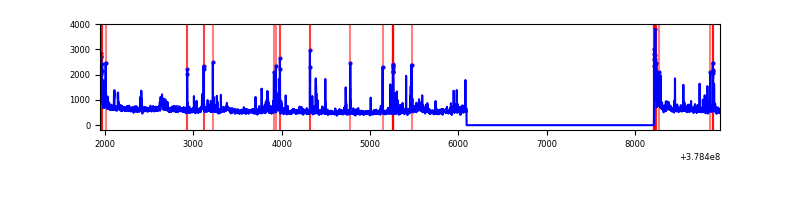 |
| D | 7018 | 4897 | 357 | 357 | 5.09% | 7.29% | 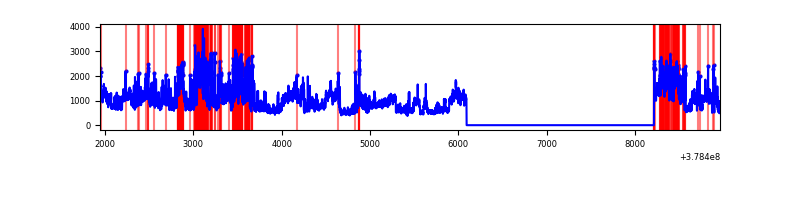 |
Top three noisy pixels from each quadrant. If the there are fewer than three noisy pixels in the level2.evt file, extra rows are filled as -1
| Pixel properties | Quadrant properties | ||||||
|---|---|---|---|---|---|---|---|
| Quadrant | DetID | PixID | Counts | Sigma | Mean | Median | Sigma |
| A | 15 | 237 | 2174025 | 18938.58 | 575 | 566 | 114.8 |
| A | 13 | 6 | 10322 | 85.01 | 575 | 566 | 114.8 |
| A | 10 | 83 | 10227 | 84.18 | 575 | 566 | 114.8 |
| B | 5 | 172 | 392847 | 3412.89 | 616 | 601 | 114.9 |
| B | 0 | 219 | 64122 | 552.69 | 616 | 601 | 114.9 |
| B | 0 | 190 | 48803 | 419.4 | 616 | 601 | 114.9 |
| C | 15 | 214 | 215471 | 1553.66 | 611 | 617 | 138.3 |
| C | 3 | 233 | 179794 | 1295.67 | 611 | 617 | 138.3 |
| C | 0 | 10 | 136022 | 979.15 | 611 | 617 | 138.3 |
| D | 8 | 195 | 1150220 | 7800.09 | 599 | 585 | 147.4 |
| D | 12 | 235 | 838102 | 5682.42 | 599 | 585 | 147.4 |
| D | 2 | 250 | 524914 | 3557.49 | 599 | 585 | 147.4 |
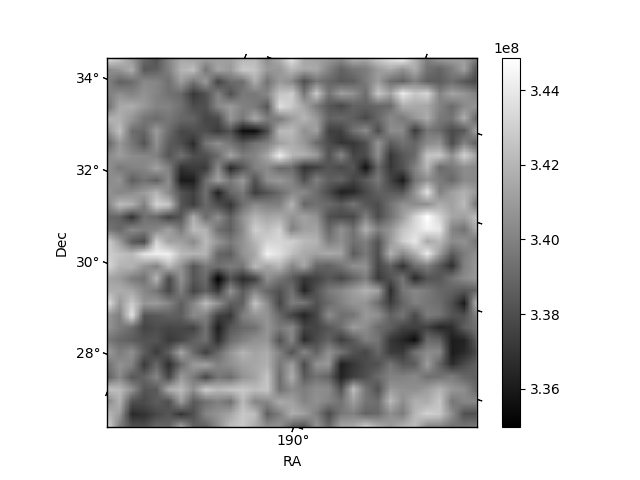
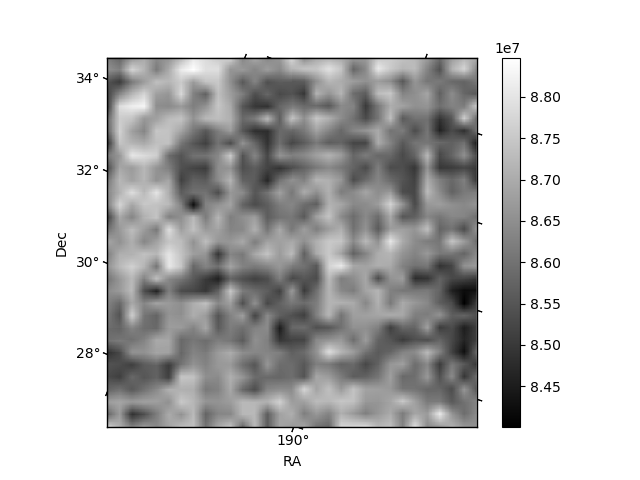
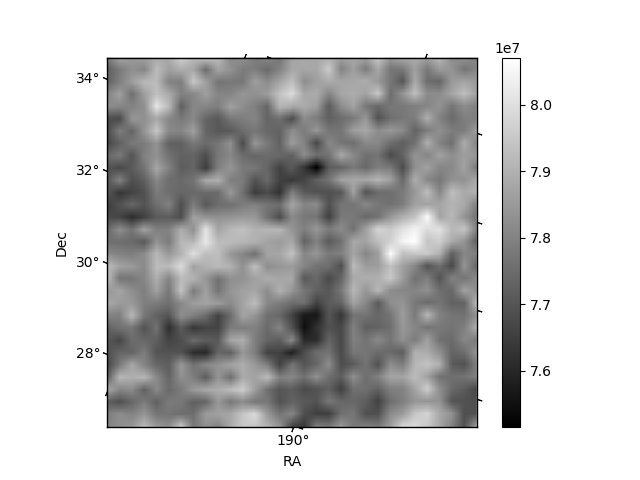
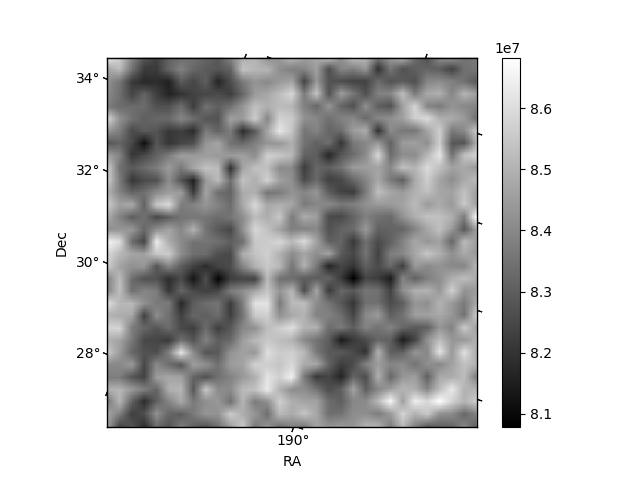
Histogram calculated using DETX and DETY for each event in the final _common_clean file
| Quadrant A | 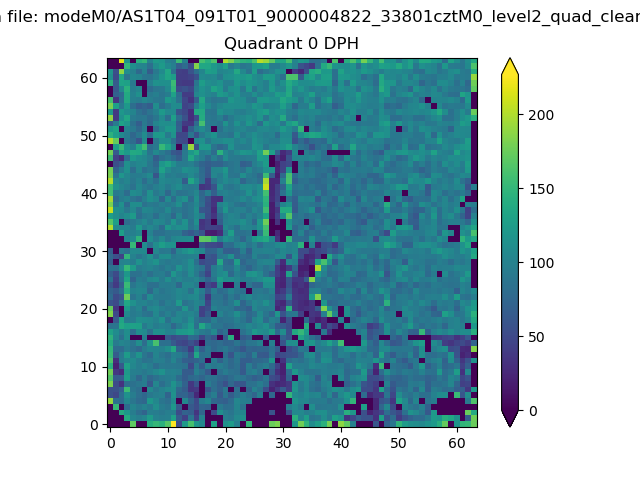 |
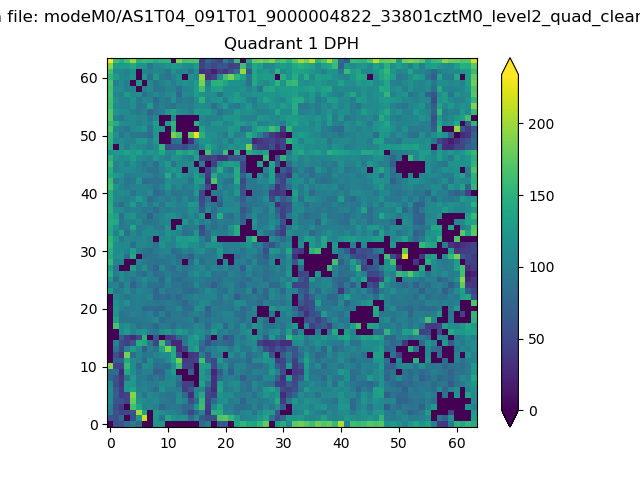 |
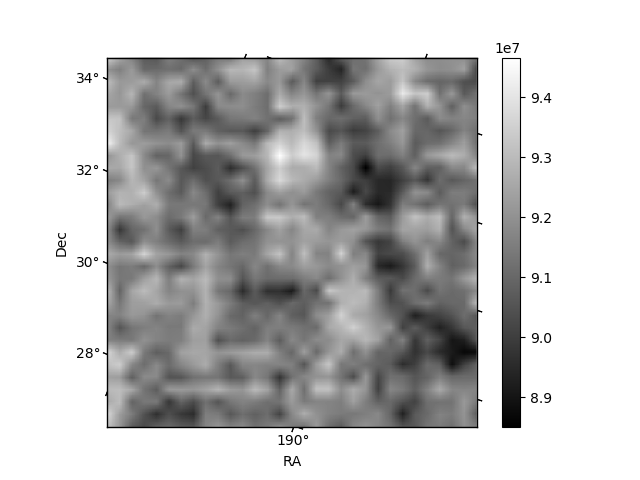
Quadrant B |
|---|---|---|---|
| Quadrant D | 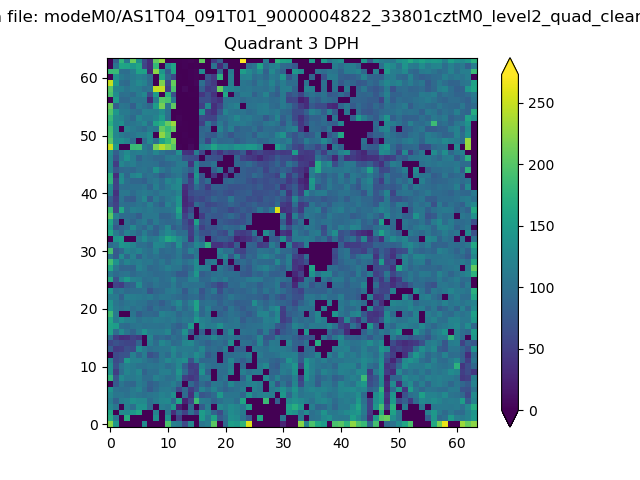 |
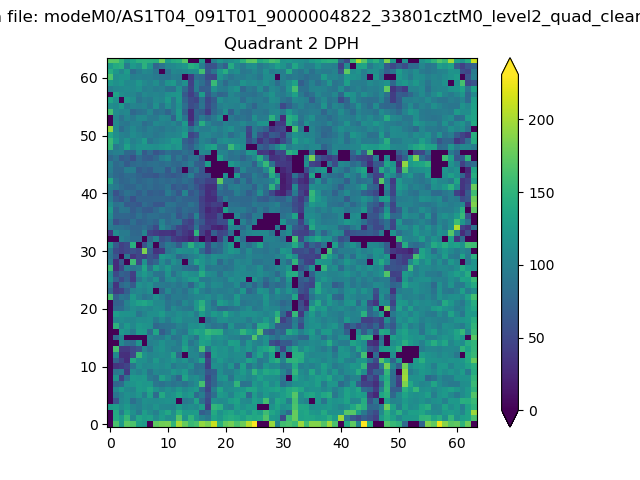 |
Quadrant C |
| Plot type | Count rate plots | Images |
|---|---|---|
| Comparison with Poisson distribution Blue bars denote a histogram of data divided into 1 sec bins. Red curve is a Poisson curve with rate = median count rate of data. |
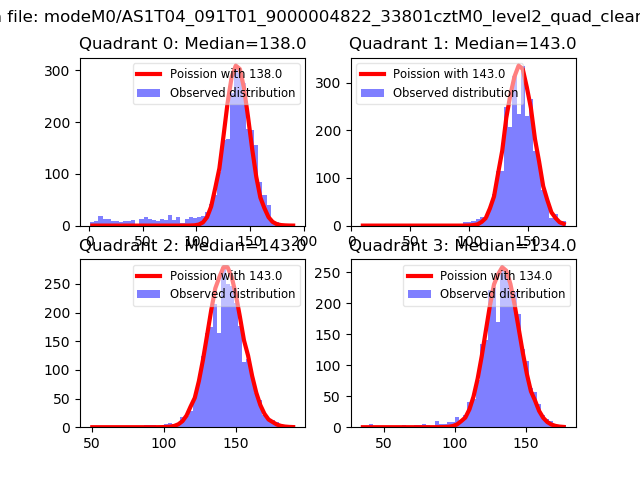 |
 |
| Quadrant-wise count rates Data is divided into 100 sec bins |
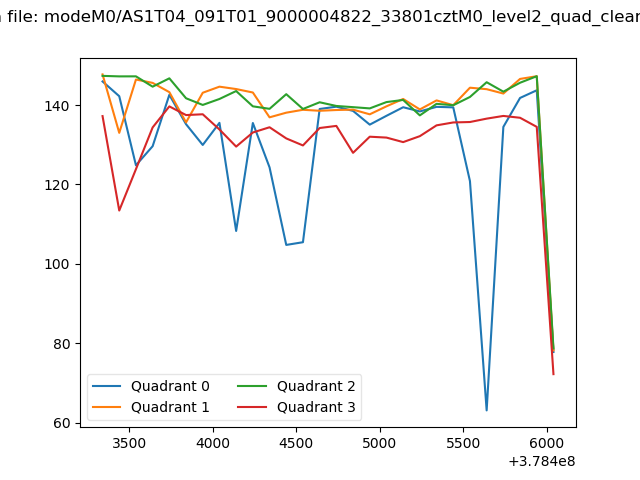 |
|
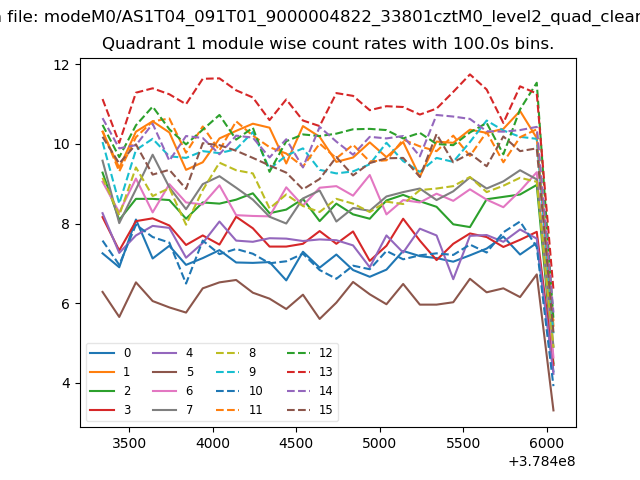
| Module-wise count rates for Quadrant A Data is divided into 100 sec bins |
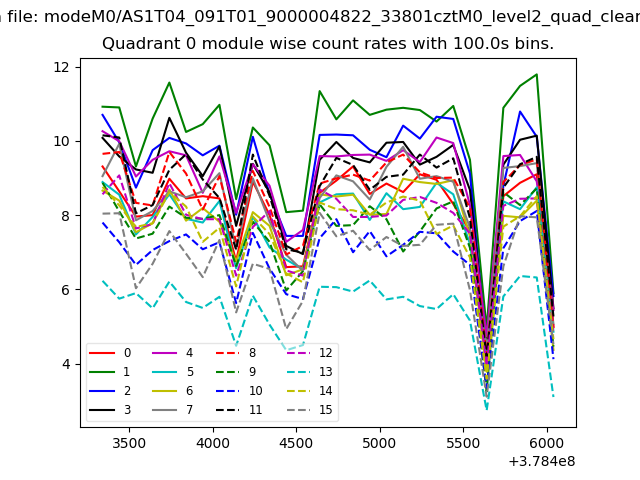 |
 |
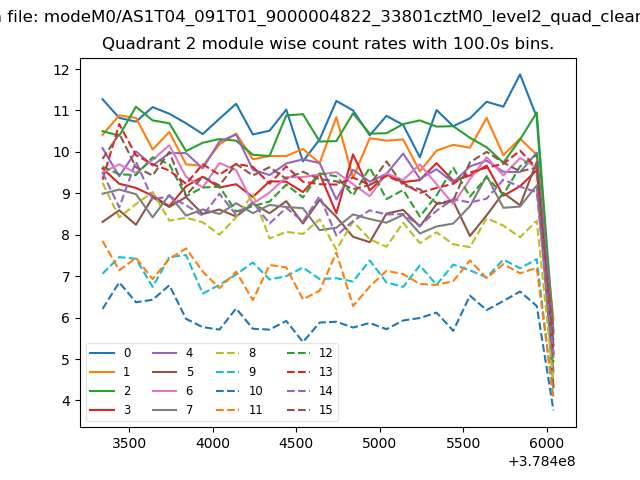
| Module-wise count rates for Quadrant B Data is divided into 100 sec bins |
 |
 |
| Module-wise count rates for Quadrant C Data is divided into 100 sec bins |
 |
 |
| Module-wise count rates for Quadrant D Data is divided into 100 sec bins |
 |
 |
| Parameter | Plot |
|---|---|
| CZT HV Monitor | 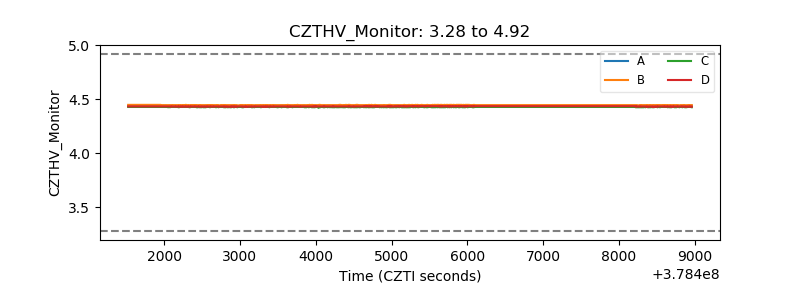 |
| D_VDD | 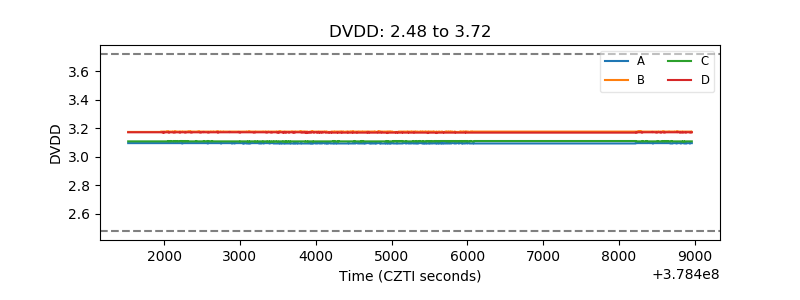 |
| Temperature 1 | 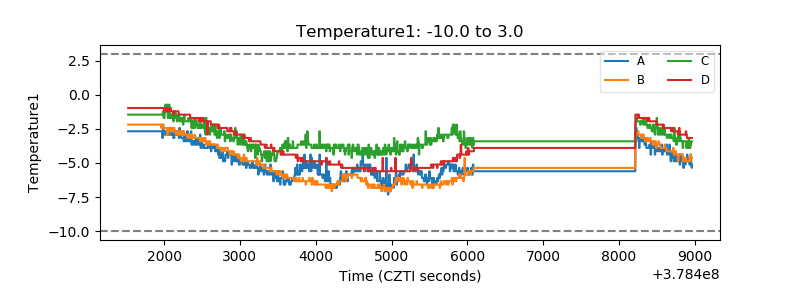 |
| Veto HV Monitor | 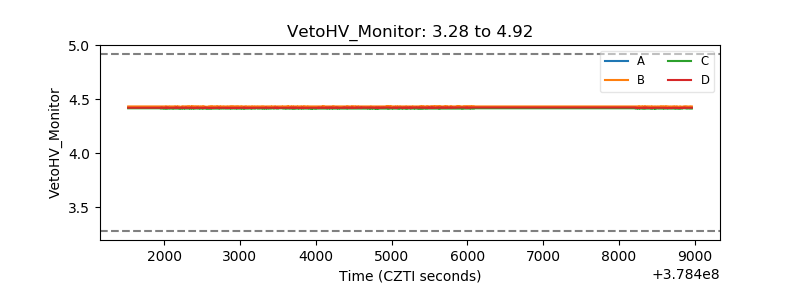 |
| Veto LLD | 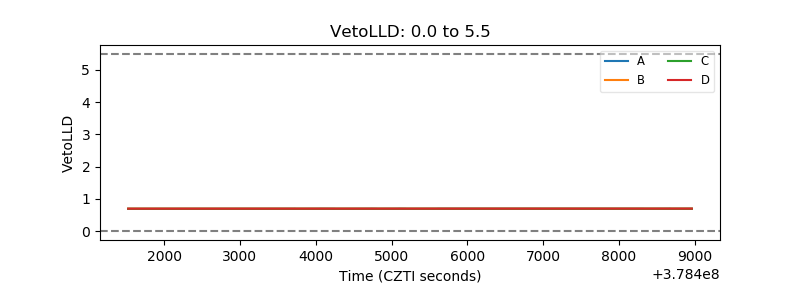 |
| Alpha Counter | 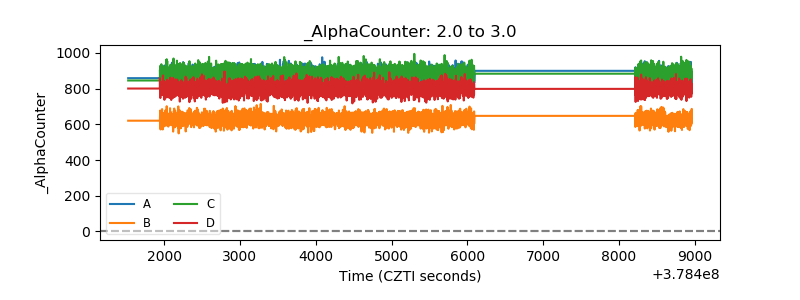 |
| _CPM_Rate | 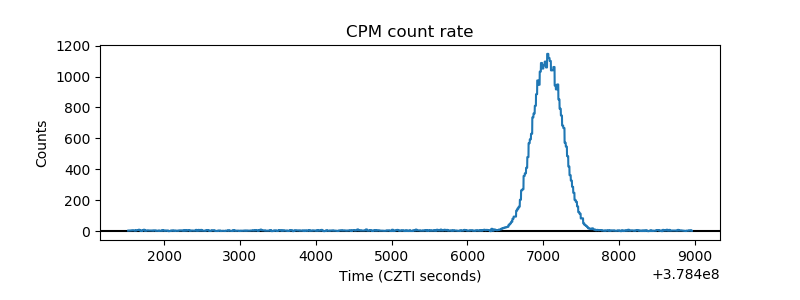 |
| CZT Counter | 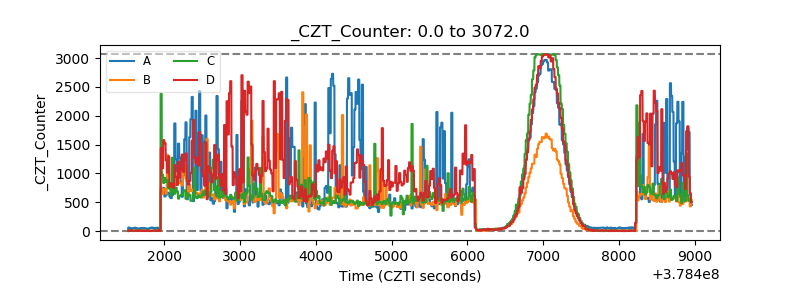 |
| +2.5 Volts monitor |  |
| +5 Volts monitor |  |
| _ROLL_ROT | 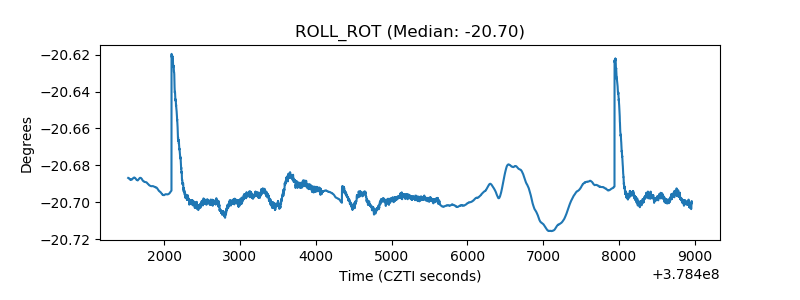 |
| _Roll_DEC | 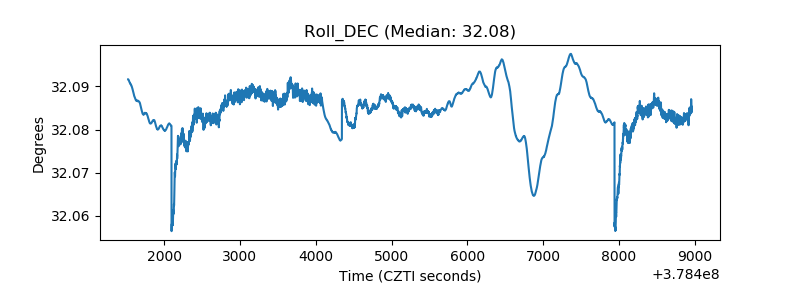 |
| _Roll_RA | 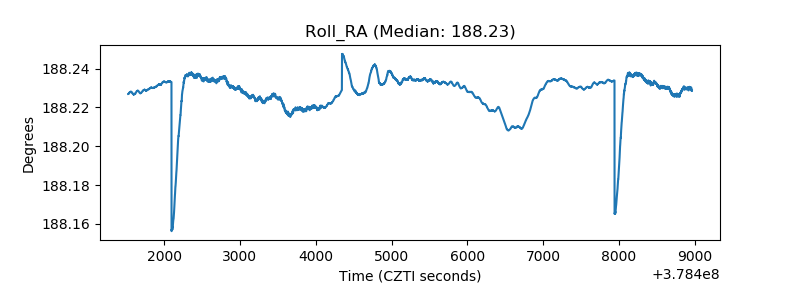 |
| Veto Counter | 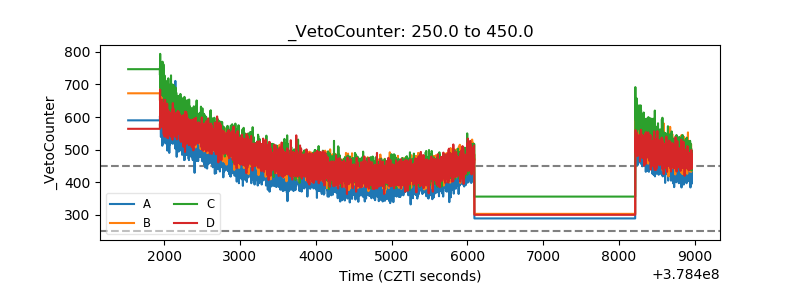 |