| Param | Original file | Final file |
|---|---|---|
| Filename | modeM0/AS1T04_091T01_9000004822_33802cztM0_level2.evt | modeM0/AS1T04_091T01_9000004822_33802cztM0_level2_quad_clean.evt |
| Size (bytes) | 549,515,520 | 74,102,400 |
| Size | 524.1 MB | 70.7 MB |
| Events in quadrant A | 3,894,411 | 469,252 |
| Events in quadrant B | 3,296,515 | 479,708 |
| Events in quadrant C | 3,252,038 | 482,303 |
| Events in quadrant D | 5,852,373 | 453,237 |
| Mode SS | |||
|---|---|---|---|
| Quadrant | BADHDUFLAG | Total packets | Discarded packets |
| A | 0 | 106 | 0 |
| B | 0 | 106 | 0 |
| C | 0 | 106 | 0 |
| D | 0 | 106 | 0 |
| Mode M0 | |||
|---|---|---|---|
| Quadrant | BADHDUFLAG | Total packets | Discarded packets |
| A | 0 | 14993 | 3 |
| B | 0 | 13036 | 2 |
| C | 0 | 12747 | 2 |
| D | 0 | 21065 | 2 |
| Mode M9 | |||
|---|---|---|---|
| Quadrant | BADHDUFLAG | Total packets | Discarded packets |
| A | 0 | 31 | 0 |
| B | 0 | 31 | 0 |
| C | 0 | 31 | 0 |
| D | 0 | 32 | 0 |
| Quadrant | Total seconds | Saturated seconds | Saturation percentage |
|---|---|---|---|
| A | 5123 | 602 | 11.750927% |
| B | 5123 | 189 | 3.689245% |
| C | 5123 | 143 | 2.791333% |
| D | 5123 | 386 | 7.534648% |
Noise dominated data is calculated using 1-second bins in cleaned event files. If a bin has >2000 counts, and if more than 50% of those come from <1% of pixels, then it is considered to be noise-dominated and hence unusable.
| Quadrant | # 1 sec bins | Bins with >0 counts | Bins with >2000 counts | High rate bins dominated by noise | Noise dominated (total time) | Noise dominated (detector-on time) | Marked lightcurve |
|---|---|---|---|---|---|---|---|
| A | 7126 | 5124 | 409 | 409 | 5.74% | 7.98% | 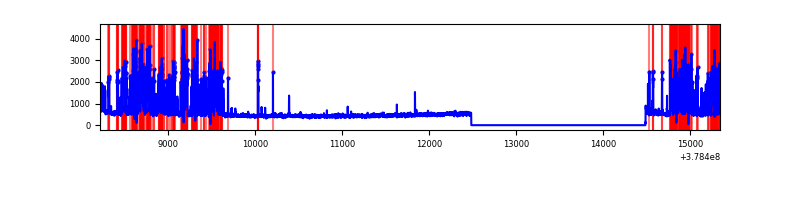 |
| B | 7126 | 5124 | 115 | 115 | 1.61% | 2.24% | 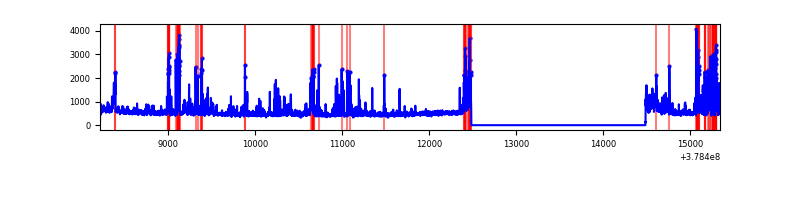 |
| C | 7126 | 5124 | 107 | 107 | 1.50% | 2.09% | 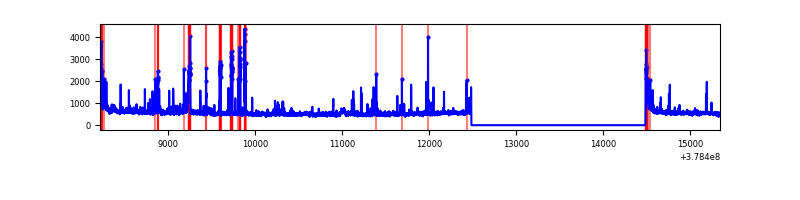 |
| D | 7126 | 5124 | 378 | 378 | 5.30% | 7.38% | 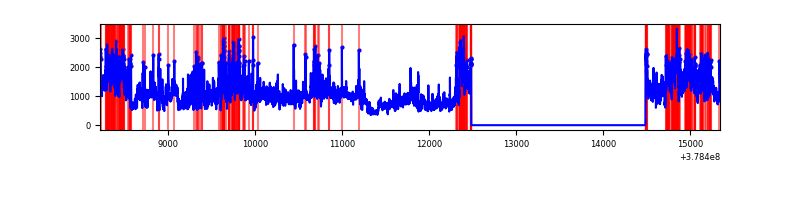 |
Top three noisy pixels from each quadrant. If the there are fewer than three noisy pixels in the level2.evt file, extra rows are filled as -1
| Pixel properties | Quadrant properties | ||||||
|---|---|---|---|---|---|---|---|
| Quadrant | DetID | PixID | Counts | Sigma | Mean | Median | Sigma |
| A | 15 | 237 | 1625010 | 13973.07 | 579 | 570 | 116.3 |
| A | 13 | 6 | 12765 | 104.9 | 579 | 570 | 116.3 |
| A | 10 | 83 | 10243 | 83.2 | 579 | 570 | 116.3 |
| B | 5 | 172 | 554121 | 4784.8 | 607 | 592 | 115.7 |
| B | 4 | 251 | 160793 | 1384.81 | 607 | 592 | 115.7 |
| B | 0 | 190 | 53110 | 453.97 | 607 | 592 | 115.7 |
| C | 9 | 187 | 284182 | 2043.02 | 602 | 608 | 138.8 |
| C | 15 | 214 | 222950 | 1601.87 | 602 | 608 | 138.8 |
| C | 0 | 10 | 142011 | 1018.74 | 602 | 608 | 138.8 |
| D | 12 | 235 | 1528664 | 10366.81 | 593 | 576 | 147.4 |
| D | 8 | 195 | 1395529 | 9463.6 | 593 | 576 | 147.4 |
| D | 12 | 233 | 207426 | 1403.31 | 593 | 576 | 147.4 |
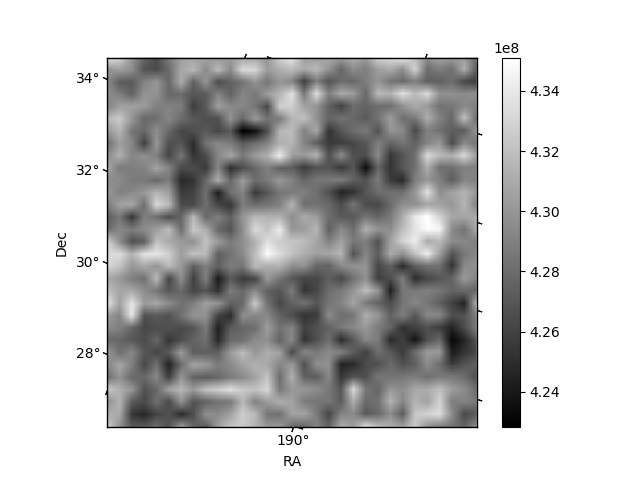
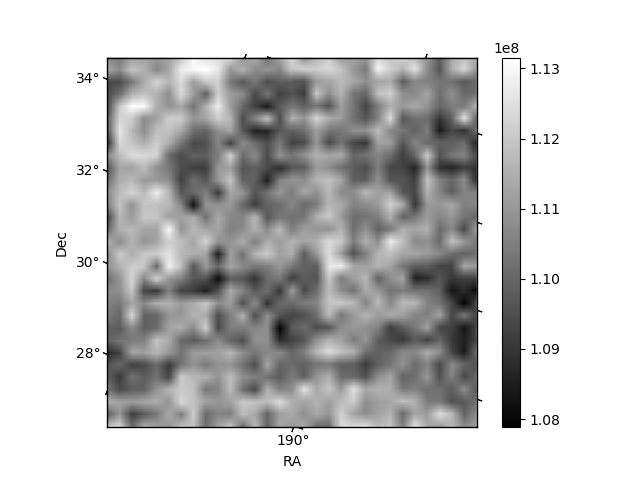
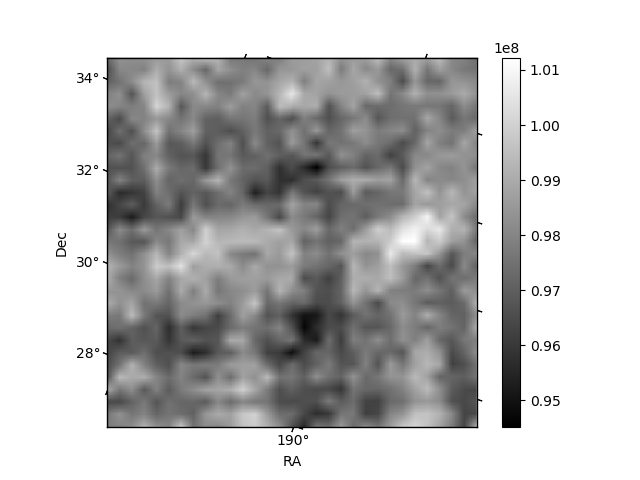
Histogram calculated using DETX and DETY for each event in the final _common_clean file
| Quadrant A | 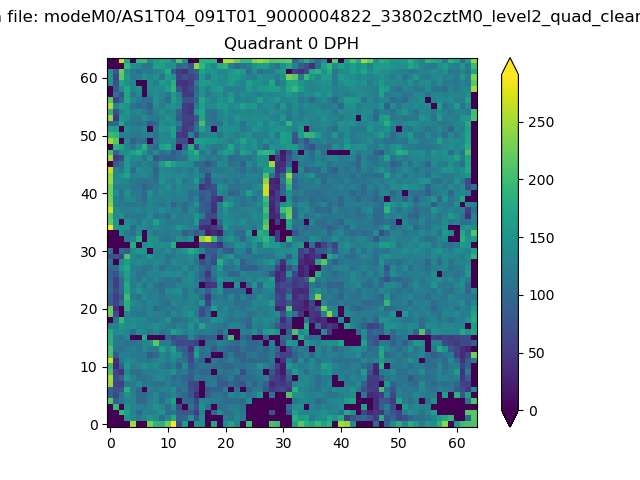 |
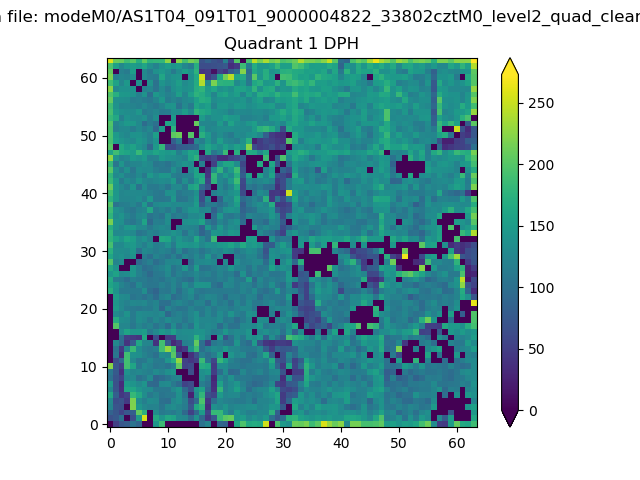 |
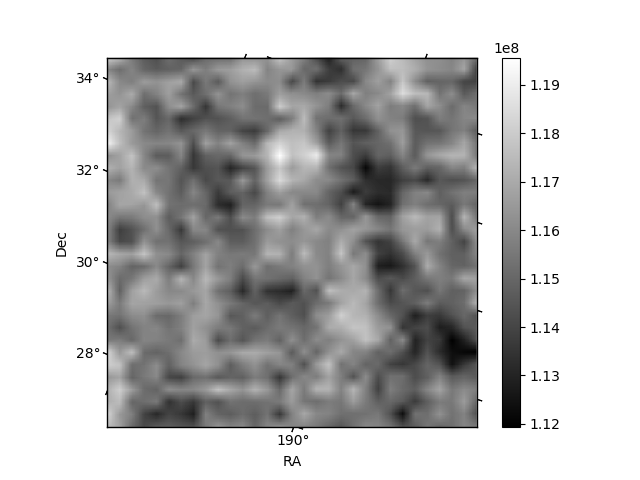
Quadrant B |
|---|---|---|---|
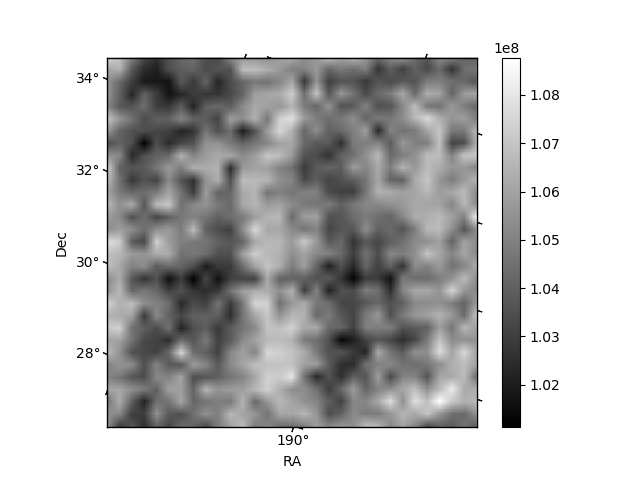
| Quadrant D | 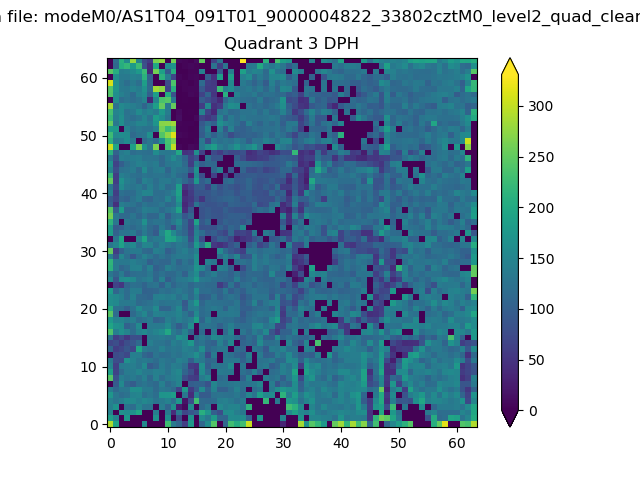 |
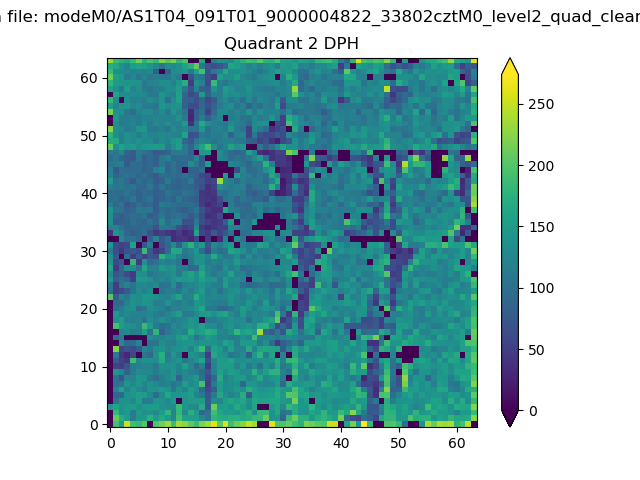 |
Quadrant C |
| Plot type | Count rate plots | Images |
|---|---|---|
| Comparison with Poisson distribution Blue bars denote a histogram of data divided into 1 sec bins. Red curve is a Poisson curve with rate = median count rate of data. |
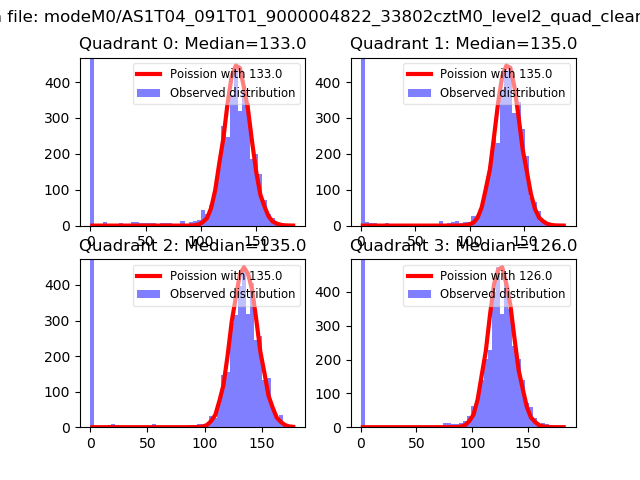 |
 |
| Quadrant-wise count rates Data is divided into 100 sec bins |
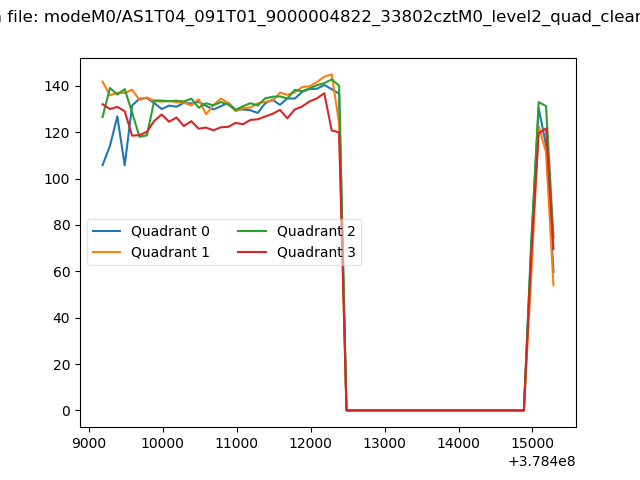 |
|
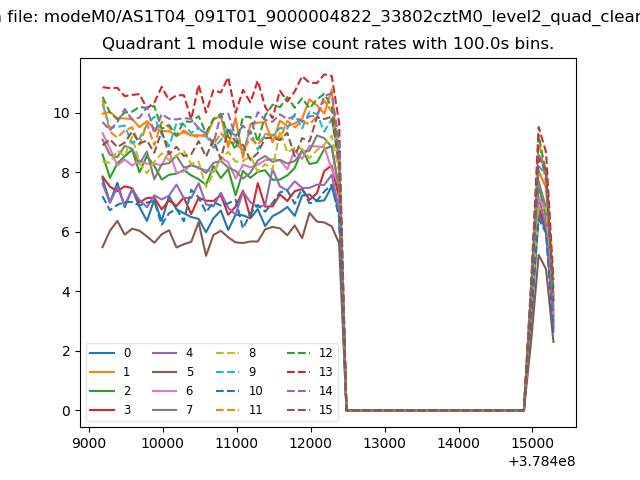
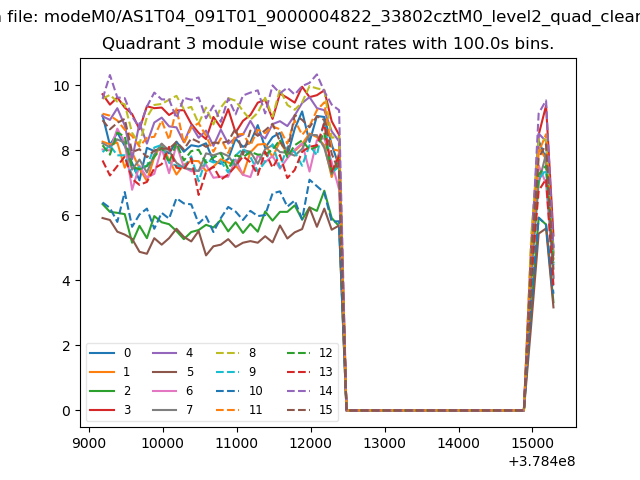
| Module-wise count rates for Quadrant A Data is divided into 100 sec bins |
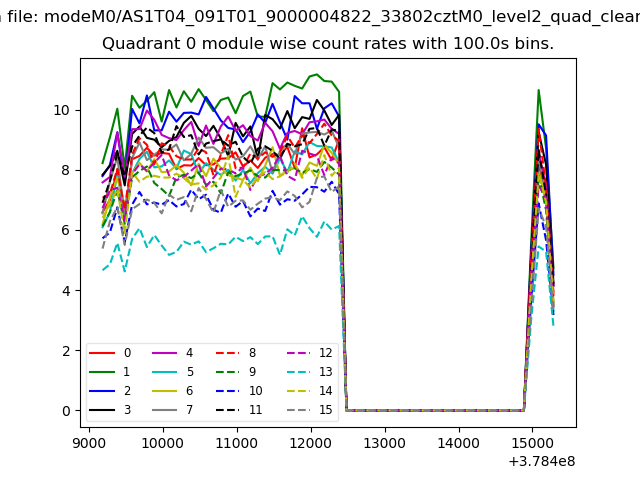 |
 |
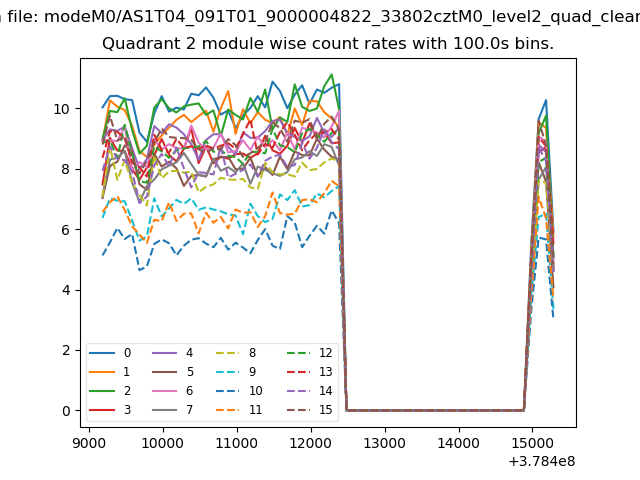
| Module-wise count rates for Quadrant B Data is divided into 100 sec bins |
 |
 |
| Module-wise count rates for Quadrant C Data is divided into 100 sec bins |
 |
 |
| Module-wise count rates for Quadrant D Data is divided into 100 sec bins |
 |
 |
| Parameter | Plot |
|---|---|
| CZT HV Monitor | 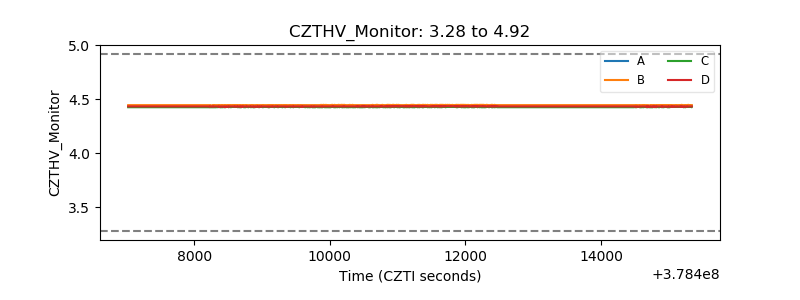 |
| D_VDD | 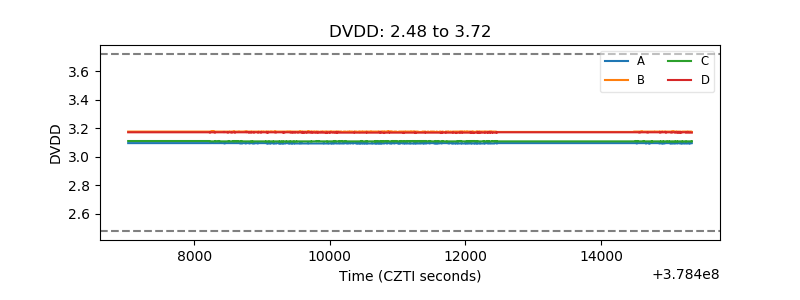 |
| Temperature 1 | 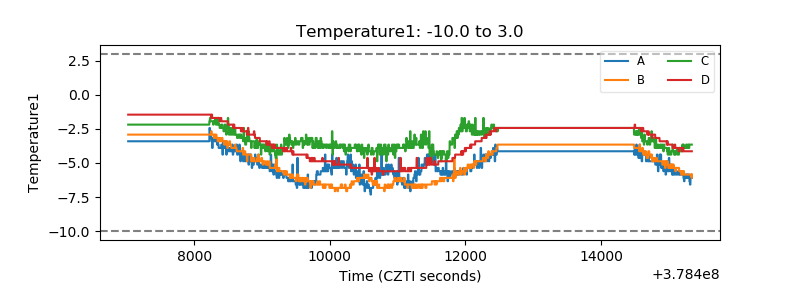 |
| Veto HV Monitor | 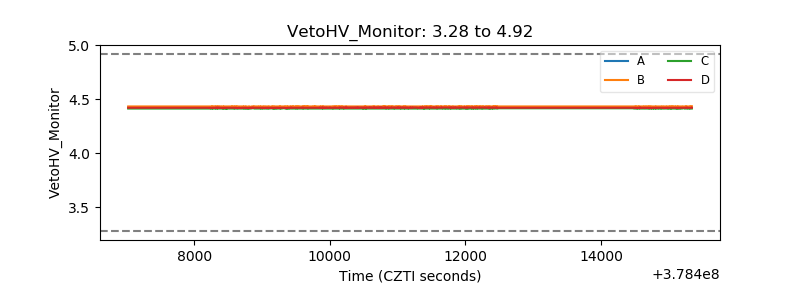 |
| Veto LLD | 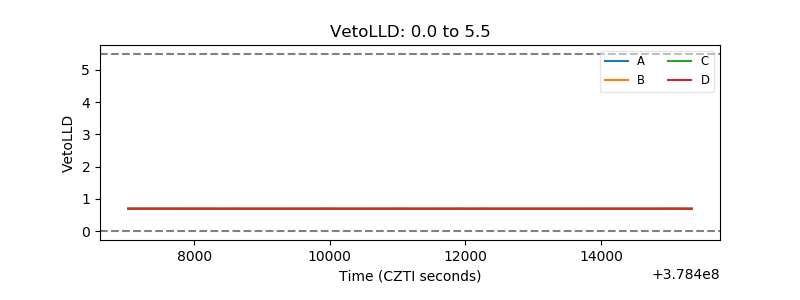 |
| Alpha Counter | 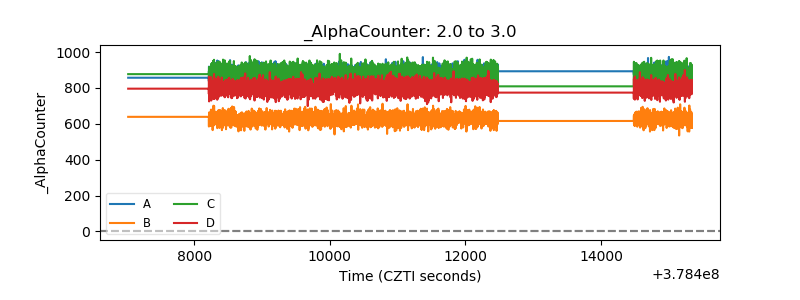 |
| _CPM_Rate | 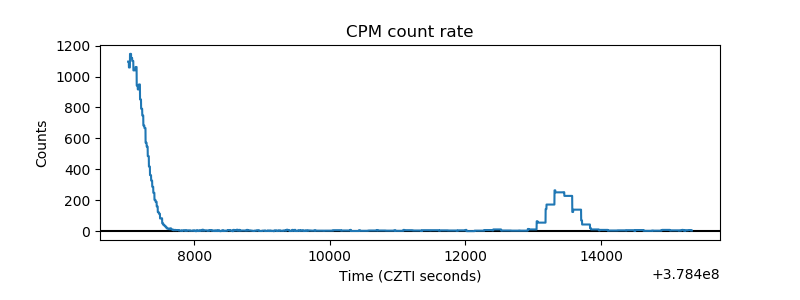 |
| CZT Counter | 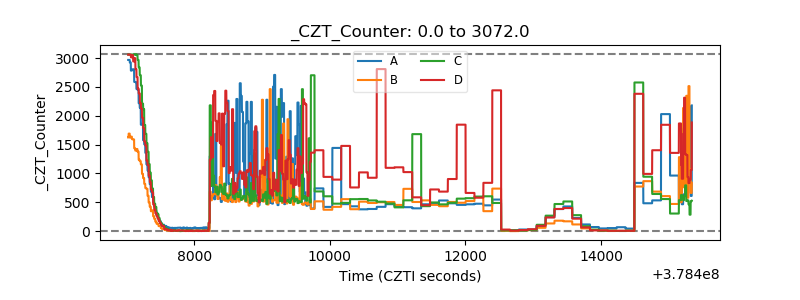 |
| +2.5 Volts monitor |  |
| +5 Volts monitor |  |
| _ROLL_ROT | 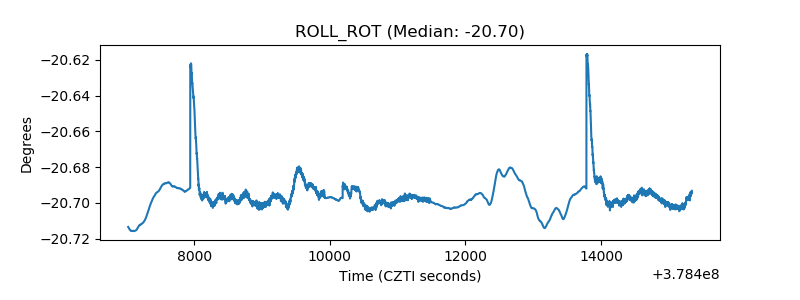 |
| _Roll_DEC | 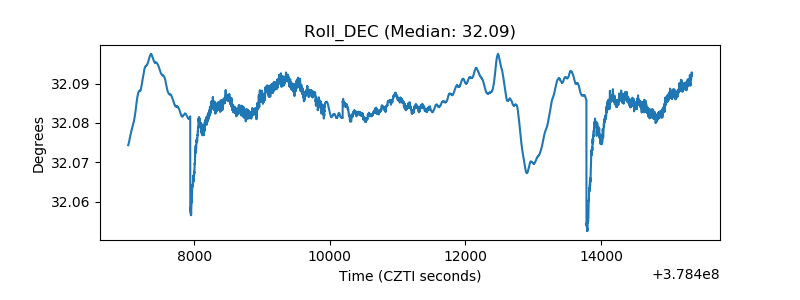 |
| _Roll_RA | 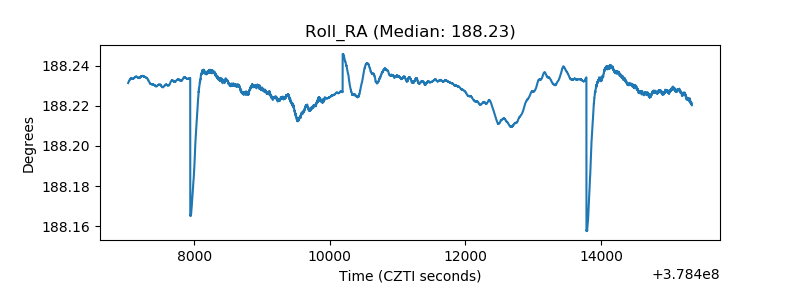 |
| Veto Counter | 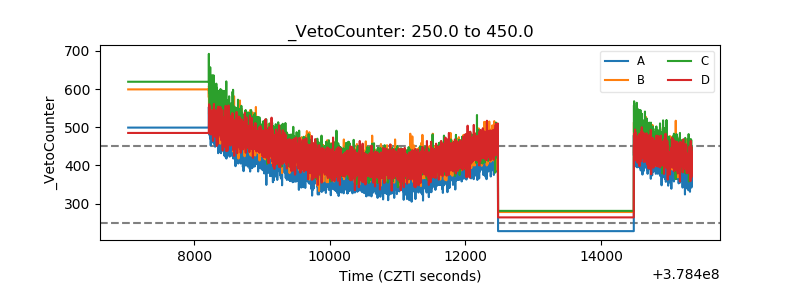 |