| Param | Original file | Final file |
|---|---|---|
| Filename | modeM0/AS1T04_091T01_9000004822_33804cztM0_level2.evt | modeM0/AS1T04_091T01_9000004822_33804cztM0_level2_quad_clean.evt |
| Size (bytes) | 266,451,840 | 39,202,560 |
| Size | 254.1 MB | 37.4 MB |
| Events in quadrant A | 1,783,393 | 245,638 |
| Events in quadrant B | 1,802,325 | 263,615 |
| Events in quadrant C | 1,580,854 | 259,327 |
| Events in quadrant D | 2,705,283 | 212,162 |
| Mode SS | |||
|---|---|---|---|
| Quadrant | BADHDUFLAG | Total packets | Discarded packets |
| A | 0 | 108 | 50 |
| B | 0 | 109 | 49 |
| C | 0 | 109 | 49 |
| D | 0 | 110 | 52 |
| Mode M0 | |||
|---|---|---|---|
| Quadrant | BADHDUFLAG | Total packets | Discarded packets |
| A | 0 | 13914 | 6679 |
| B | 0 | 13458 | 6024 |
| C | 0 | 12428 | 5926 |
| D | 0 | 21437 | 11585 |
| Mode M9 | |||
|---|---|---|---|
| Quadrant | BADHDUFLAG | Total packets | Discarded packets |
| A | 0 | 23 | 13 |
| B | 0 | 23 | 9 |
| C | 0 | 22 | 12 |
| D | 0 | 22 | 13 |
| Quadrant | Total seconds | Saturated seconds | Saturation percentage |
|---|---|---|---|
| A | 2898 | 164 | 5.659075% |
| B | 3008 | 68 | 2.260638% |
| C | 2974 | 15 | 0.504371% |
| D | 2603 | 298 | 11.448329% |
Noise dominated data is calculated using 1-second bins in cleaned event files. If a bin has >2000 counts, and if more than 50% of those come from <1% of pixels, then it is considered to be noise-dominated and hence unusable.
| Quadrant | # 1 sec bins | Bins with >0 counts | Bins with >2000 counts | High rate bins dominated by noise | Noise dominated (total time) | Noise dominated (detector-on time) | Marked lightcurve |
|---|---|---|---|---|---|---|---|
| A | 4868 | 3452 | 87 | 87 | 1.79% | 2.52% | 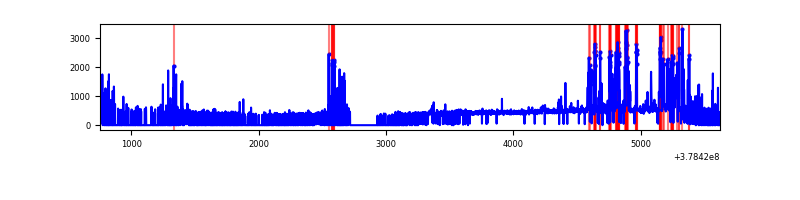 |
| B | 4868 | 3628 | 27 | 27 | 0.55% | 0.74% | 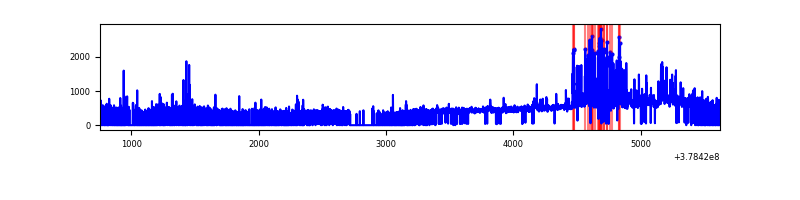 |
| C | 4868 | 3549 | 8 | 8 | 0.16% | 0.23% | 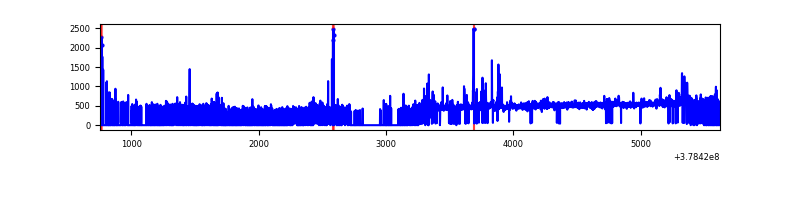 |
| D | 4843 | 3051 | 234 | 234 | 4.83% | 7.67% | 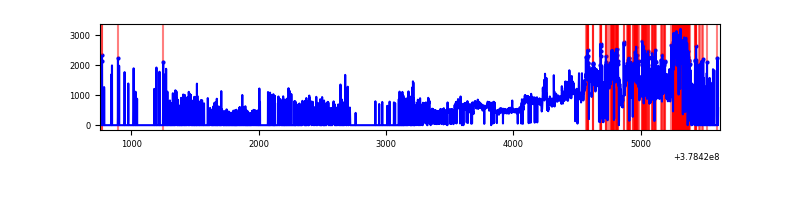 |
Top three noisy pixels from each quadrant. If the there are fewer than three noisy pixels in the level2.evt file, extra rows are filled as -1
| Pixel properties | Quadrant properties | ||||||
|---|---|---|---|---|---|---|---|
| Quadrant | DetID | PixID | Counts | Sigma | Mean | Median | Sigma |
| A | 15 | 237 | 468990 | 6697.3 | 336 | 329 | 70.0 |
| A | 13 | 6 | 9288 | 128.03 | 336 | 329 | 70.0 |
| A | 13 | 254 | 5377 | 72.14 | 336 | 329 | 70.0 |
| B | 5 | 172 | 256504 | 3726.38 | 350 | 342 | 68.7 |
| B | 0 | 219 | 42353 | 611.13 | 350 | 342 | 68.7 |
| B | 5 | 255 | 37924 | 546.7 | 350 | 342 | 68.7 |
| C | 15 | 214 | 100330 | 1255.48 | 341 | 344 | 79.6 |
| C | 0 | 207 | 43844 | 546.21 | 341 | 344 | 79.6 |
| C | 9 | 187 | 24344 | 301.36 | 341 | 344 | 79.6 |
| D | 8 | 195 | 521609 | 7258.98 | 288 | 280 | 71.8 |
| D | 12 | 235 | 438340 | 6099.54 | 288 | 280 | 71.8 |
| D | 12 | 233 | 325568 | 4529.31 | 288 | 280 | 71.8 |
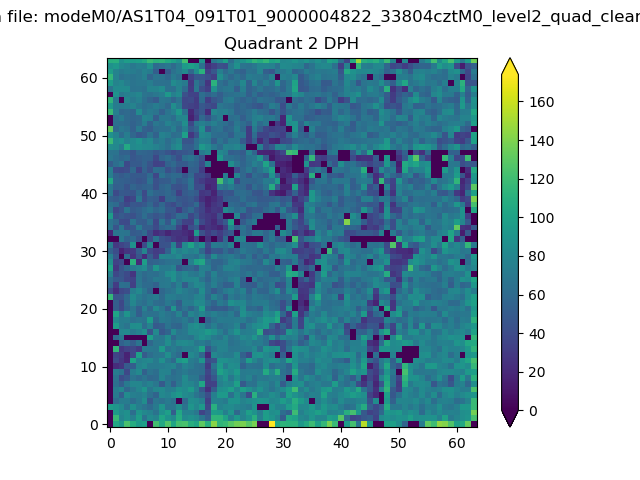
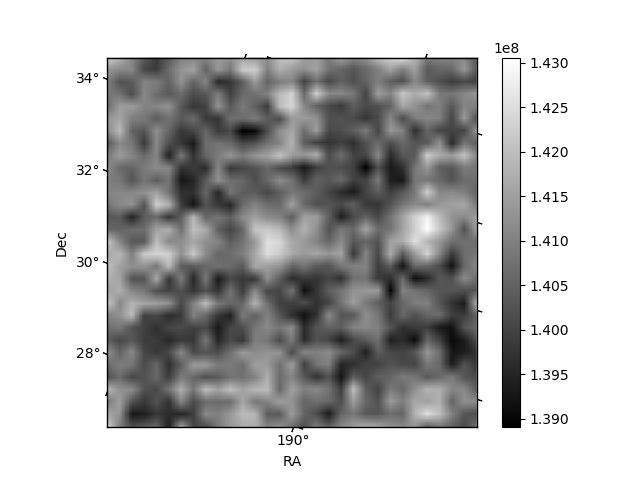
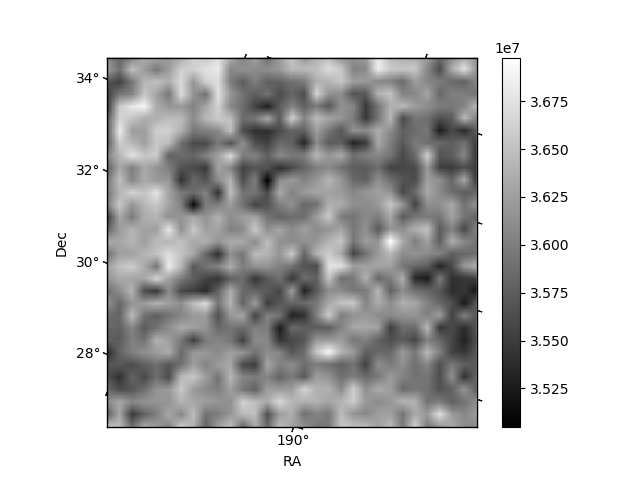
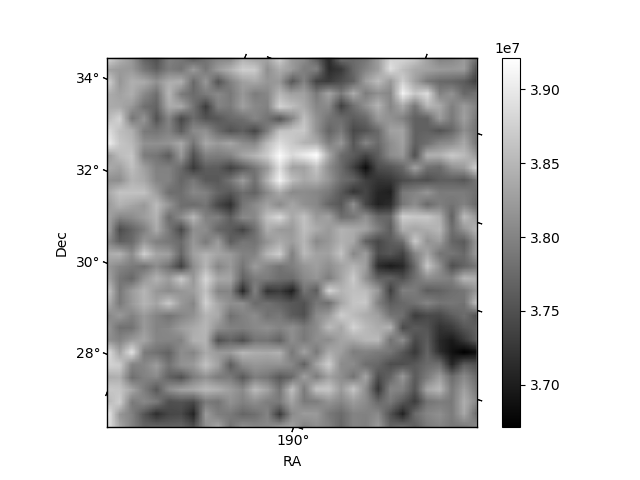
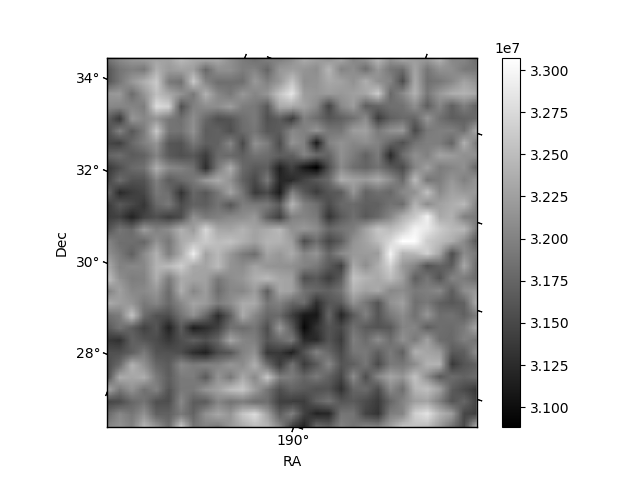
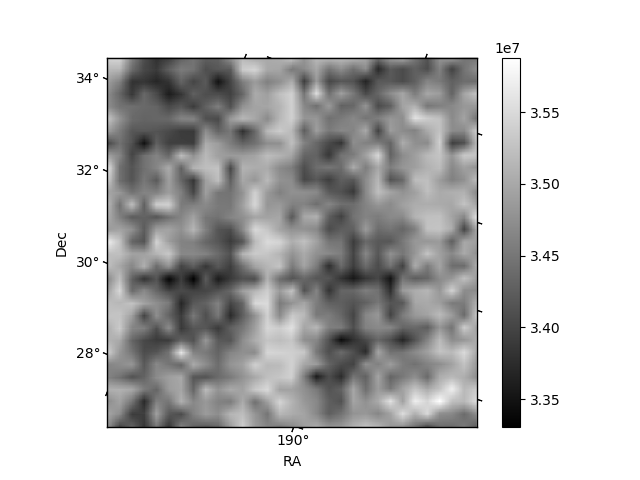
Histogram calculated using DETX and DETY for each event in the final _common_clean file
| Quadrant A | 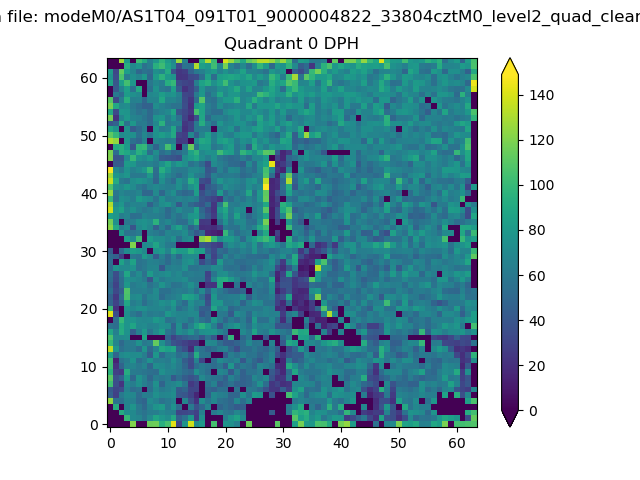 |
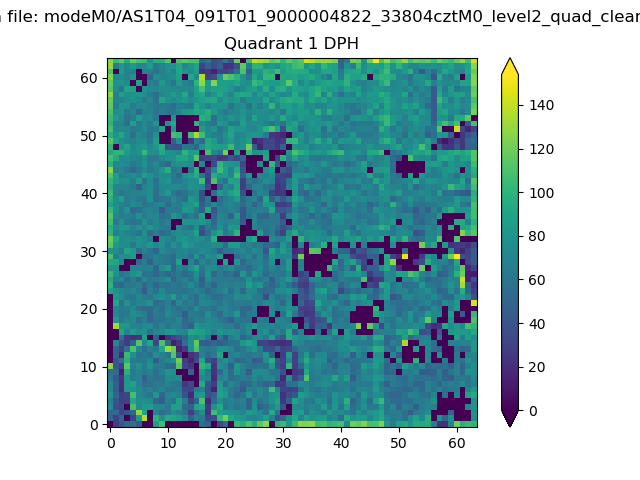 |
Quadrant B |
|---|---|---|---|
| Quadrant D | 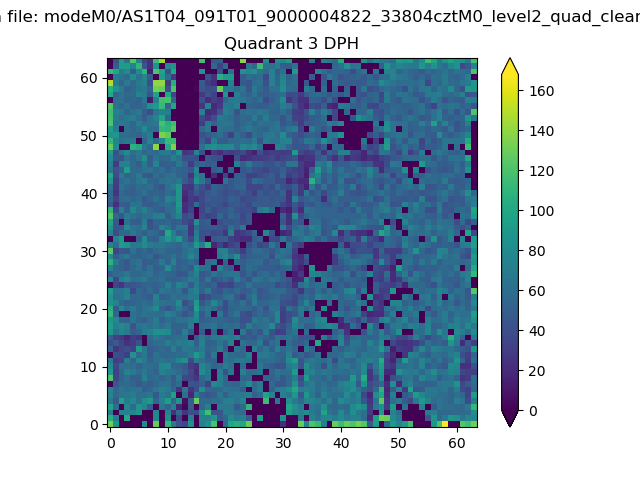 |
 |
Quadrant C |
| Plot type | Count rate plots | Images |
|---|---|---|
| Comparison with Poisson distribution Blue bars denote a histogram of data divided into 1 sec bins. Red curve is a Poisson curve with rate = median count rate of data. |
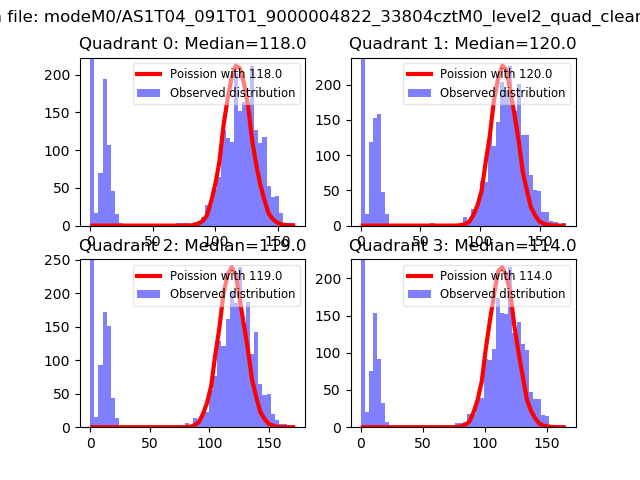 |
 |
| Quadrant-wise count rates Data is divided into 100 sec bins |
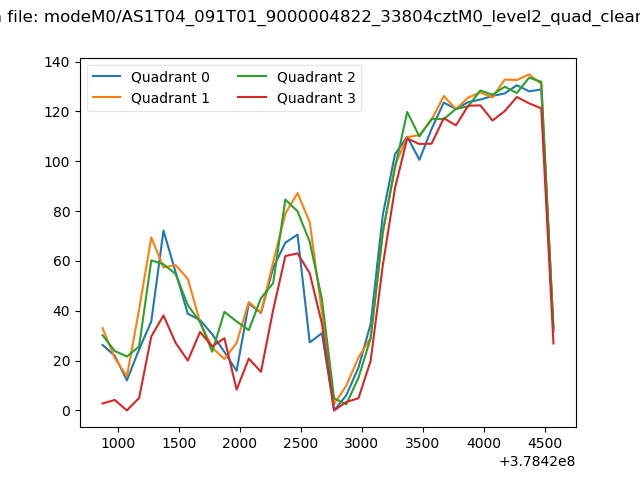 |
|
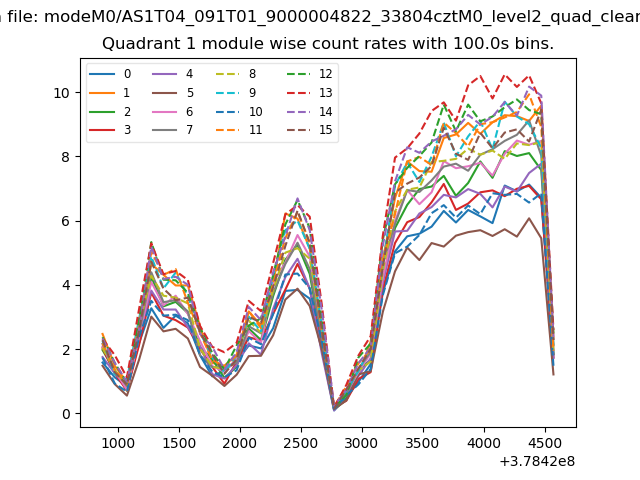
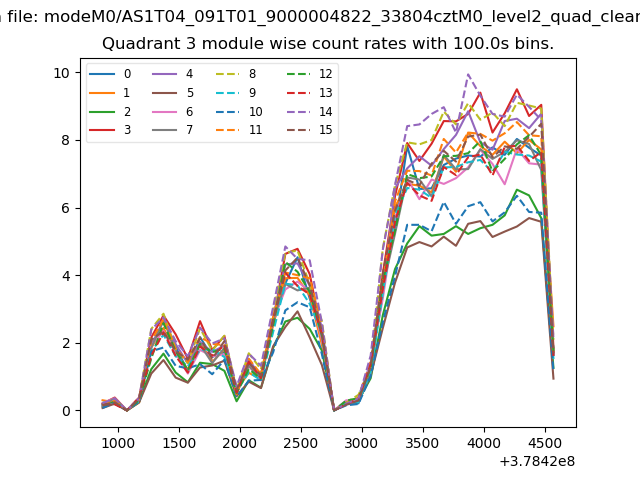
| Module-wise count rates for Quadrant A Data is divided into 100 sec bins |
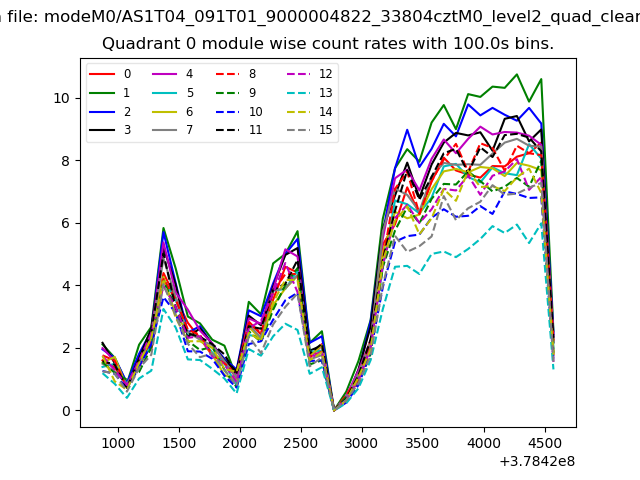 |
 |
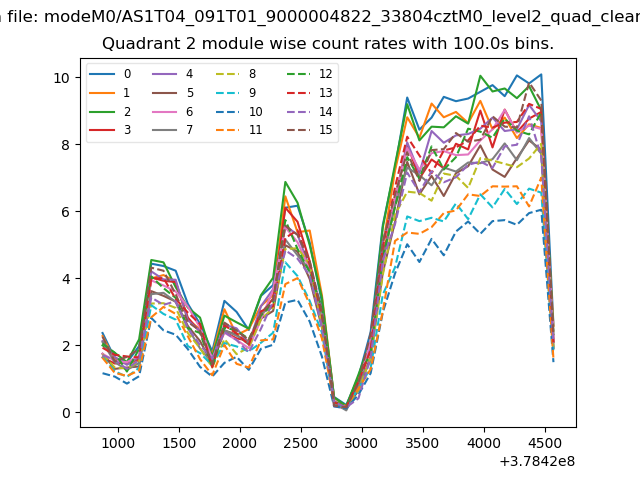
| Module-wise count rates for Quadrant B Data is divided into 100 sec bins |
 |
 |
| Module-wise count rates for Quadrant C Data is divided into 100 sec bins |
 |
 |
| Module-wise count rates for Quadrant D Data is divided into 100 sec bins |
 |
 |
| Parameter | Plot |
|---|---|
| CZT HV Monitor | 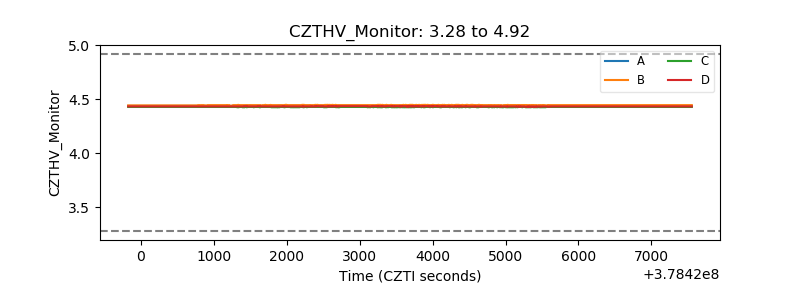 |
| D_VDD | 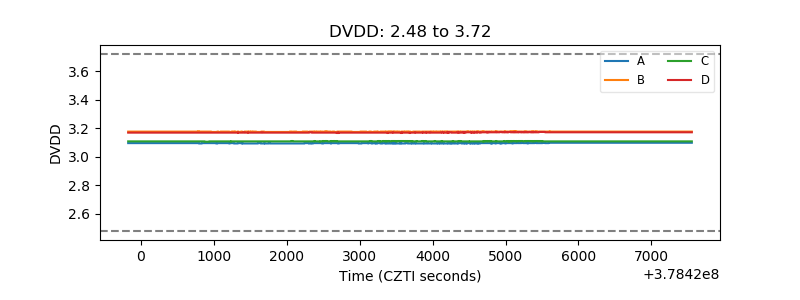 |
| Temperature 1 | 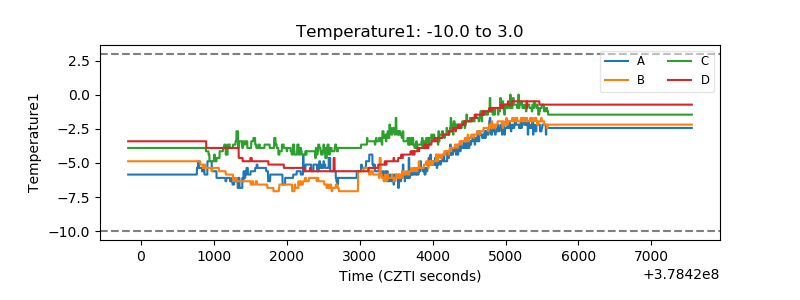 |
| Veto HV Monitor | 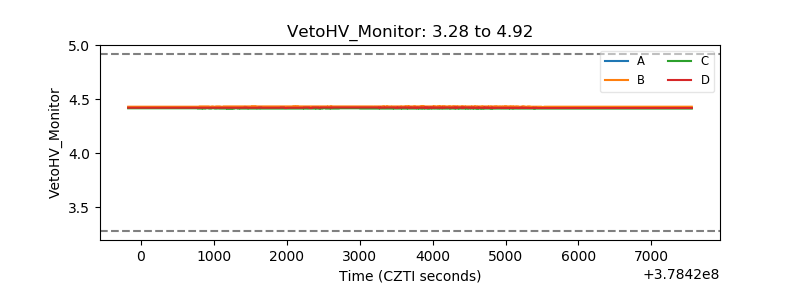 |
| Veto LLD | 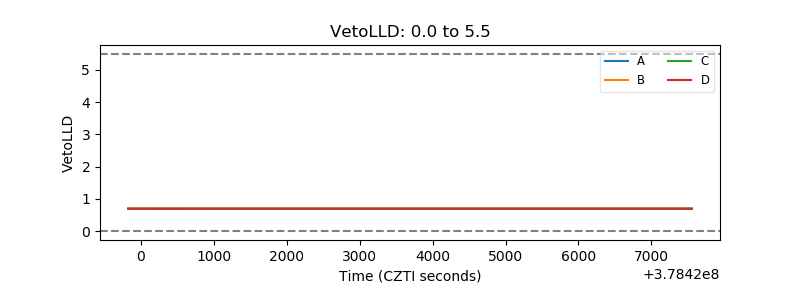 |
| Alpha Counter | 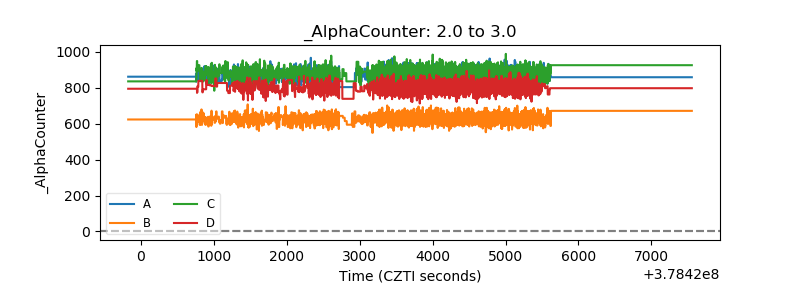 |
| _CPM_Rate | 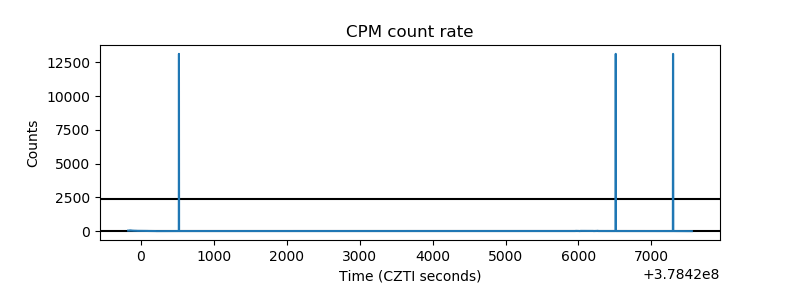 |
| CZT Counter | 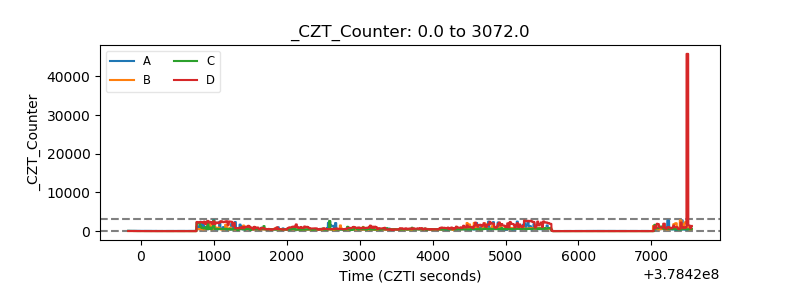 |
| +2.5 Volts monitor |  |
| +5 Volts monitor |  |
| _ROLL_ROT | 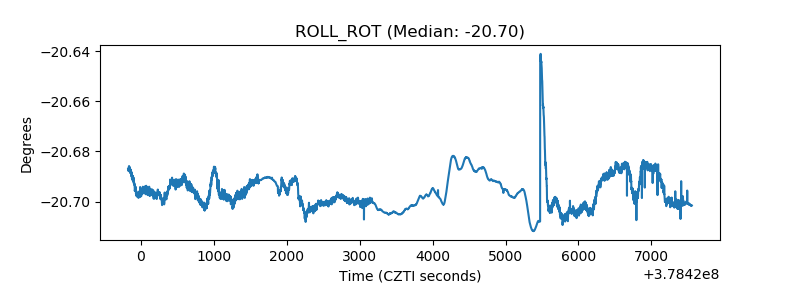 |
| _Roll_DEC |  |
| _Roll_RA | 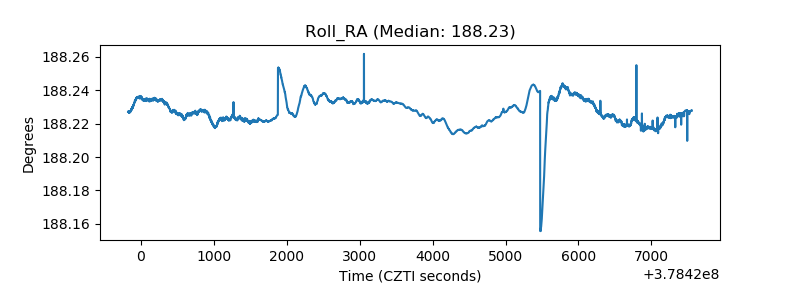 |
| Veto Counter | 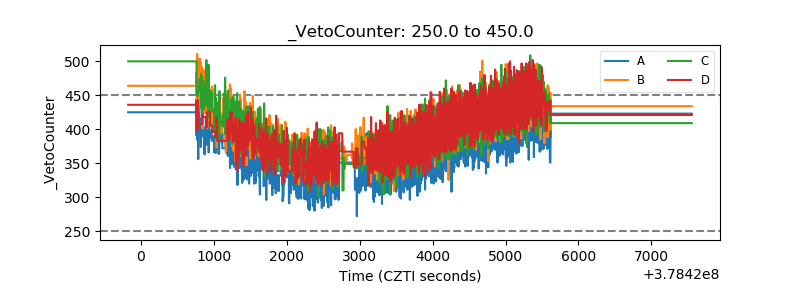 |