| Param | Original file | Final file |
|---|---|---|
| Filename | modeM0/AS1T04_091T01_9000004822_33808cztM0_level2.evt | modeM0/AS1T04_091T01_9000004822_33808cztM0_level2_quad_clean.evt |
| Size (bytes) | 477,702,720 | 75,948,480 |
| Size | 455.6 MB | 72.4 MB |
| Events in quadrant A | 3,118,763 | 487,155 |
| Events in quadrant B | 3,078,816 | 497,892 |
| Events in quadrant C | 2,743,279 | 498,138 |
| Events in quadrant D | 5,186,499 | 465,178 |
| Mode SS | |||
|---|---|---|---|
| Quadrant | BADHDUFLAG | Total packets | Discarded packets |
| A | 0 | 102 | 0 |
| B | 0 | 102 | 0 |
| C | 0 | 102 | 0 |
| D | 0 | 102 | 0 |
| Mode M0 | |||
|---|---|---|---|
| Quadrant | BADHDUFLAG | Total packets | Discarded packets |
| A | 0 | 12721 | 1 |
| B | 0 | 12663 | 1 |
| C | 0 | 11275 | 1 |
| D | 0 | 18879 | 1 |
| Mode M9 | |||
|---|---|---|---|
| Quadrant | BADHDUFLAG | Total packets | Discarded packets |
| A | 0 | 14 | 0 |
| B | 0 | 14 | 0 |
| C | 0 | 14 | 0 |
| D | 0 | 14 | 0 |
| Quadrant | Total seconds | Saturated seconds | Saturation percentage |
|---|---|---|---|
| A | 5012 | 289 | 5.766161% |
| B | 5012 | 165 | 3.292099% |
| C | 5012 | 43 | 0.857941% |
| D | 5012 | 586 | 11.691939% |
Noise dominated data is calculated using 1-second bins in cleaned event files. If a bin has >2000 counts, and if more than 50% of those come from <1% of pixels, then it is considered to be noise-dominated and hence unusable.
| Quadrant | # 1 sec bins | Bins with >0 counts | Bins with >2000 counts | High rate bins dominated by noise | Noise dominated (total time) | Noise dominated (detector-on time) | Marked lightcurve |
|---|---|---|---|---|---|---|---|
| A | 6413 | 5012 | 198 | 198 | 3.09% | 3.95% | 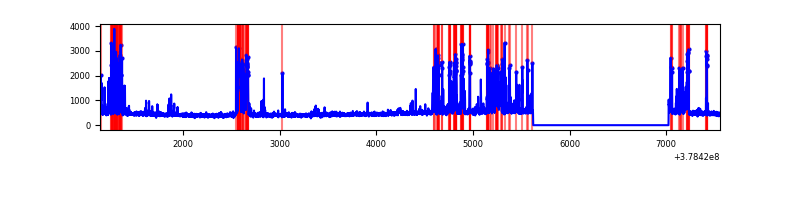 |
| B | 6413 | 5012 | 95 | 95 | 1.48% | 1.90% | 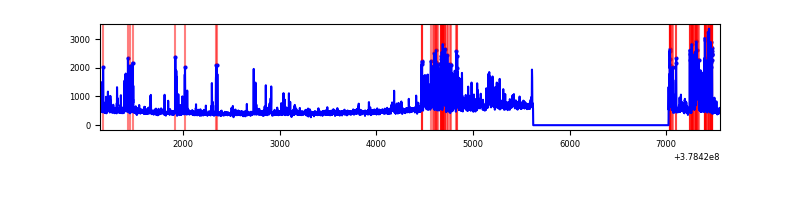 |
| C | 6413 | 5012 | 32 | 32 | 0.50% | 0.64% | 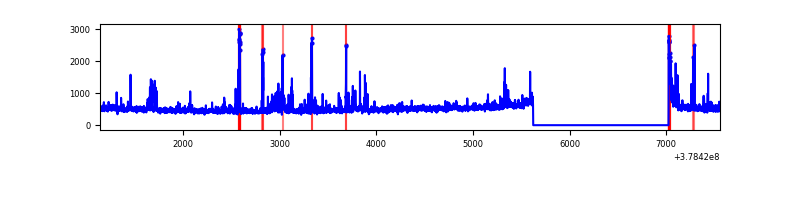 |
| D | 6413 | 5012 | 512 | 512 | 7.98% | 10.22% | 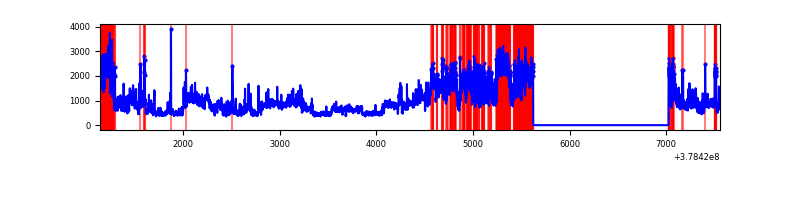 |
Top three noisy pixels from each quadrant. If the there are fewer than three noisy pixels in the level2.evt file, extra rows are filled as -1
| Pixel properties | Quadrant properties | ||||||
|---|---|---|---|---|---|---|---|
| Quadrant | DetID | PixID | Counts | Sigma | Mean | Median | Sigma |
| A | 15 | 237 | 909669 | 7892.06 | 564 | 554 | 115.2 |
| A | 13 | 6 | 15322 | 128.2 | 564 | 554 | 115.2 |
| A | 15 | 169 | 9917 | 81.28 | 564 | 554 | 115.2 |
| B | 5 | 172 | 536327 | 4900.22 | 569 | 556 | 109.3 |
| B | 5 | 255 | 62364 | 565.3 | 569 | 556 | 109.3 |
| B | 0 | 219 | 52730 | 477.19 | 569 | 556 | 109.3 |
| C | 15 | 214 | 175962 | 1339.77 | 562 | 568 | 130.9 |
| C | 0 | 207 | 76215 | 577.84 | 562 | 568 | 130.9 |
| C | 9 | 187 | 62473 | 472.87 | 562 | 568 | 130.9 |
| D | 8 | 195 | 1082496 | 8040.22 | 536 | 521 | 134.6 |
| D | 12 | 235 | 858477 | 6375.52 | 536 | 521 | 134.6 |
| D | 12 | 233 | 448864 | 3331.66 | 536 | 521 | 134.6 |
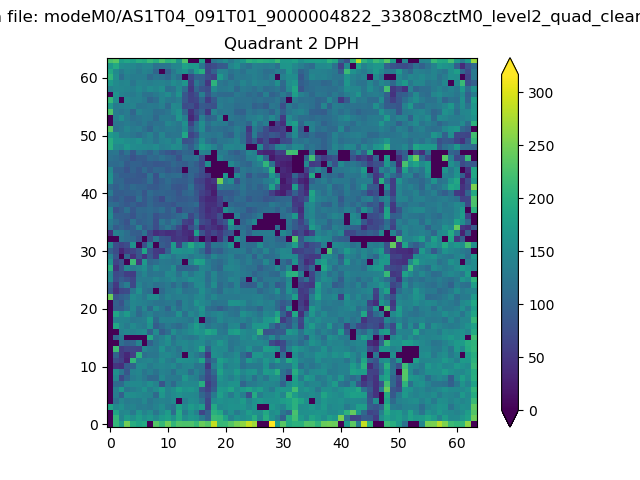
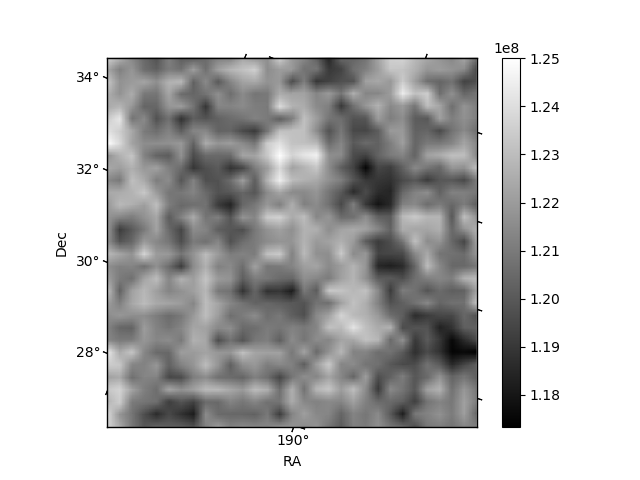
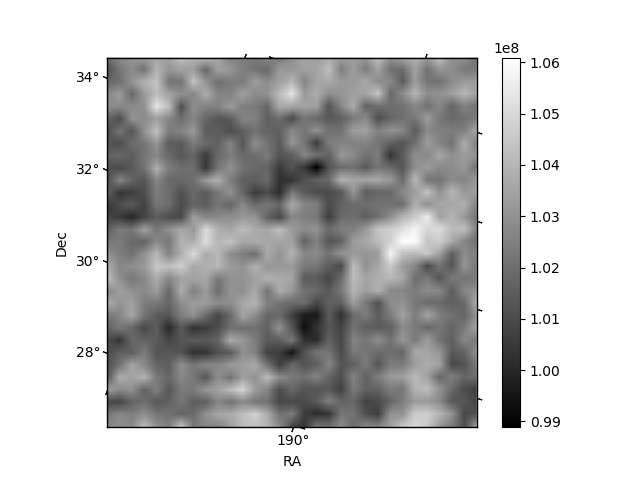
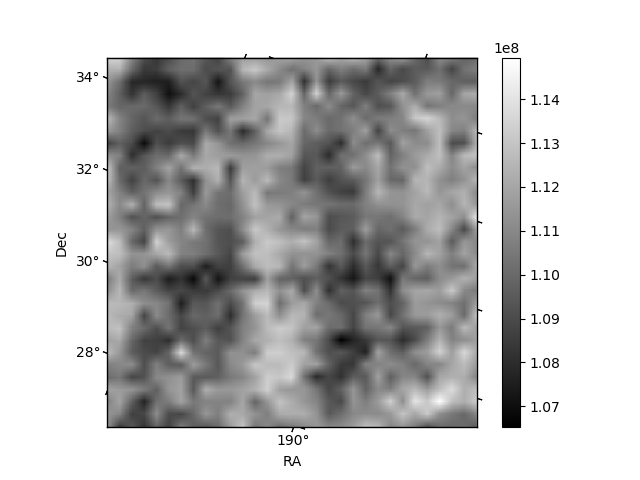
Histogram calculated using DETX and DETY for each event in the final _common_clean file
| Quadrant A | 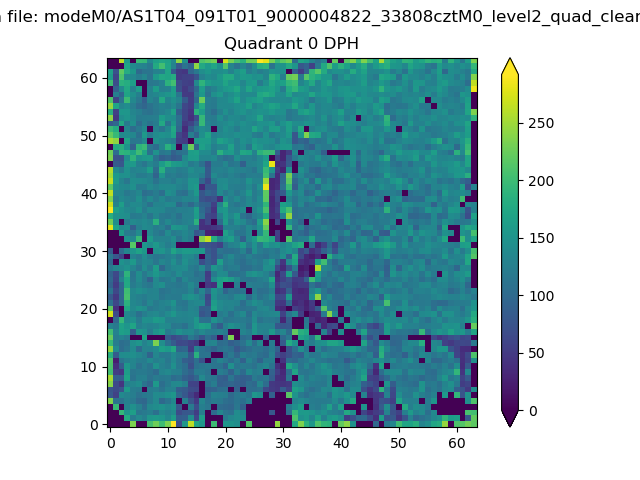 |
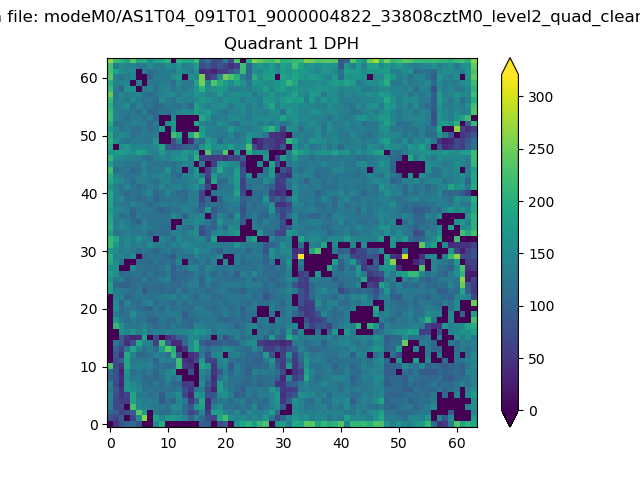 |
Quadrant B |
|---|---|---|---|
| Quadrant D | 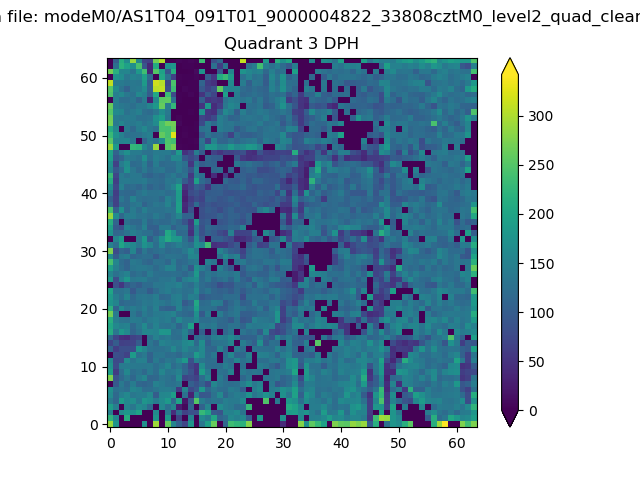 |
 |
Quadrant C |
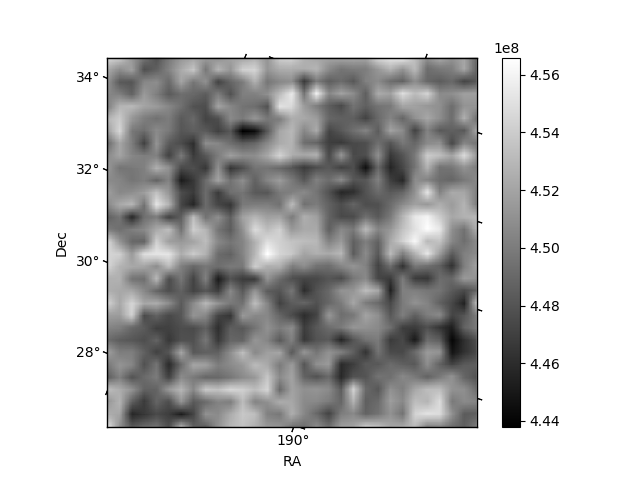
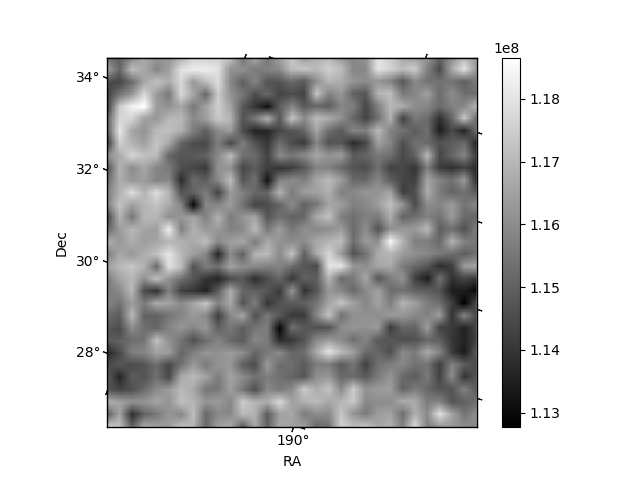
| Plot type | Count rate plots | Images |
|---|---|---|
| Comparison with Poisson distribution Blue bars denote a histogram of data divided into 1 sec bins. Red curve is a Poisson curve with rate = median count rate of data. |
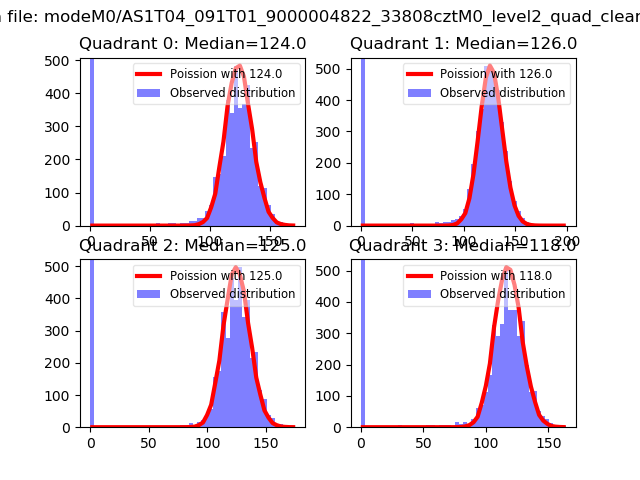 |
 |
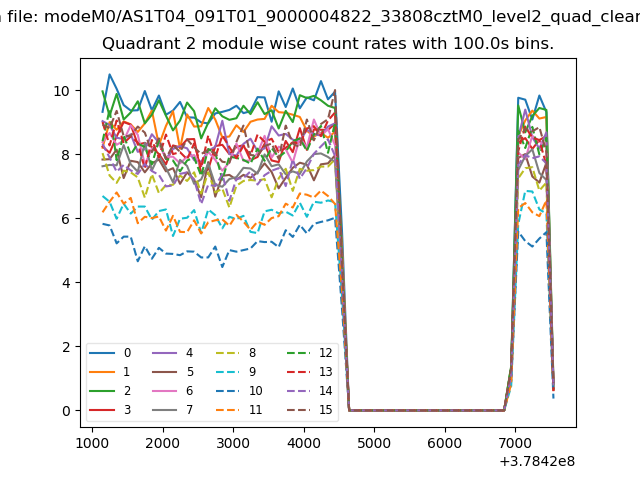
| Quadrant-wise count rates Data is divided into 100 sec bins |
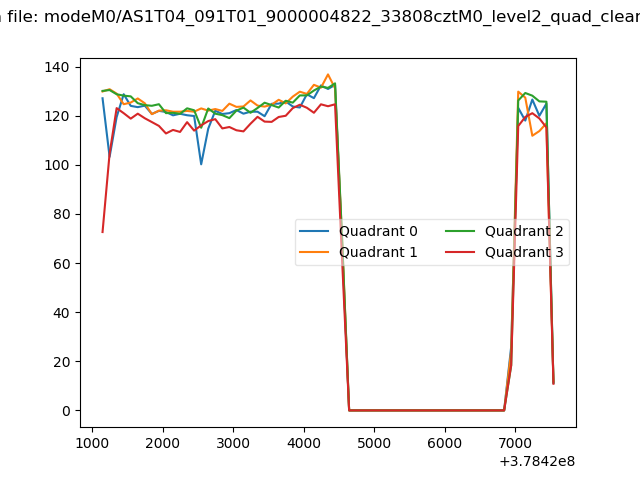 |
|
| Module-wise count rates for Quadrant A Data is divided into 100 sec bins |
 |
 |
| Module-wise count rates for Quadrant B Data is divided into 100 sec bins |
 |
 |
| Module-wise count rates for Quadrant C Data is divided into 100 sec bins |
 |
 |
| Module-wise count rates for Quadrant D Data is divided into 100 sec bins |
 |
 |
| Parameter | Plot |
|---|---|
| CZT HV Monitor |  |
| D_VDD | 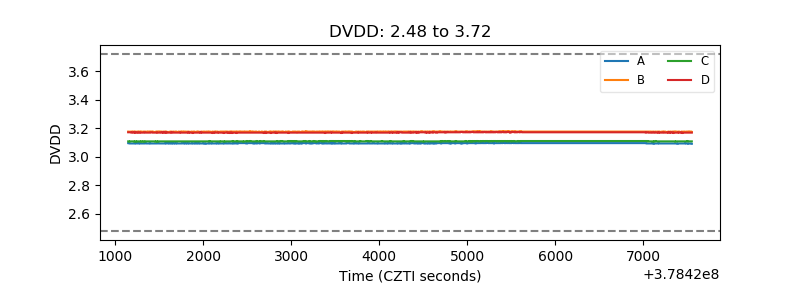 |
| Temperature 1 | 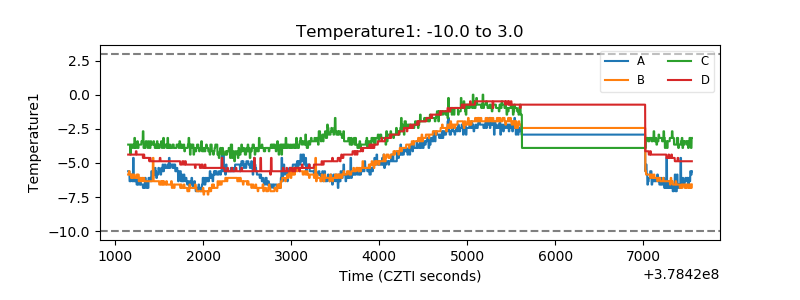 |
| Veto HV Monitor |  |
| Veto LLD | 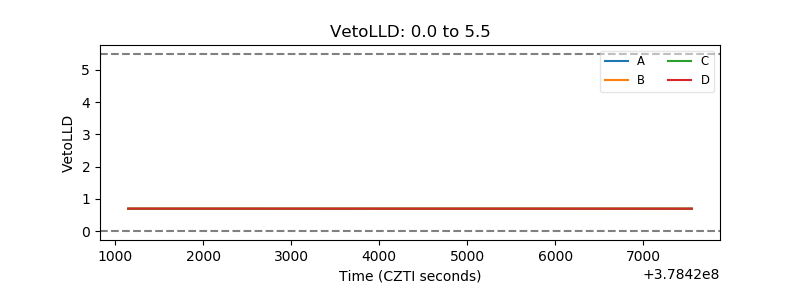 |
| Alpha Counter | 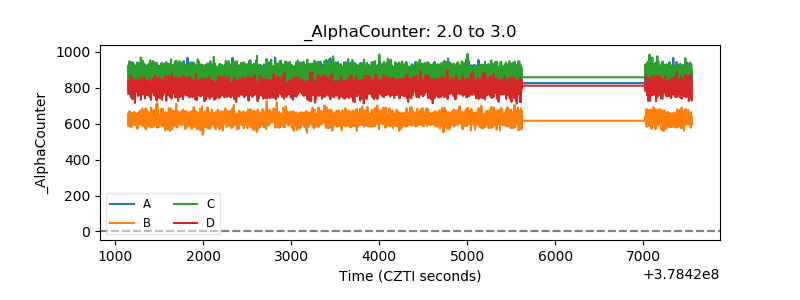 |
| _CPM_Rate | 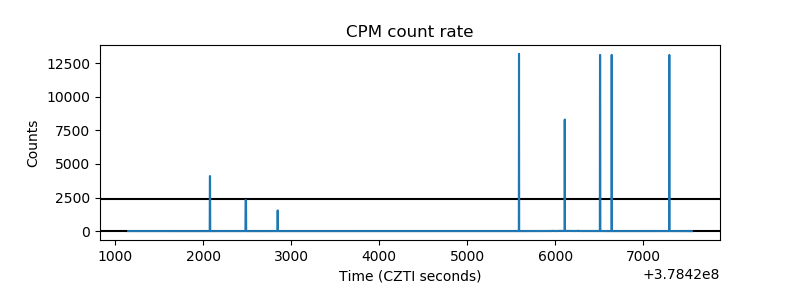 |
| CZT Counter | 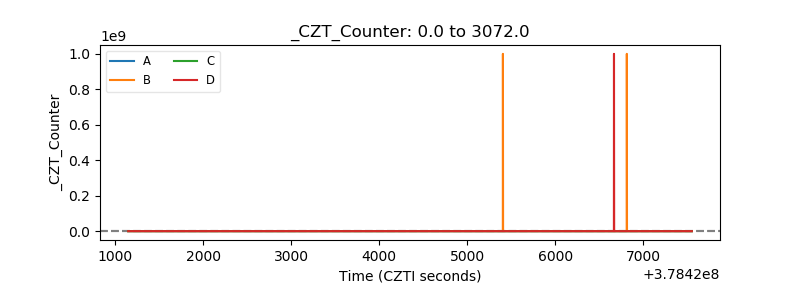 |
| +2.5 Volts monitor |  |
| +5 Volts monitor | 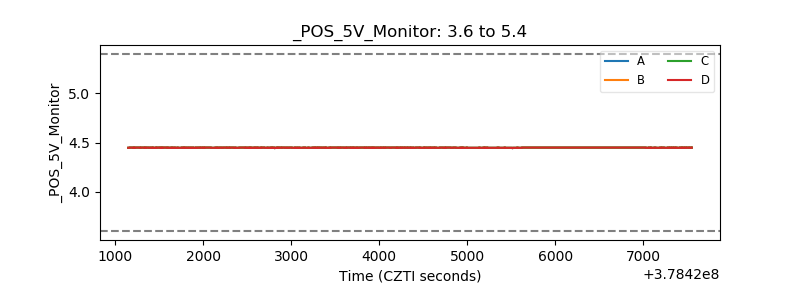 |
| _ROLL_ROT | 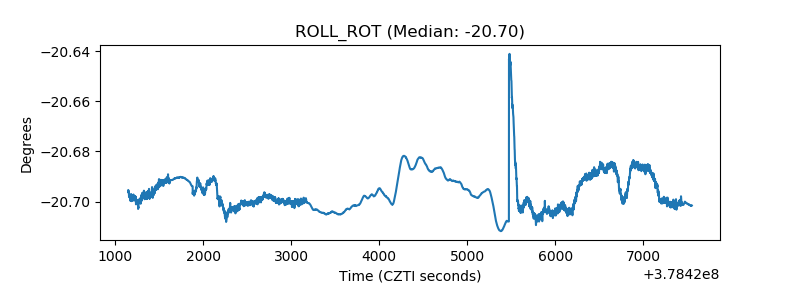 |
| _Roll_DEC | 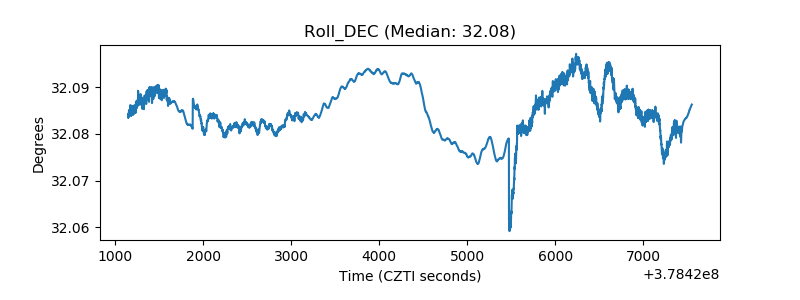 |
| _Roll_RA | 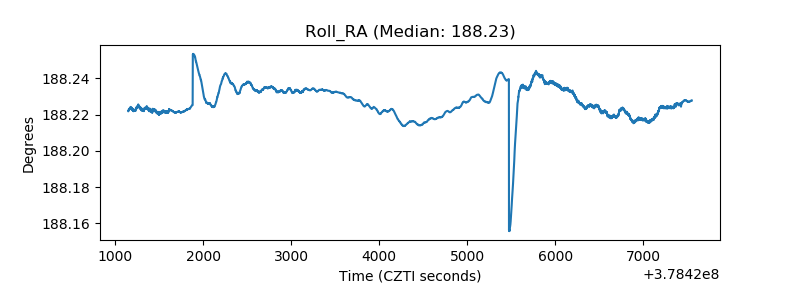 |
| Veto Counter |  |