| Param | Original file | Final file |
|---|---|---|
| Filename | modeM0/AS1A11_106T03_9000004826_33815cztM0_level2.evt | modeM0/AS1A11_106T03_9000004826_33815cztM0_level2_quad_clean.evt |
| Size (bytes) | 160,064,640 | 20,208,960 |
| Size | 152.6 MB | 19.3 MB |
| Events in quadrant A | 806,693 | 125,461 |
| Events in quadrant B | 999,852 | 126,488 |
| Events in quadrant C | 1,060,387 | 127,333 |
| Events in quadrant D | 1,872,525 | 116,885 |
| Mode M9 | |||
|---|---|---|---|
| Quadrant | BADHDUFLAG | Total packets | Discarded packets |
| A | 0 | 22 | 0 |
| B | 0 | 22 | 0 |
| C | 0 | 22 | 0 |
| D | 0 | 22 | 0 |
| Mode SS | |||
|---|---|---|---|
| Quadrant | BADHDUFLAG | Total packets | Discarded packets |
| A | 0 | 32 | 0 |
| B | 0 | 32 | 0 |
| C | 0 | 32 | 0 |
| D | 0 | 32 | 0 |
| Mode M0 | |||
|---|---|---|---|
| Quadrant | BADHDUFLAG | Total packets | Discarded packets |
| A | 0 | 3274 | 1 |
| B | 0 | 3977 | 0 |
| C | 0 | 4190 | 0 |
| D | 0 | 6682 | 0 |
| Quadrant | Total seconds | Saturated seconds | Saturation percentage |
|---|---|---|---|
| A | 1562 | 2 | 0.128041% |
| B | 1562 | 40 | 2.560819% |
| C | 1562 | 66 | 4.225352% |
| D | 1562 | 183 | 11.715749% |
Noise dominated data is calculated using 1-second bins in cleaned event files. If a bin has >2000 counts, and if more than 50% of those come from <1% of pixels, then it is considered to be noise-dominated and hence unusable.
| Quadrant | # 1 sec bins | Bins with >0 counts | Bins with >2000 counts | High rate bins dominated by noise | Noise dominated (total time) | Noise dominated (detector-on time) | Marked lightcurve |
|---|---|---|---|---|---|---|---|
| A | 3715 | 1563 | 0 | 0 | 0.00% | 0.00% |  |
| B | 3715 | 1563 | 14 | 14 | 0.38% | 0.90% |  |
| C | 3715 | 1563 | 48 | 48 | 1.29% | 3.07% |  |
| D | 3715 | 1563 | 105 | 105 | 2.83% | 6.72% |  |
Top three noisy pixels from each quadrant. If the there are fewer than three noisy pixels in the level2.evt file, extra rows are filled as -1
| Pixel properties | Quadrant properties | ||||||
|---|---|---|---|---|---|---|---|
| Quadrant | DetID | PixID | Counts | Sigma | Mean | Median | Sigma |
| A | 13 | 6 | 6051 | 136.18 | 205 | 200 | 43.0 |
| A | 10 | 83 | 5107 | 114.2 | 205 | 200 | 43.0 |
| A | 15 | 169 | 3233 | 70.59 | 205 | 200 | 43.0 |
| B | 5 | 172 | 80262 | 1999.3 | 202 | 198 | 40.0 |
| B | 0 | 213 | 34759 | 863.03 | 202 | 198 | 40.0 |
| B | 0 | 229 | 22118 | 547.37 | 202 | 198 | 40.0 |
| C | 0 | 10 | 177957 | 3854.38 | 196 | 198 | 46.1 |
| C | 15 | 214 | 60747 | 1312.89 | 196 | 198 | 46.1 |
| C | 3 | 233 | 19546 | 419.53 | 196 | 198 | 46.1 |
| D | 8 | 195 | 338369 | 6420.14 | 193 | 189 | 52.7 |
| D | 12 | 235 | 240820 | 4568.23 | 193 | 189 | 52.7 |
| D | 2 | 152 | 207557 | 3936.75 | 193 | 189 | 52.7 |
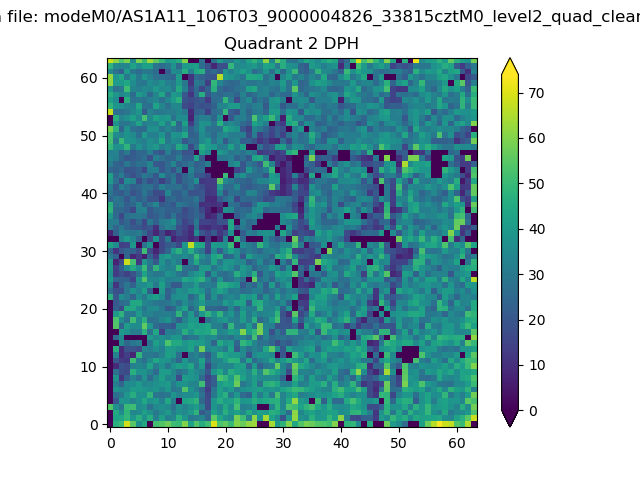
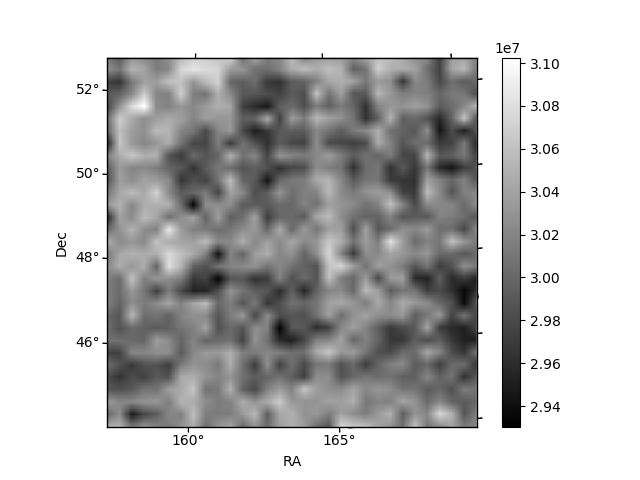
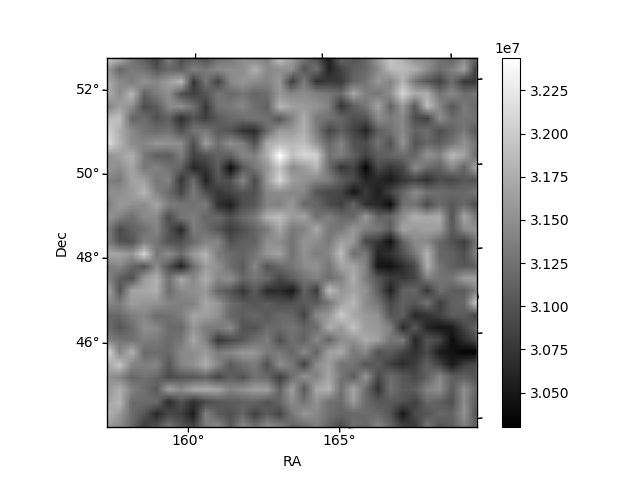
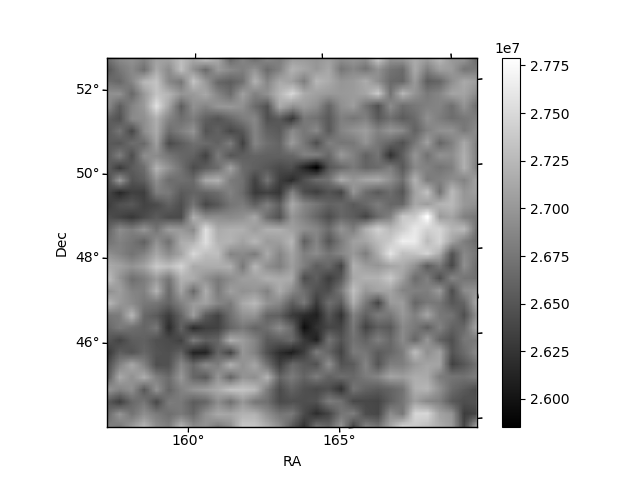
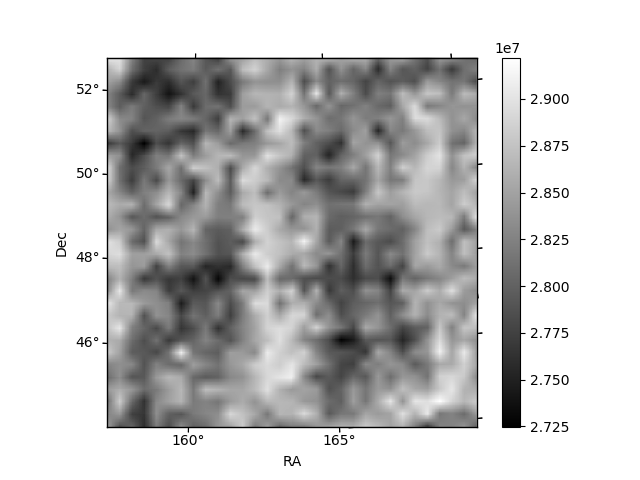
Histogram calculated using DETX and DETY for each event in the final _common_clean file
| Quadrant A | 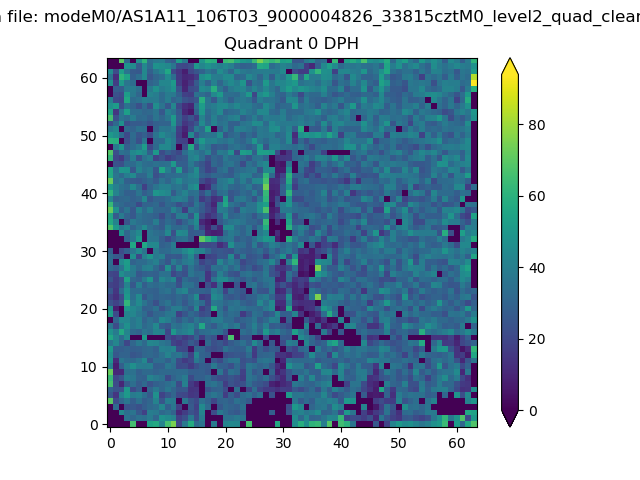 |
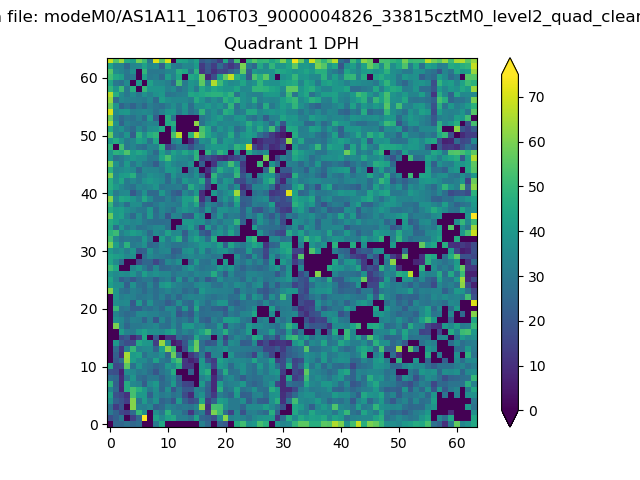 |
Quadrant B |
|---|---|---|---|
| Quadrant D | 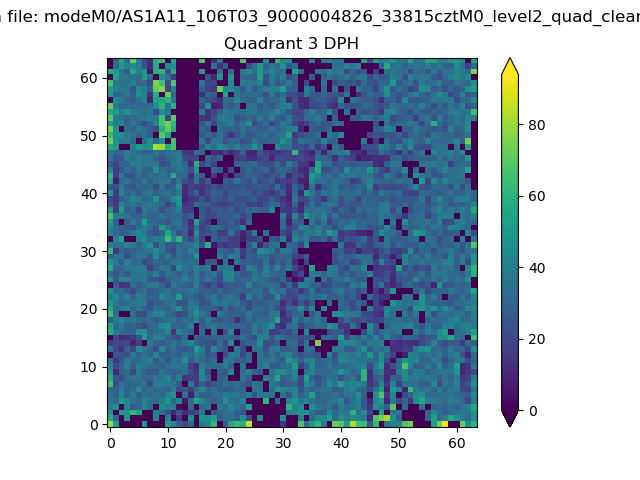 |
 |
Quadrant C |
| Plot type | Count rate plots | Images |
|---|---|---|
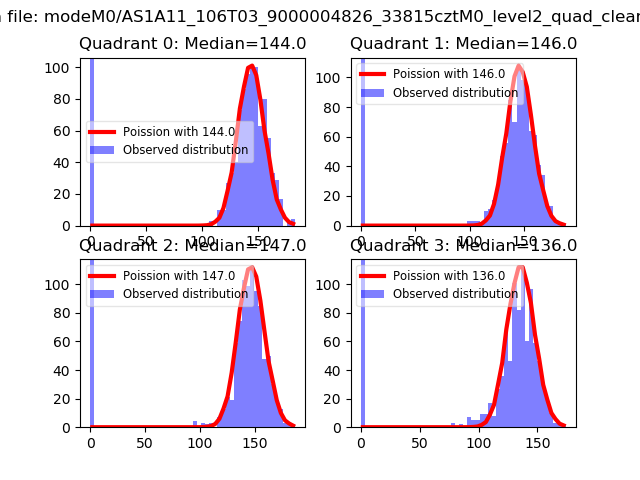
| Comparison with Poisson distribution Blue bars denote a histogram of data divided into 1 sec bins. Red curve is a Poisson curve with rate = median count rate of data. |
 |
 |
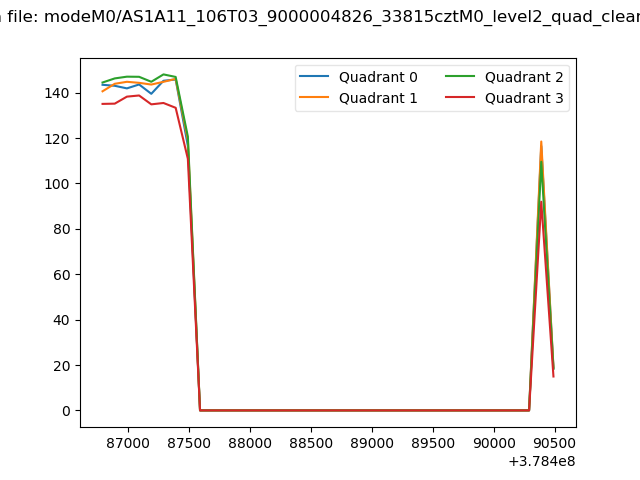
| Quadrant-wise count rates Data is divided into 100 sec bins |
 |
|
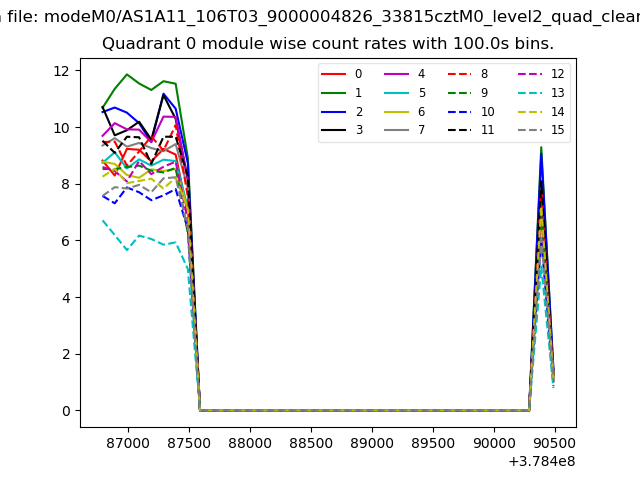
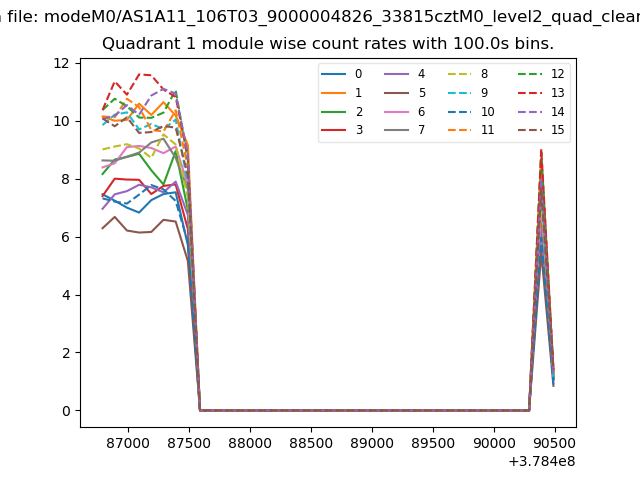
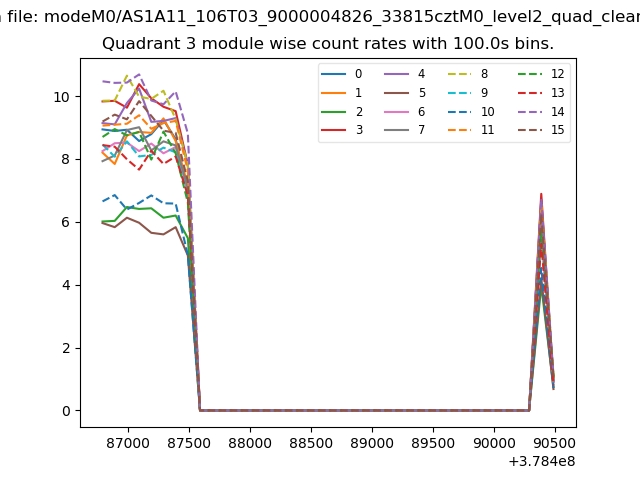
| Module-wise count rates for Quadrant A Data is divided into 100 sec bins |
 |
 |
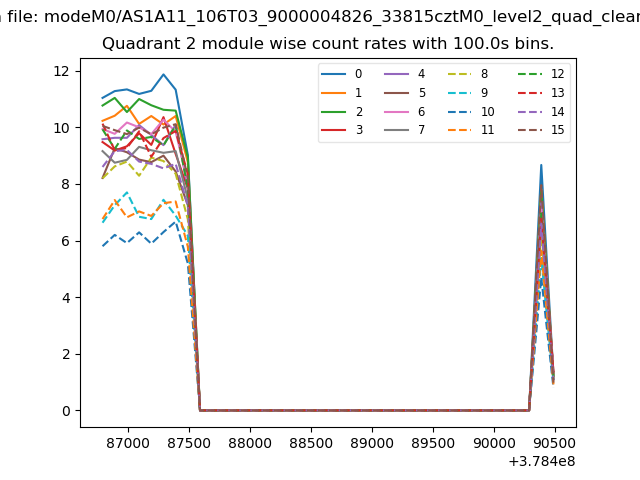
| Module-wise count rates for Quadrant B Data is divided into 100 sec bins |
 |
 |
| Module-wise count rates for Quadrant C Data is divided into 100 sec bins |
 |
 |
| Module-wise count rates for Quadrant D Data is divided into 100 sec bins |
 |
 |
| Parameter | Plot |
|---|---|
| CZT HV Monitor | 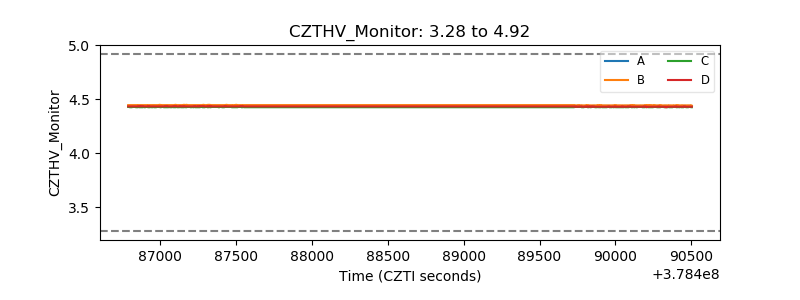 |
| D_VDD | 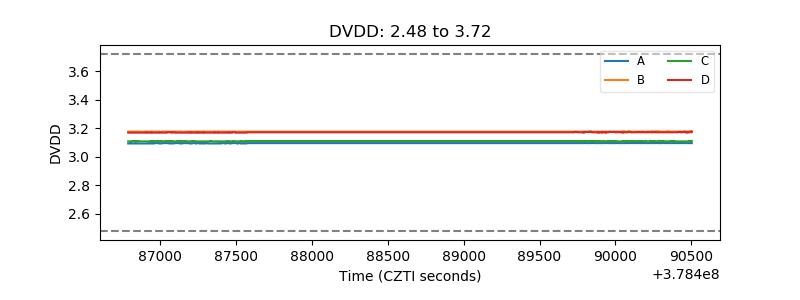 |
| Temperature 1 | 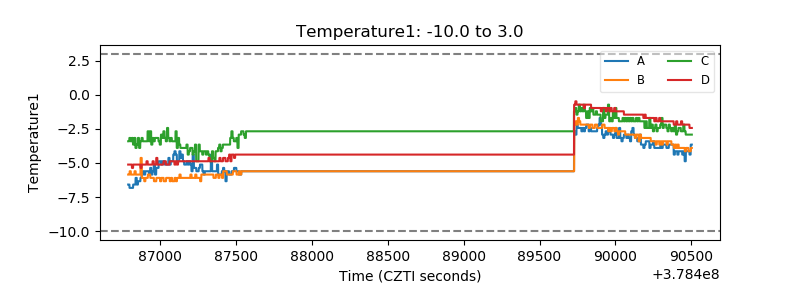 |
| Veto HV Monitor | 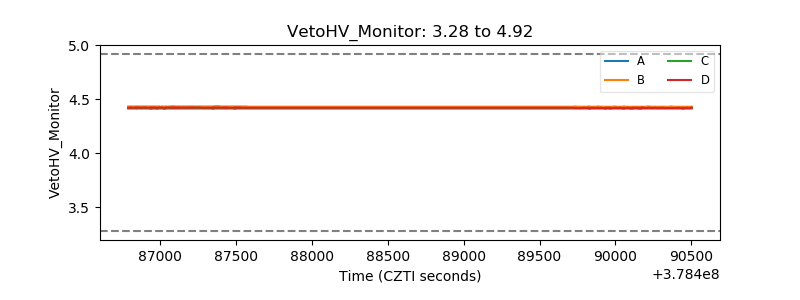 |
| Veto LLD | 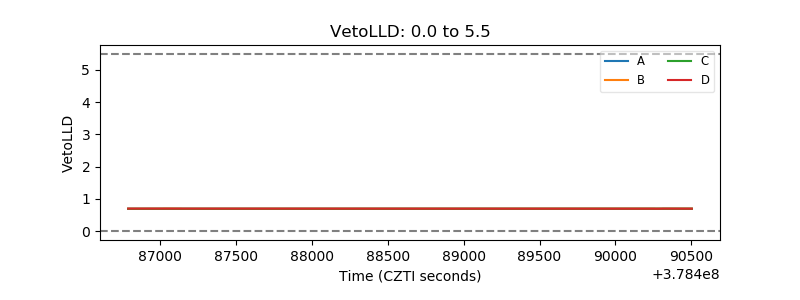 |
| Alpha Counter | 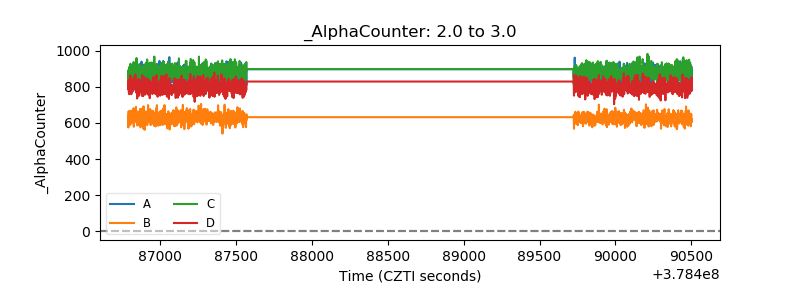 |
| _CPM_Rate | 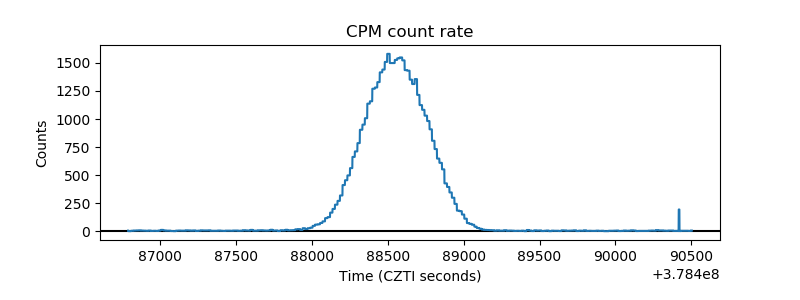 |
| CZT Counter | 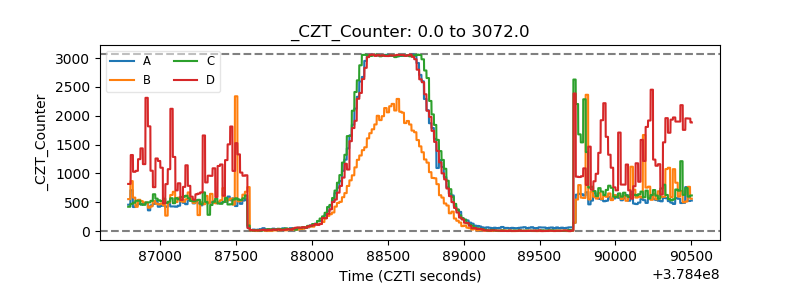 |
| +2.5 Volts monitor |  |
| +5 Volts monitor |  |
| _ROLL_ROT | 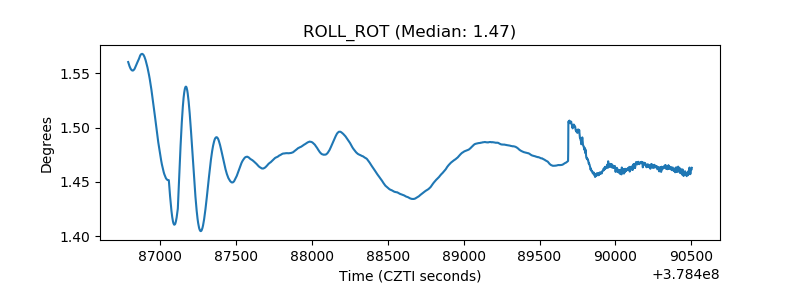 |
| _Roll_DEC | 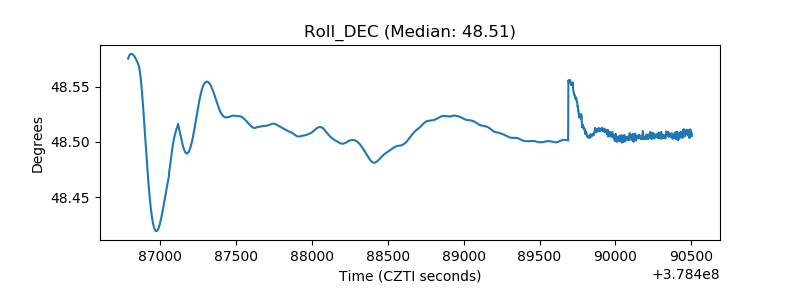 |
| _Roll_RA | 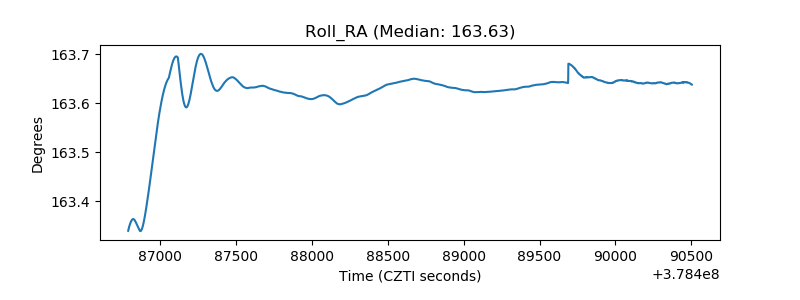 |
| Veto Counter | 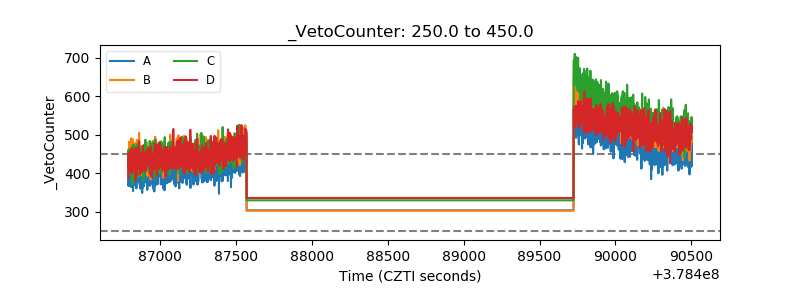 |