| Param | Original file | Final file |
|---|---|---|
| Filename | modeM0/AS1A11_106T03_9000004826_33818cztM0_level2.evt | modeM0/AS1A11_106T03_9000004826_33818cztM0_level2_quad_clean.evt |
| Size (bytes) | 500,999,040 | 90,912,960 |
| Size | 477.8 MB | 86.7 MB |
| Events in quadrant A | 2,649,277 | 599,414 |
| Events in quadrant B | 3,982,154 | 582,044 |
| Events in quadrant C | 3,249,809 | 596,703 |
| Events in quadrant D | 4,899,600 | 570,704 |
| Mode M9 | |||
|---|---|---|---|
| Quadrant | BADHDUFLAG | Total packets | Discarded packets |
| A | 0 | 35 | 0 |
| B | 0 | 35 | 0 |
| C | 0 | 35 | 0 |
| D | 0 | 35 | 0 |
| Mode SS | |||
|---|---|---|---|
| Quadrant | BADHDUFLAG | Total packets | Discarded packets |
| A | 0 | 118 | 0 |
| B | 0 | 118 | 0 |
| C | 0 | 118 | 0 |
| D | 0 | 118 | 0 |
| Mode M0 | |||
|---|---|---|---|
| Quadrant | BADHDUFLAG | Total packets | Discarded packets |
| A | 0 | 11785 | 3 |
| B | 0 | 15742 | 2 |
| C | 0 | 13101 | 2 |
| D | 0 | 18531 | 2 |
| Quadrant | Total seconds | Saturated seconds | Saturation percentage |
|---|---|---|---|
| A | 5786 | 18 | 0.311096% |
| B | 5786 | 404 | 6.982371% |
| C | 5786 | 94 | 1.624611% |
| D | 5786 | 138 | 2.385067% |
Noise dominated data is calculated using 1-second bins in cleaned event files. If a bin has >2000 counts, and if more than 50% of those come from <1% of pixels, then it is considered to be noise-dominated and hence unusable.
| Quadrant | # 1 sec bins | Bins with >0 counts | Bins with >2000 counts | High rate bins dominated by noise | Noise dominated (total time) | Noise dominated (detector-on time) | Marked lightcurve |
|---|---|---|---|---|---|---|---|
| A | 9191 | 5788 | 8 | 8 | 0.09% | 0.14% | 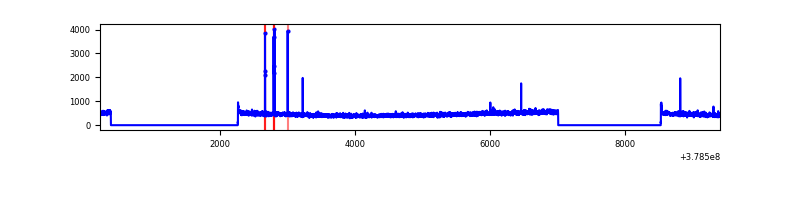 |
| B | 9191 | 5788 | 305 | 305 | 3.32% | 5.27% | 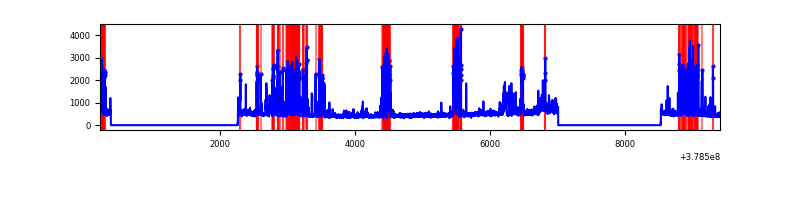 |
| C | 9191 | 5788 | 76 | 76 | 0.83% | 1.31% | 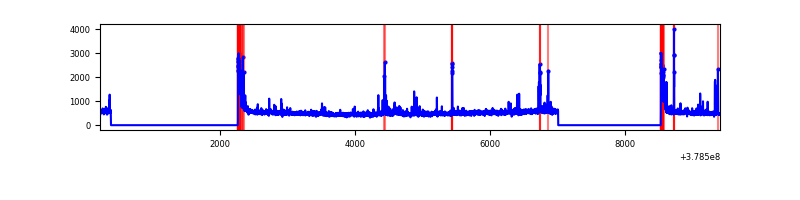 |
| D | 9191 | 5788 | 93 | 93 | 1.01% | 1.61% | 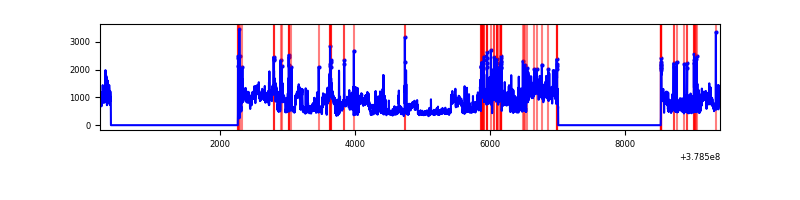 |
Top three noisy pixels from each quadrant. If the there are fewer than three noisy pixels in the level2.evt file, extra rows are filled as -1
| Pixel properties | Quadrant properties | ||||||
|---|---|---|---|---|---|---|---|
| Quadrant | DetID | PixID | Counts | Sigma | Mean | Median | Sigma |
| A | 15 | 169 | 43056 | 317.88 | 666 | 652 | 133.4 |
| A | 13 | 6 | 19972 | 144.83 | 666 | 652 | 133.4 |
| A | 10 | 83 | 10706 | 75.37 | 666 | 652 | 133.4 |
| B | 5 | 172 | 1011447 | 8255.5 | 646 | 630 | 122.4 |
| B | 4 | 251 | 231593 | 1886.31 | 646 | 630 | 122.4 |
| B | 0 | 189 | 63533 | 513.74 | 646 | 630 | 122.4 |
| C | 15 | 214 | 248847 | 1659.06 | 648 | 656 | 149.6 |
| C | 0 | 10 | 214036 | 1426.36 | 648 | 656 | 149.6 |
| C | 14 | 254 | 160778 | 1070.35 | 648 | 656 | 149.6 |
| D | 8 | 195 | 1562358 | 8993.15 | 642 | 629 | 173.7 |
| D | 2 | 250 | 303601 | 1744.65 | 642 | 629 | 173.7 |
| D | 12 | 235 | 232846 | 1337.21 | 642 | 629 | 173.7 |
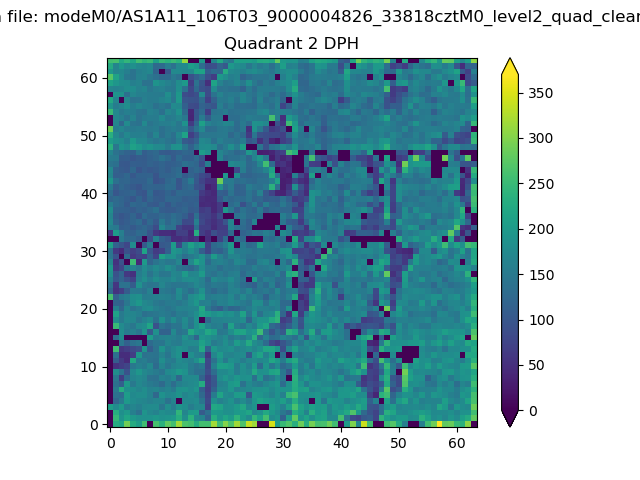
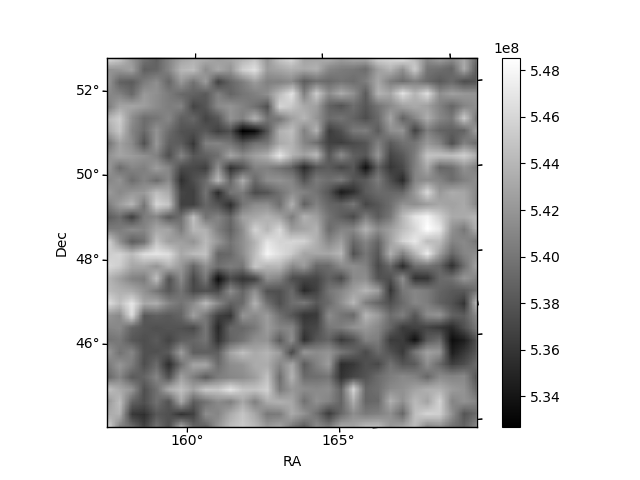
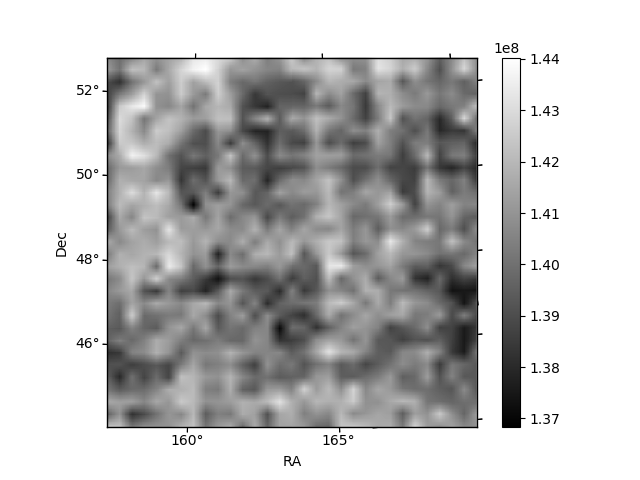
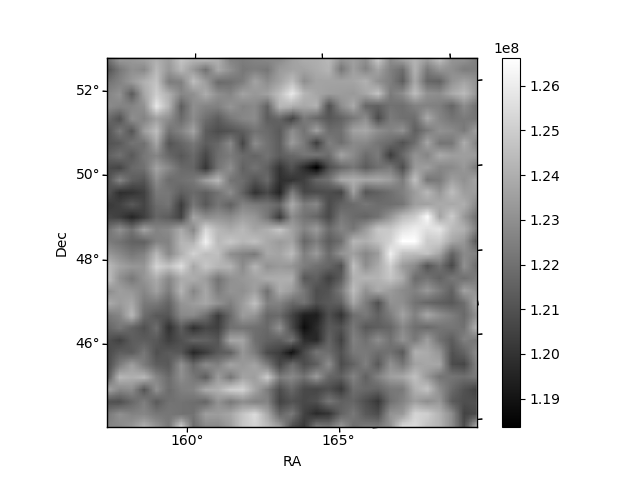
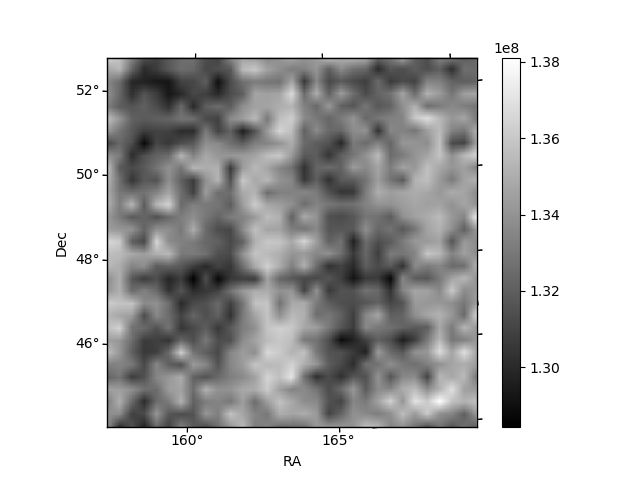
Histogram calculated using DETX and DETY for each event in the final _common_clean file
| Quadrant A | 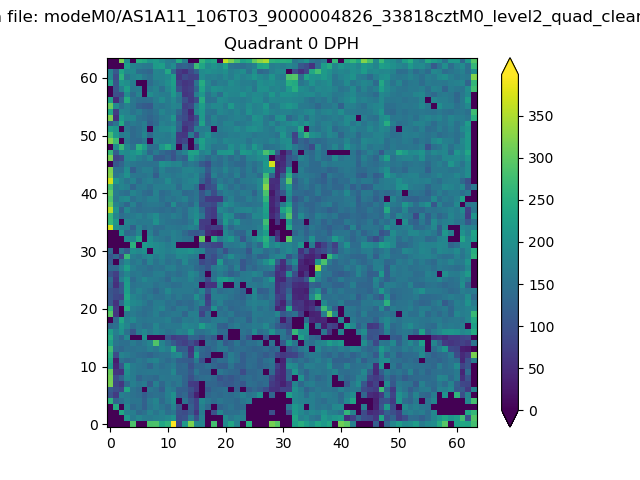 |
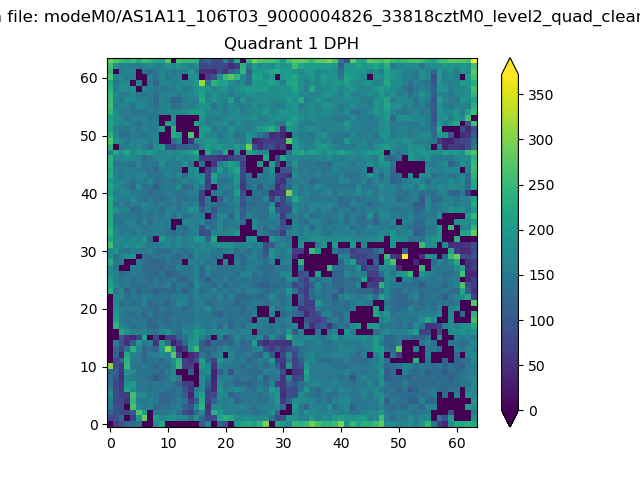 |
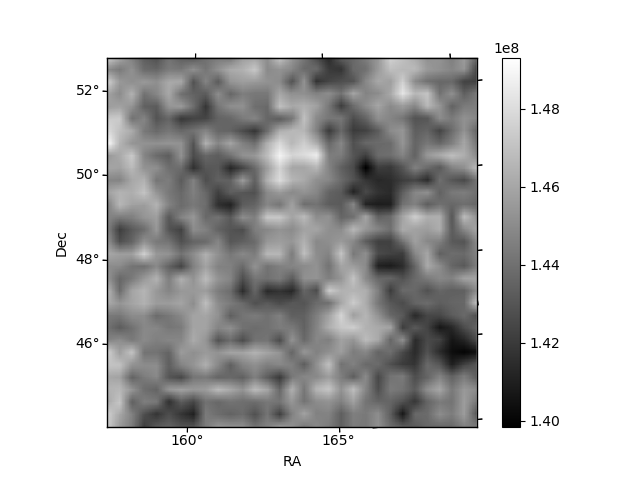
Quadrant B |
|---|---|---|---|
| Quadrant D | 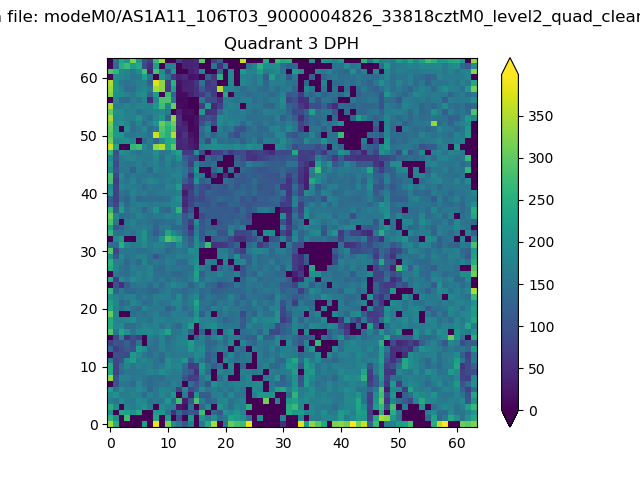 |
 |
Quadrant C |
| Plot type | Count rate plots | Images |
|---|---|---|
| Comparison with Poisson distribution Blue bars denote a histogram of data divided into 1 sec bins. Red curve is a Poisson curve with rate = median count rate of data. |
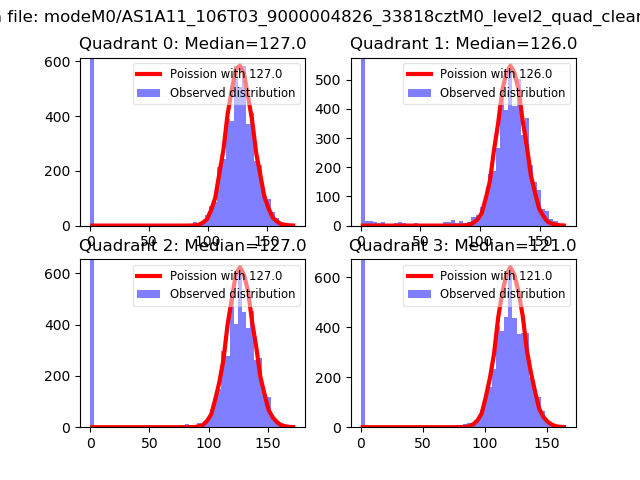 |
 |
| Quadrant-wise count rates Data is divided into 100 sec bins |
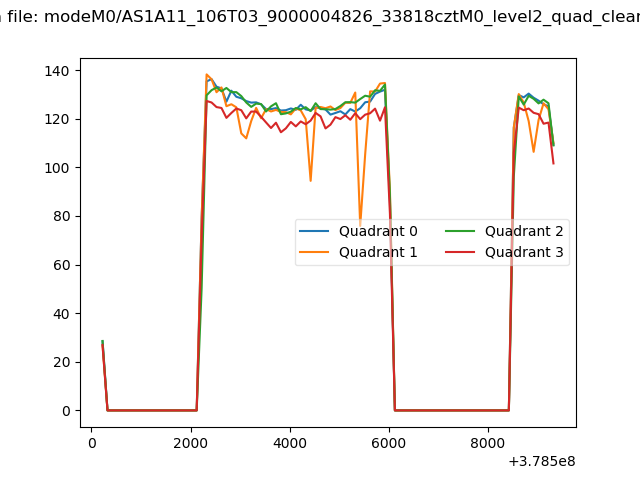 |
|
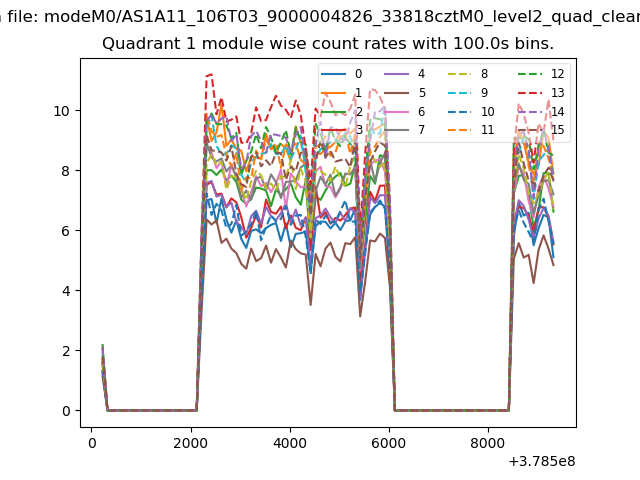
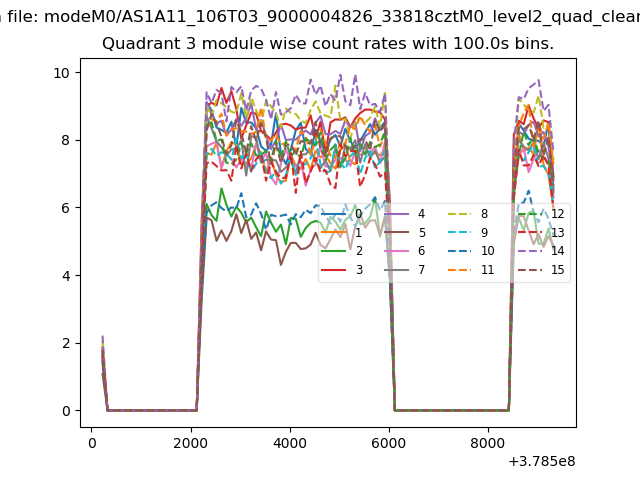
| Module-wise count rates for Quadrant A Data is divided into 100 sec bins |
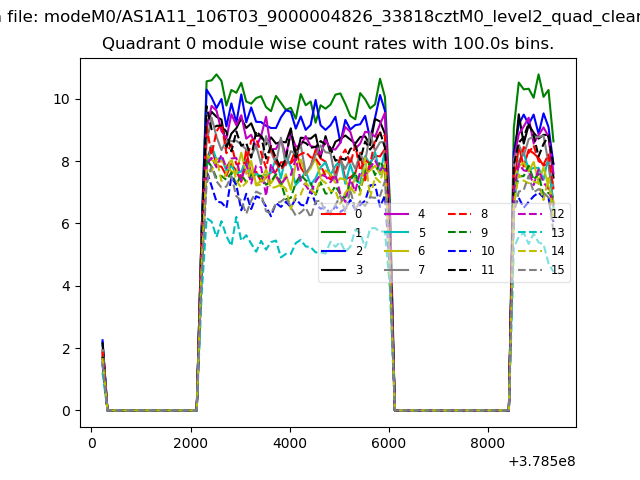 |
 |
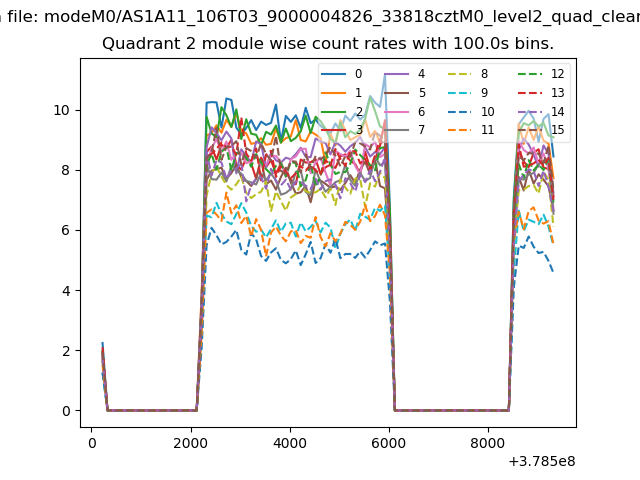
| Module-wise count rates for Quadrant B Data is divided into 100 sec bins |
 |
 |
| Module-wise count rates for Quadrant C Data is divided into 100 sec bins |
 |
 |
| Module-wise count rates for Quadrant D Data is divided into 100 sec bins |
 |
 |
| Parameter | Plot |
|---|---|
| CZT HV Monitor | 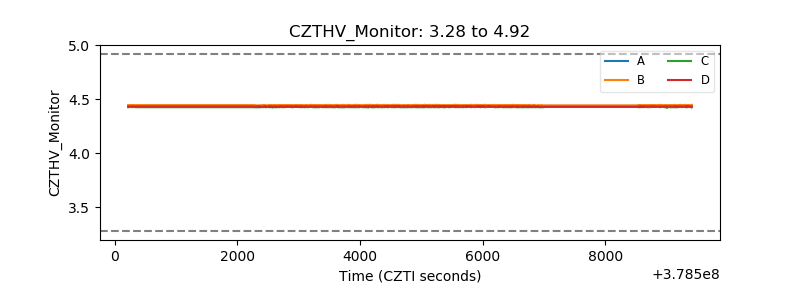 |
| D_VDD | 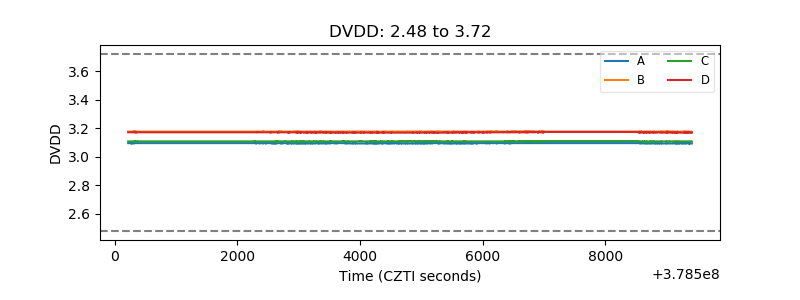 |
| Temperature 1 | 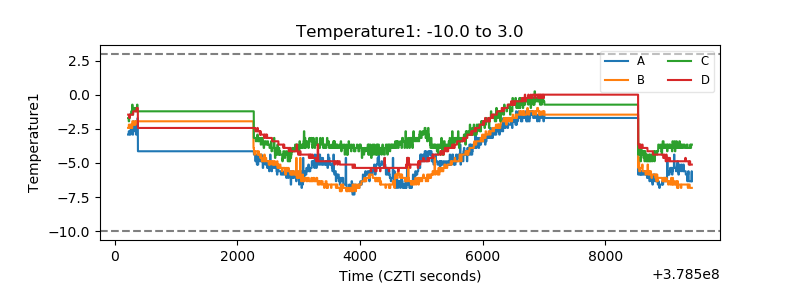 |
| Veto HV Monitor | 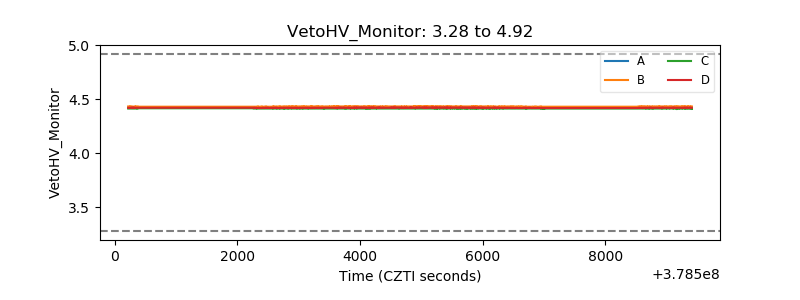 |
| Veto LLD | 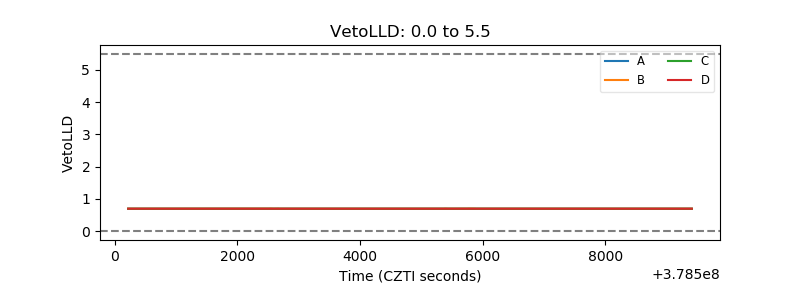 |
| Alpha Counter | 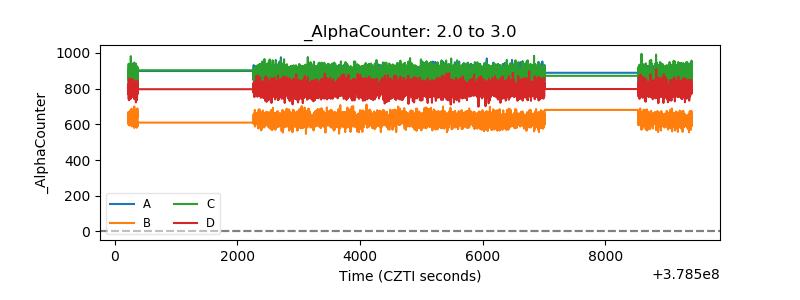 |
| _CPM_Rate | 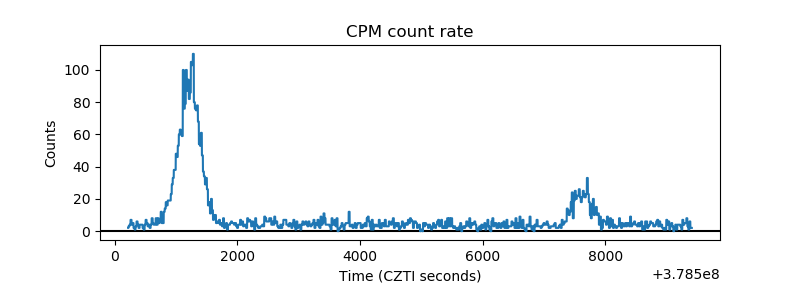 |
| CZT Counter | 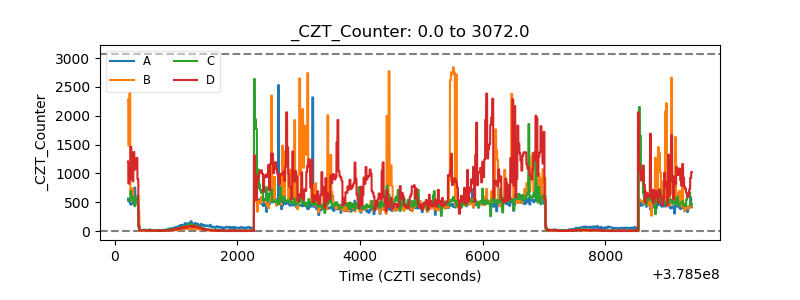 |
| +2.5 Volts monitor |  |
| +5 Volts monitor |  |
| _ROLL_ROT | 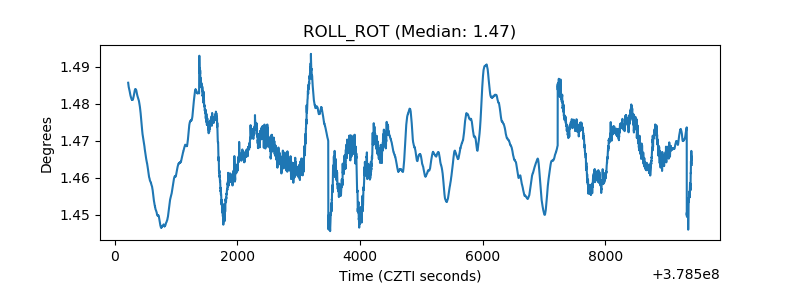 |
| _Roll_DEC |  |
| _Roll_RA | 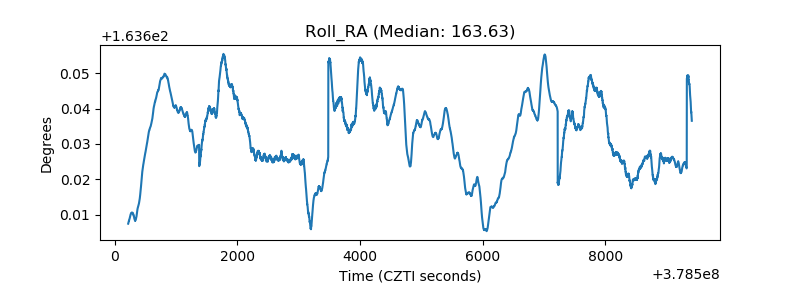 |
| Veto Counter | 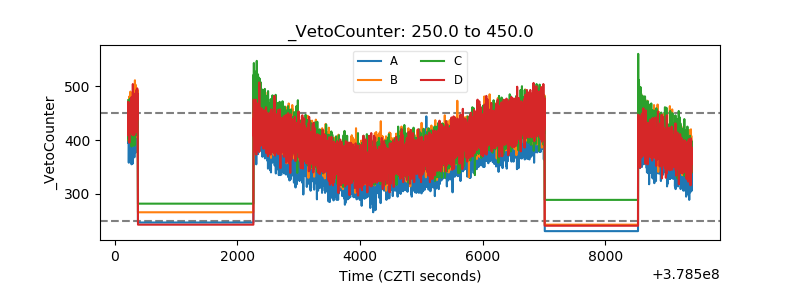 |