| Param | Original file | Final file |
|---|---|---|
| Filename | modeM0/AS1A11_106T03_9000004826_33819cztM0_level2.evt | modeM0/AS1A11_106T03_9000004826_33819cztM0_level2_quad_clean.evt |
| Size (bytes) | 594,875,520 | 83,960,640 |
| Size | 567.3 MB | 80.1 MB |
| Events in quadrant A | 4,026,236 | 532,404 |
| Events in quadrant B | 4,117,818 | 524,184 |
| Events in quadrant C | 3,828,122 | 531,163 |
| Events in quadrant D | 5,610,647 | 508,270 |
| Mode M9 | |||
|---|---|---|---|
| Quadrant | BADHDUFLAG | Total packets | Discarded packets |
| A | 0 | 29 | 0 |
| B | 0 | 29 | 0 |
| C | 0 | 29 | 0 |
| D | 0 | 29 | 0 |
| Mode SS | |||
|---|---|---|---|
| Quadrant | BADHDUFLAG | Total packets | Discarded packets |
| A | 0 | 132 | 0 |
| B | 0 | 132 | 0 |
| C | 0 | 132 | 0 |
| D | 0 | 132 | 0 |
| Mode M0 | |||
|---|---|---|---|
| Quadrant | BADHDUFLAG | Total packets | Discarded packets |
| A | 0 | 16491 | 3 |
| B | 0 | 16607 | 2 |
| C | 0 | 15378 | 2 |
| D | 0 | 21247 | 2 |
| Quadrant | Total seconds | Saturated seconds | Saturation percentage |
|---|---|---|---|
| A | 6397 | 417 | 6.518681% |
| B | 6397 | 300 | 4.689698% |
| C | 6397 | 122 | 1.907144% |
| D | 6397 | 249 | 3.892450% |
Noise dominated data is calculated using 1-second bins in cleaned event files. If a bin has >2000 counts, and if more than 50% of those come from <1% of pixels, then it is considered to be noise-dominated and hence unusable.
| Quadrant | # 1 sec bins | Bins with >0 counts | Bins with >2000 counts | High rate bins dominated by noise | Noise dominated (total time) | Noise dominated (detector-on time) | Marked lightcurve |
|---|---|---|---|---|---|---|---|
| A | 9262 | 6399 | 247 | 247 | 2.67% | 3.86% | 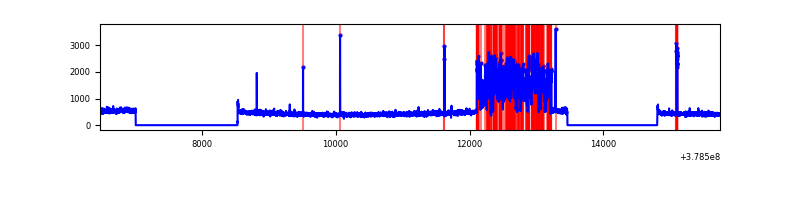 |
| B | 9262 | 6399 | 202 | 202 | 2.18% | 3.16% | 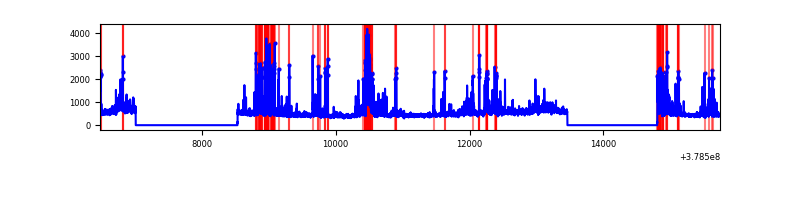 |
| C | 9262 | 6399 | 107 | 107 | 1.16% | 1.67% | 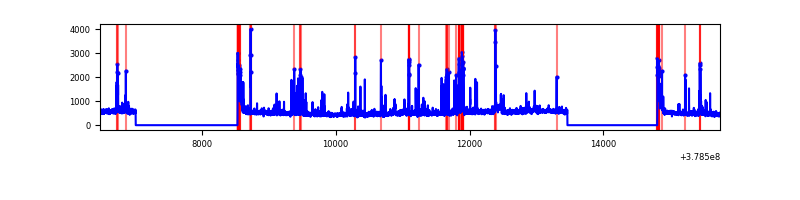 |
| D | 9262 | 6399 | 197 | 197 | 2.13% | 3.08% | 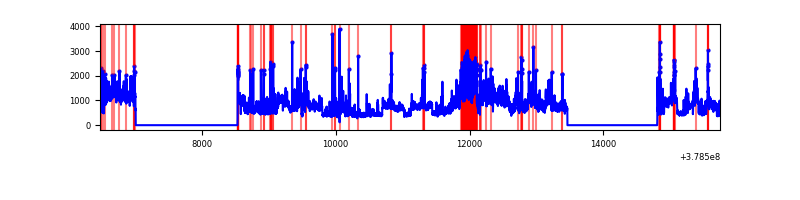 |
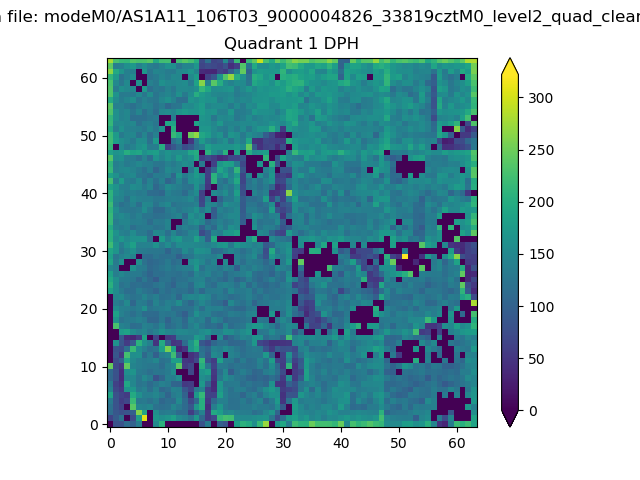
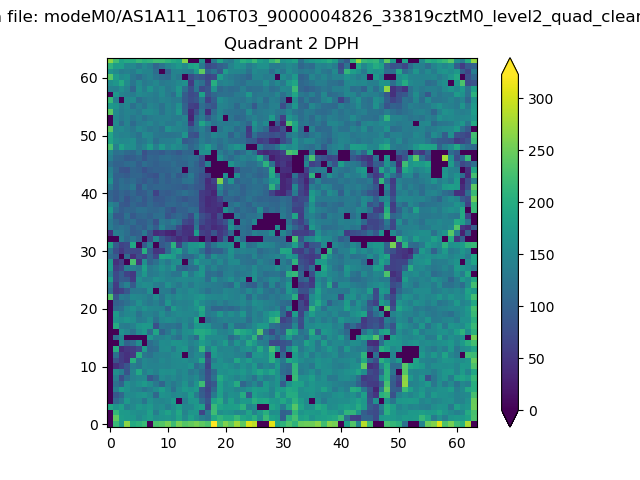
Top three noisy pixels from each quadrant. If the there are fewer than three noisy pixels in the level2.evt file, extra rows are filled as -1
| Pixel properties | Quadrant properties | ||||||
|---|---|---|---|---|---|---|---|
| Quadrant | DetID | PixID | Counts | Sigma | Mean | Median | Sigma |
| A | 15 | 169 | 1185679 | 8074.95 | 728 | 713 | 146.7 |
| A | 13 | 6 | 17079 | 111.53 | 728 | 713 | 146.7 |
| A | 13 | 254 | 11318 | 72.27 | 728 | 713 | 146.7 |
| B | 5 | 172 | 938079 | 6776.23 | 726 | 710 | 138.3 |
| B | 0 | 189 | 71995 | 515.32 | 726 | 710 | 138.3 |
| B | 4 | 232 | 38921 | 276.23 | 726 | 710 | 138.3 |
| C | 14 | 254 | 312761 | 1879.68 | 716 | 722 | 166.0 |
| C | 15 | 214 | 275214 | 1653.5 | 716 | 722 | 166.0 |
| C | 3 | 233 | 175102 | 1050.44 | 716 | 722 | 166.0 |
| D | 8 | 195 | 1599418 | 8711.77 | 710 | 691 | 183.5 |
| D | 2 | 250 | 553063 | 3009.98 | 710 | 691 | 183.5 |
| D | 12 | 235 | 281100 | 1528.0 | 710 | 691 | 183.5 |
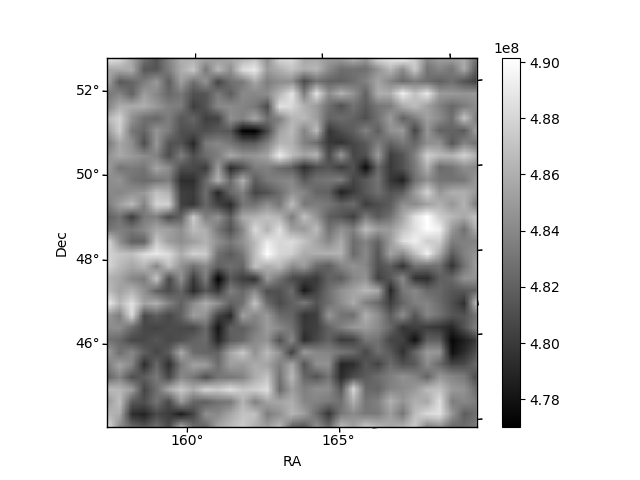
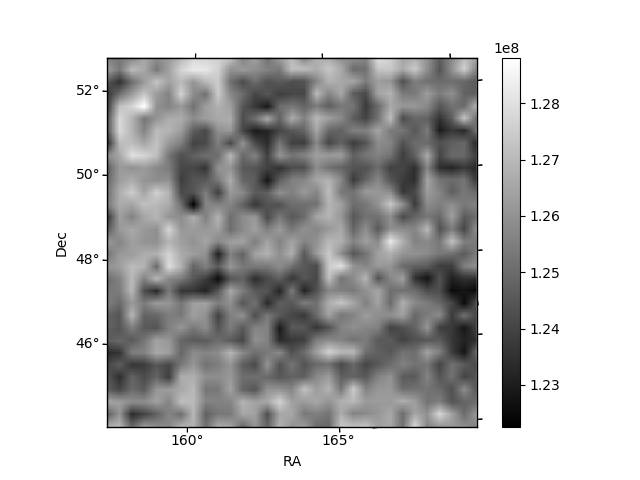
Histogram calculated using DETX and DETY for each event in the final _common_clean file
| Quadrant A | 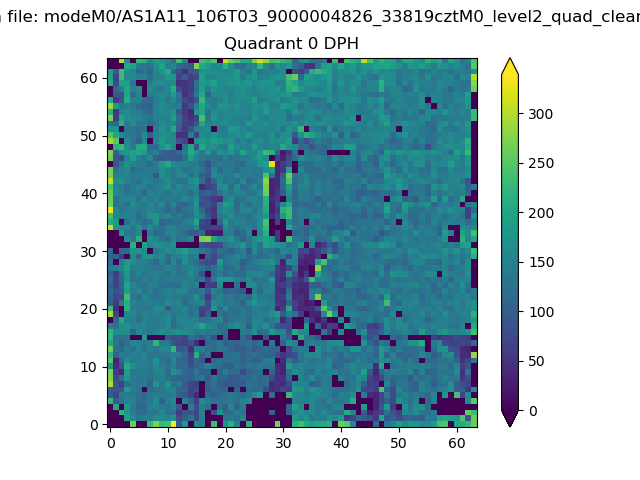 |
 |
Quadrant B |
|---|---|---|---|
| Quadrant D | 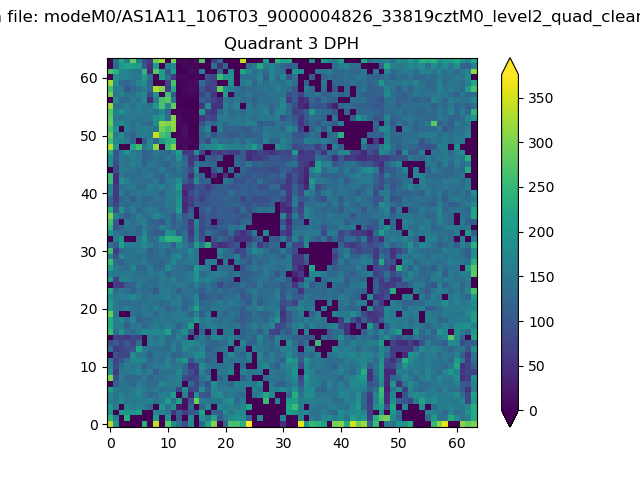 |
 |
Quadrant C |
| Plot type | Count rate plots | Images |
|---|---|---|
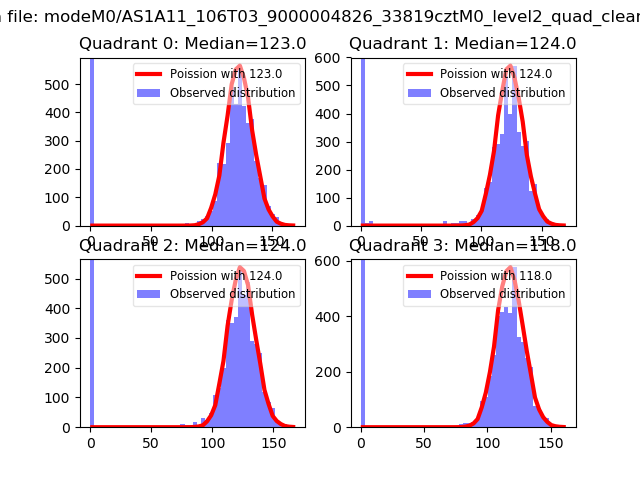
| Comparison with Poisson distribution Blue bars denote a histogram of data divided into 1 sec bins. Red curve is a Poisson curve with rate = median count rate of data. |
 |
 |
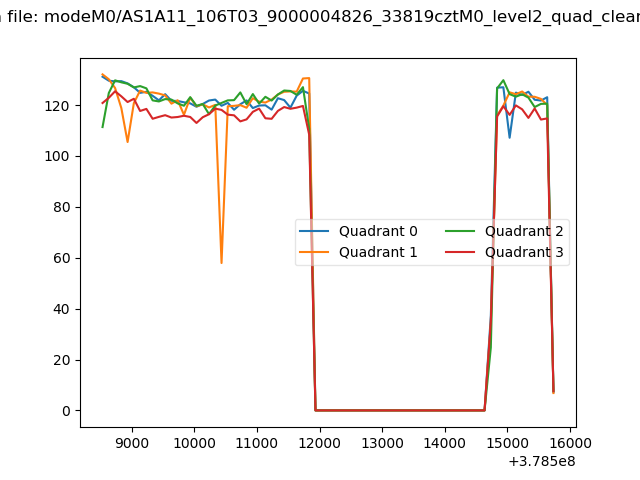
| Quadrant-wise count rates Data is divided into 100 sec bins |
 |
|
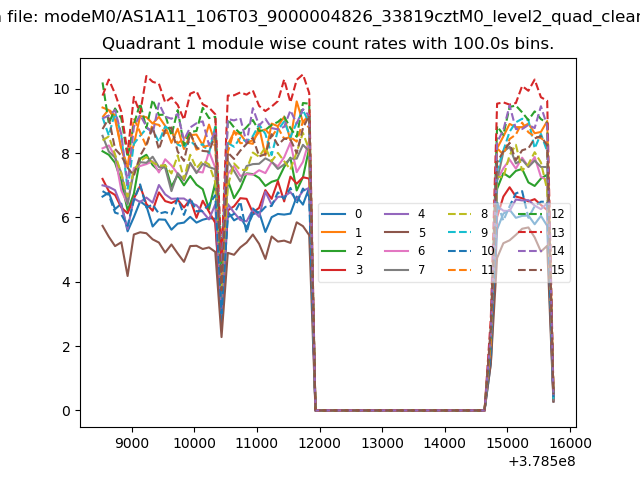
| Module-wise count rates for Quadrant A Data is divided into 100 sec bins |
 |
 |
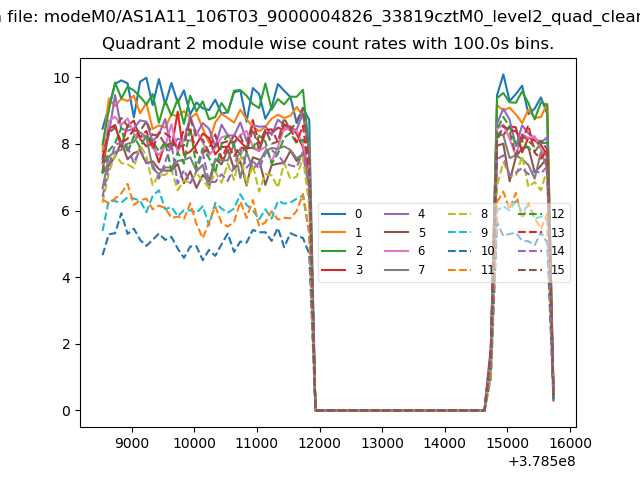
| Module-wise count rates for Quadrant B Data is divided into 100 sec bins |
 |
 |
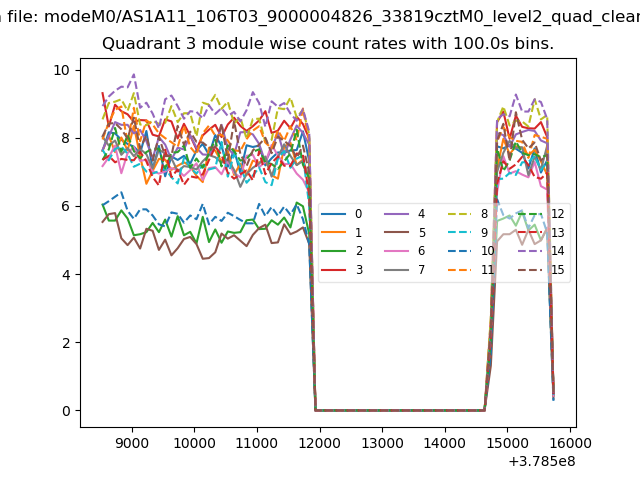
| Module-wise count rates for Quadrant C Data is divided into 100 sec bins |
 |
 |
| Module-wise count rates for Quadrant D Data is divided into 100 sec bins |
 |
 |
| Parameter | Plot |
|---|---|
| CZT HV Monitor | 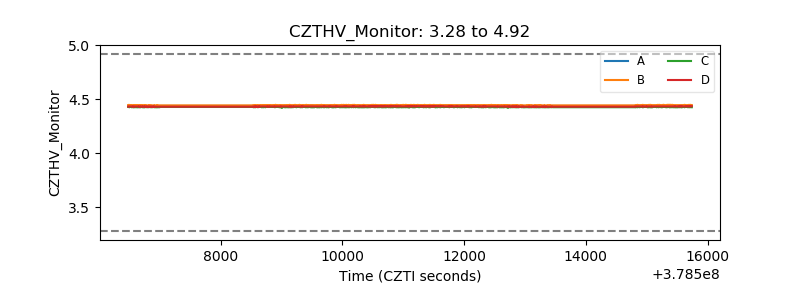 |
| D_VDD | 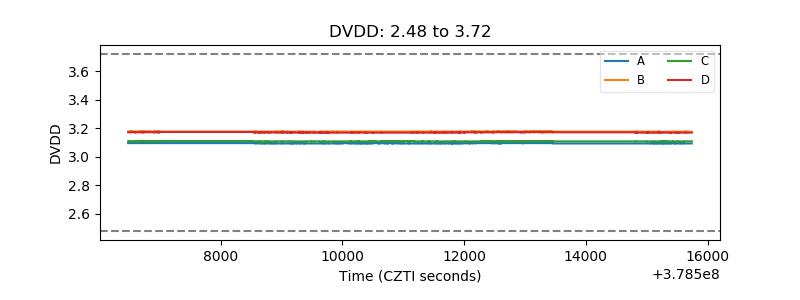 |
| Temperature 1 |  |
| Veto HV Monitor | 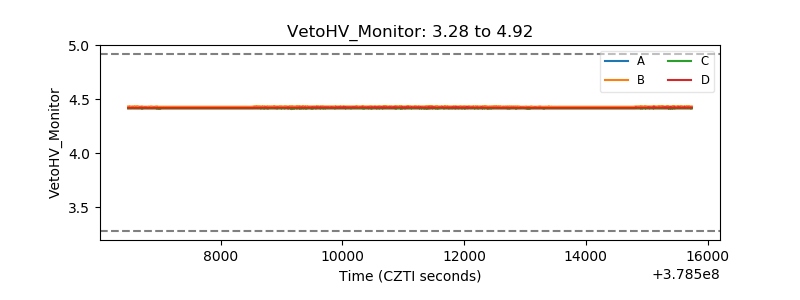 |
| Veto LLD | 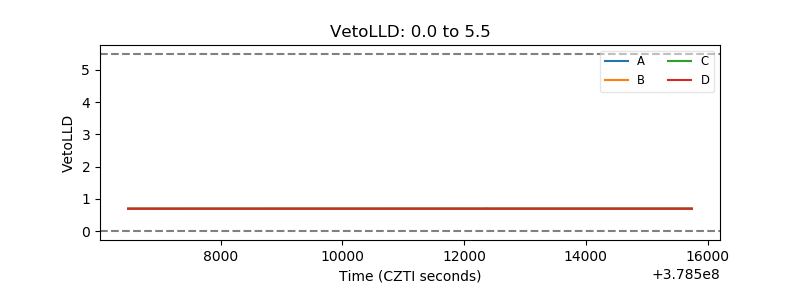 |
| Alpha Counter |  |
| _CPM_Rate | 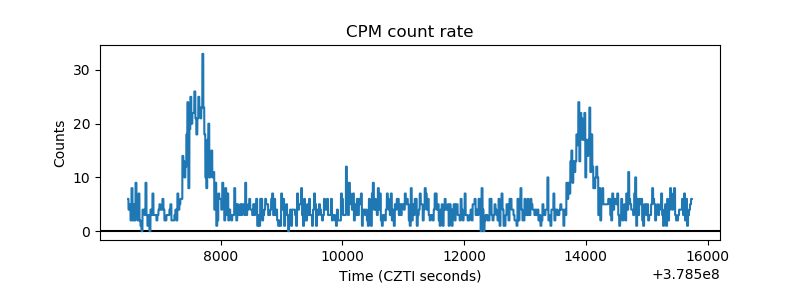 |
| CZT Counter | 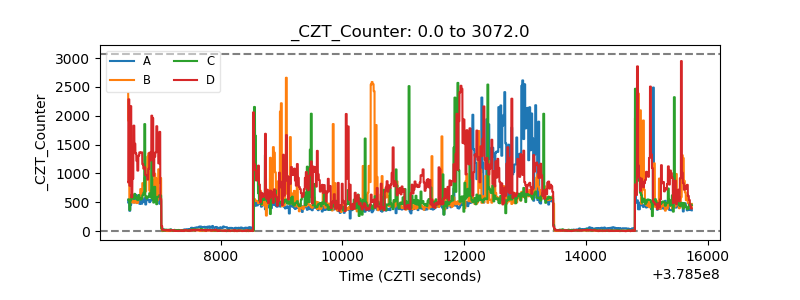 |
| +2.5 Volts monitor |  |
| +5 Volts monitor |  |
| _ROLL_ROT |  |
| _Roll_DEC |  |
| _Roll_RA | 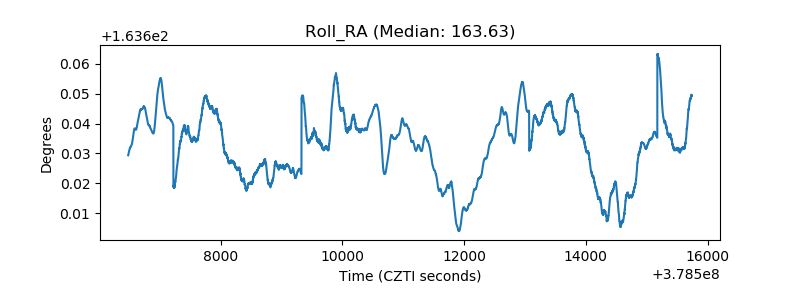 |
| Veto Counter | 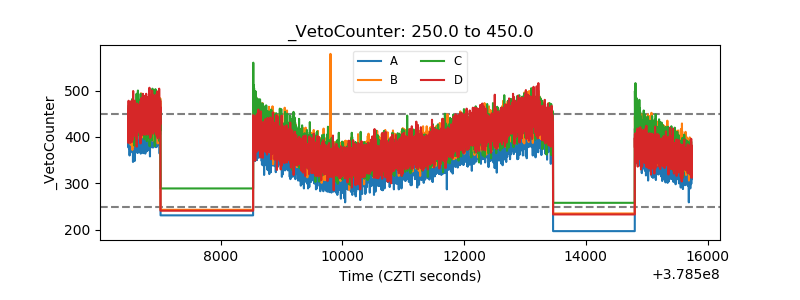 |